Cities with the Most Immigrants from Japan in Connecticut
RELATED REPORTS & OPTIONS
Japan
Connecticut
Compare Cities
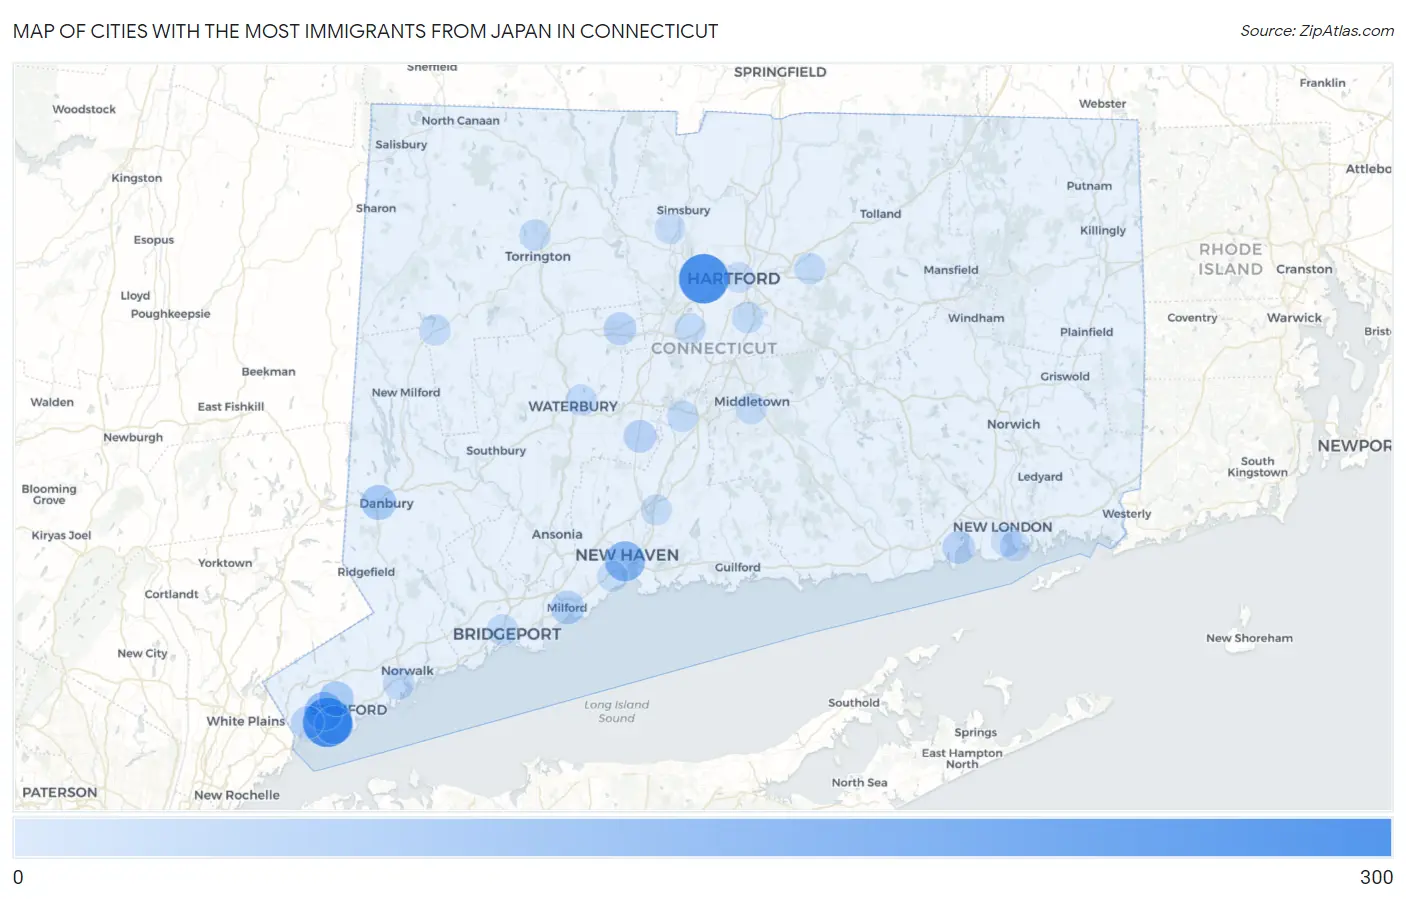
Map of Cities with the Most Immigrants from Japan in Connecticut
0
300
Cities with the Most Immigrants from Japan in Connecticut
| City | Japan | vs State | vs National | |
| 1. | West Hartford | 297 | 2,278(13.04%)#1 | 342,380(0.09%)#165 |
| 2. | Riverside | 290 | 2,278(12.73%)#2 | 342,380(0.08%)#173 |
| 3. | New Haven | 149 | 2,278(6.54%)#3 | 342,380(0.04%)#373 |
| 4. | Cos Cob | 125 | 2,278(5.49%)#4 | 342,380(0.04%)#442 |
| 5. | Old Greenwich | 124 | 2,278(5.44%)#5 | 342,380(0.04%)#444 |
| 6. | Danbury | 72 | 2,278(3.16%)#6 | 342,380(0.02%)#705 |
| 7. | Stamford | 71 | 2,278(3.12%)#7 | 342,380(0.02%)#710 |
| 8. | Milford City Balance | 52 | 2,278(2.28%)#8 | 342,380(0.02%)#917 |
| 9. | Bristol | 41 | 2,278(1.80%)#9 | 342,380(0.01%)#1,085 |
| 10. | Greenwich | 41 | 2,278(1.80%)#10 | 342,380(0.01%)#1,094 |
| 11. | Cheshire Village | 40 | 2,278(1.76%)#11 | 342,380(0.01%)#1,123 |
| 12. | Niantic | 40 | 2,278(1.76%)#12 | 342,380(0.01%)#1,124 |
| 13. | Norwalk | 25 | 2,278(1.10%)#13 | 342,380(0.01%)#1,509 |
| 14. | Torrington | 21 | 2,278(0.92%)#14 | 342,380(0.01%)#1,685 |
| 15. | New Britain | 20 | 2,278(0.88%)#15 | 342,380(0.01%)#1,736 |
| 16. | Meriden | 20 | 2,278(0.88%)#16 | 342,380(0.01%)#1,739 |
| 17. | Wethersfield | 20 | 2,278(0.88%)#17 | 342,380(0.01%)#1,751 |
| 18. | Bridgeport | 19 | 2,278(0.83%)#18 | 342,380(0.01%)#1,786 |
| 19. | Waterbury | 18 | 2,278(0.79%)#19 | 342,380(0.01%)#1,831 |
| 20. | Manchester | 18 | 2,278(0.79%)#20 | 342,380(0.01%)#1,840 |
| 21. | Middletown | 17 | 2,278(0.75%)#21 | 342,380(0.00%)#1,893 |
| 22. | New Preston | 15 | 2,278(0.66%)#22 | 342,380(0.00%)#2,085 |
| 23. | Staples | 14 | 2,278(0.61%)#23 | 342,380(0.00%)#2,132 |
| 24. | North Haven | 13 | 2,278(0.57%)#24 | 342,380(0.00%)#2,188 |
| 25. | West Haven | 12 | 2,278(0.53%)#25 | 342,380(0.00%)#2,261 |
| 26. | New London | 12 | 2,278(0.53%)#26 | 342,380(0.00%)#2,277 |
| 27. | New Canaan | 12 | 2,278(0.53%)#27 | 342,380(0.00%)#2,328 |
| 28. | Weatogue | 12 | 2,278(0.53%)#28 | 342,380(0.00%)#2,345 |
| 29. | Hartford | 11 | 2,278(0.48%)#29 | 342,380(0.00%)#2,361 |
| 30. | Groton | 4 | 2,278(0.18%)#30 | 342,380(0.00%)#3,163 |
1
2Common Questions
What are the Top 10 Cities with the Most Immigrants from Japan in Connecticut?
Top 10 Cities with the Most Immigrants from Japan in Connecticut are:
#1
297
#2
290
#3
149
#4
125
#5
124
#6
72
#7
71
#8
52
#9
41
#10
41
What city has the Most Immigrants from Japan in Connecticut?
West Hartford has the Most Immigrants from Japan in Connecticut with 297.
What is the Total Immigrants from Japan in the State of Connecticut?
Total Immigrants from Japan in Connecticut is 2,278.
What is the Total Immigrants from Japan in the United States?
Total Immigrants from Japan in the United States is 342,380.