Cities with the Highest Percentage of Lebanese Population in Kansas
RELATED REPORTS & OPTIONS
Lebanese
Kansas
Compare Cities
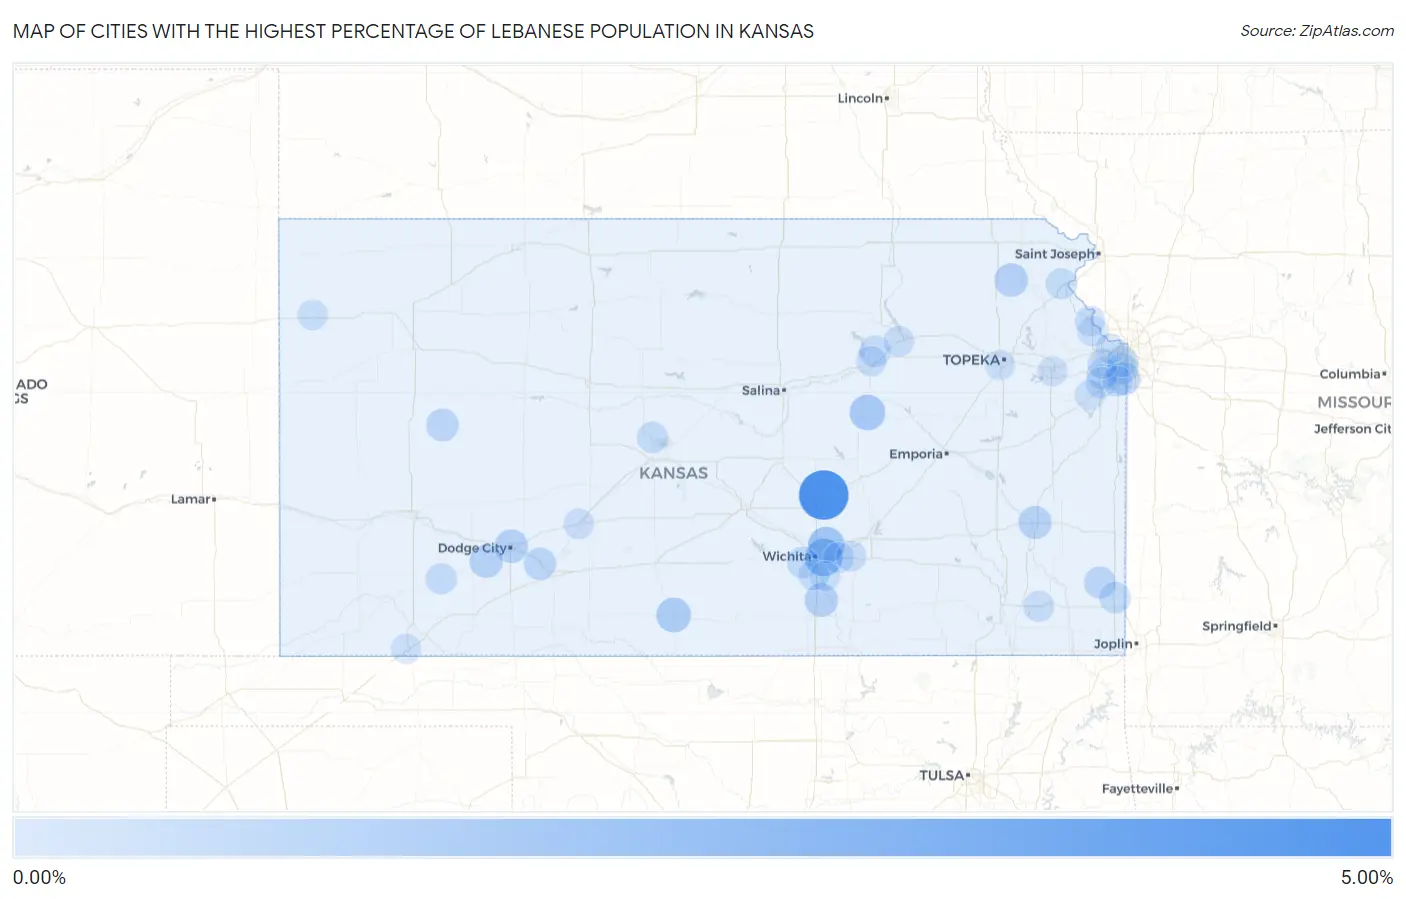
Map of Cities with the Highest Percentage of Lebanese Population in Kansas
0.00%
5.00%
Cities with the Highest Percentage of Lebanese Population in Kansas
| City | Lebanese | vs State | vs National | |
| 1. | Walton | 4.50% | 0.12%(+4.38)#1 | 0.17%(+4.33)#50 |
| 2. | Eastborough | 1.69% | 0.12%(+1.57)#2 | 0.17%(+1.52)#275 |
| 3. | Bel Aire | 1.41% | 0.12%(+1.30)#3 | 0.17%(+1.25)#364 |
| 4. | Herington | 1.21% | 0.12%(+1.09)#4 | 0.17%(+1.04)#459 |
| 5. | Medicine Lodge | 1.02% | 0.12%(+0.901)#5 | 0.17%(+0.852)#574 |
| 6. | Whiting | 0.78% | 0.12%(+0.663)#6 | 0.17%(+0.613)#806 |
| 7. | Dodge City | 0.77% | 0.12%(+0.653)#7 | 0.17%(+0.603)#820 |
| 8. | Belle Plaine | 0.76% | 0.12%(+0.646)#8 | 0.17%(+0.596)#832 |
| 9. | Ensign | 0.71% | 0.12%(+0.599)#9 | 0.17%(+0.549)#897 |
| 10. | Iola | 0.65% | 0.12%(+0.533)#10 | 0.17%(+0.484)#1,008 |
| 11. | Leawood | 0.59% | 0.12%(+0.479)#11 | 0.17%(+0.430)#1,102 |
| 12. | Healy | 0.54% | 0.12%(+0.429)#12 | 0.17%(+0.380)#1,220 |
| 13. | Ford | 0.49% | 0.12%(+0.372)#13 | 0.17%(+0.323)#1,358 |
| 14. | Girard | 0.42% | 0.12%(+0.301)#14 | 0.17%(+0.252)#1,613 |
| 15. | Pittsburg | 0.34% | 0.12%(+0.224)#15 | 0.17%(+0.174)#1,943 |
| 16. | Wichita | 0.34% | 0.12%(+0.223)#16 | 0.17%(+0.173)#1,951 |
| 17. | Prairie Village | 0.32% | 0.12%(+0.203)#17 | 0.17%(+0.153)#2,061 |
| 18. | Fort Riley | 0.30% | 0.12%(+0.186)#18 | 0.17%(+0.136)#2,166 |
| 19. | Hoisington | 0.26% | 0.12%(+0.146)#19 | 0.17%(+0.097)#2,401 |
| 20. | Lenexa | 0.26% | 0.12%(+0.142)#20 | 0.17%(+0.092)#2,437 |
| 21. | Olathe | 0.23% | 0.12%(+0.112)#21 | 0.17%(+0.063)#2,662 |
| 22. | Copeland | 0.22% | 0.12%(+0.106)#22 | 0.17%(+0.056)#2,727 |
| 23. | Roeland Park | 0.22% | 0.12%(+0.103)#23 | 0.17%(+0.054)#2,752 |
| 24. | Haysville | 0.20% | 0.12%(+0.086)#24 | 0.17%(+0.037)#2,897 |
| 25. | Atchison | 0.19% | 0.12%(+0.078)#25 | 0.17%(+0.029)#2,987 |
| 26. | Andover | 0.16% | 0.12%(+0.046)#26 | 0.17%(-0.003)#3,318 |
| 27. | Manhattan | 0.16% | 0.12%(+0.043)#27 | 0.17%(-0.007)#3,350 |
| 28. | Parsons | 0.14% | 0.12%(+0.020)#28 | 0.17%(-0.029)#3,592 |
| 29. | Overland Park | 0.11% | 0.12%(-0.003)#29 | 0.17%(-0.053)#3,838 |
| 30. | Augusta | 0.097% | 0.12%(-0.018)#30 | 0.17%(-0.068)#4,025 |
| 31. | Goodland | 0.079% | 0.12%(-0.037)#31 | 0.17%(-0.086)#4,253 |
| 32. | Kinsley | 0.073% | 0.12%(-0.043)#32 | 0.17%(-0.092)#4,316 |
| 33. | Lansing | 0.071% | 0.12%(-0.045)#33 | 0.17%(-0.094)#4,338 |
| 34. | Leavenworth | 0.051% | 0.12%(-0.065)#34 | 0.17%(-0.114)#4,636 |
| 35. | Junction City | 0.044% | 0.12%(-0.072)#35 | 0.17%(-0.121)#4,733 |
| 36. | Gardner | 0.038% | 0.12%(-0.077)#36 | 0.17%(-0.127)#4,790 |
| 37. | Derby | 0.035% | 0.12%(-0.080)#37 | 0.17%(-0.130)#4,823 |
| 38. | Topeka | 0.033% | 0.12%(-0.082)#38 | 0.17%(-0.132)#4,848 |
| 39. | Lawrence | 0.032% | 0.12%(-0.084)#39 | 0.17%(-0.134)#4,874 |
| 40. | Shawnee | 0.031% | 0.12%(-0.085)#40 | 0.17%(-0.134)#4,878 |
| 41. | Liberal | 0.026% | 0.12%(-0.089)#41 | 0.17%(-0.139)#4,925 |
| 42. | Kansas City | 0.0026% | 0.12%(-0.113)#42 | 0.17%(-0.163)#5,082 |
Common Questions
What are the Top 10 Cities with the Highest Percentage of Lebanese Population in Kansas?
Top 10 Cities with the Highest Percentage of Lebanese Population in Kansas are:
#1
4.50%
#2
1.69%
#3
1.41%
#4
1.21%
#5
1.02%
#6
0.78%
#7
0.77%
#8
0.76%
#9
0.71%
#10
0.65%
What city has the Highest Percentage of Lebanese Population in Kansas?
Walton has the Highest Percentage of Lebanese Population in Kansas with 4.50%.
What is the Percentage of Lebanese Population in the State of Kansas?
Percentage of Lebanese Population in Kansas is 0.12%.
What is the Percentage of Lebanese Population in the United States?
Percentage of Lebanese Population in the United States is 0.17%.