Cities with the Highest Percentage of Lebanese Population in North Carolina
RELATED REPORTS & OPTIONS
Lebanese
North Carolina
Compare Cities
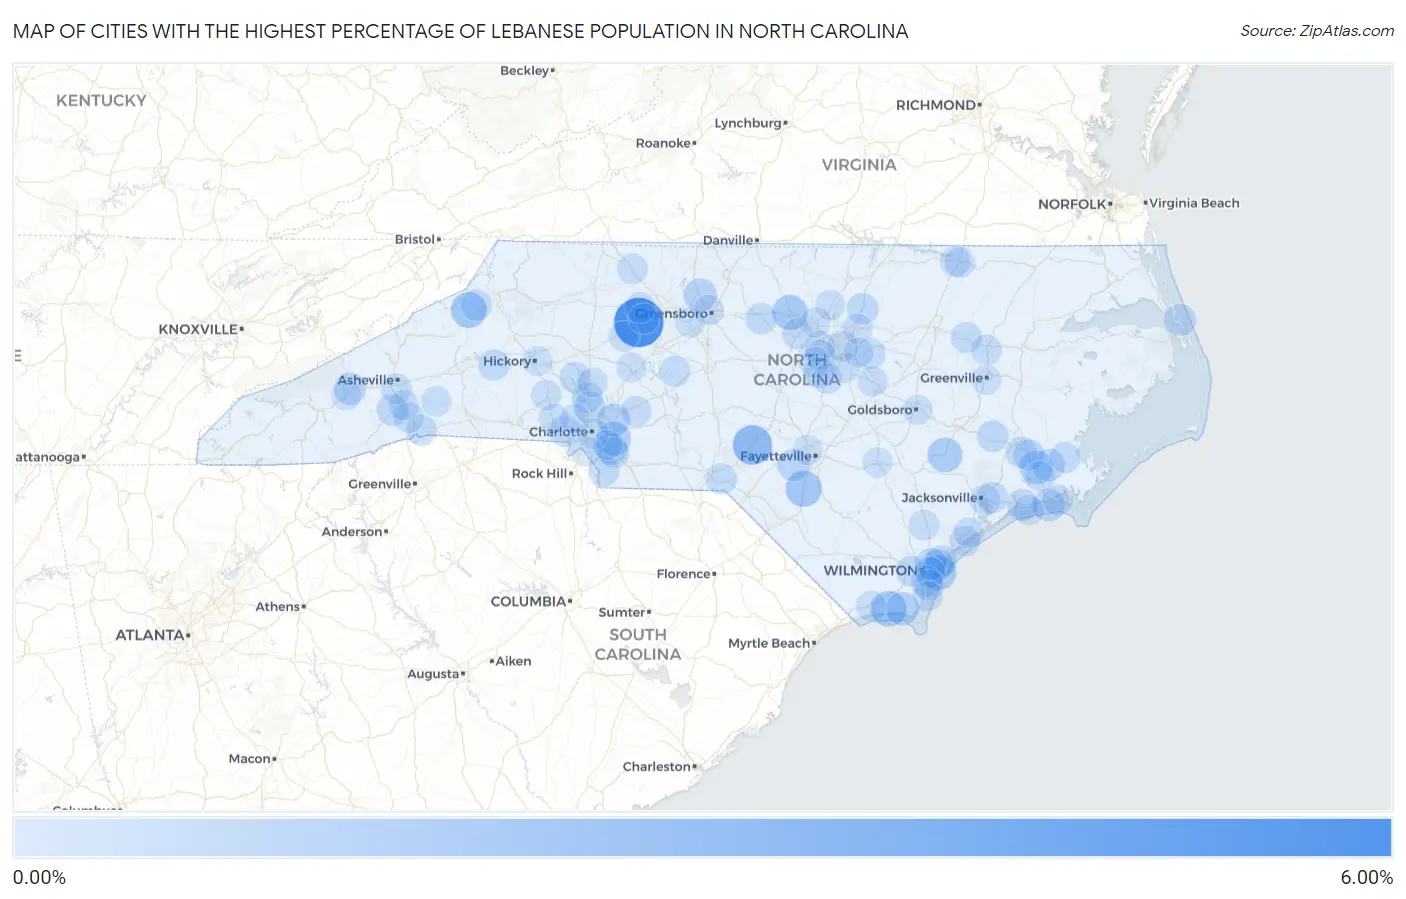
Map of Cities with the Highest Percentage of Lebanese Population in North Carolina
0.00%
6.00%
Cities with the Highest Percentage of Lebanese Population in North Carolina
| City | Lebanese | vs State | vs National | |
| 1. | Bermuda Run | 5.45% | 0.13%(+5.33)#1 | 0.17%(+5.29)#37 |
| 2. | Aberdeen | 2.57% | 0.13%(+2.44)#2 | 0.17%(+2.41)#131 |
| 3. | St Pauls | 1.68% | 0.13%(+1.55)#3 | 0.17%(+1.52)#276 |
| 4. | Newland | 1.62% | 0.13%(+1.49)#4 | 0.17%(+1.45)#294 |
| 5. | Varnamtown | 1.57% | 0.13%(+1.44)#5 | 0.17%(+1.40)#309 |
| 6. | Hillsborough | 1.46% | 0.13%(+1.33)#6 | 0.17%(+1.29)#349 |
| 7. | Wrightsville Beach | 1.37% | 0.13%(+1.24)#7 | 0.17%(+1.20)#385 |
| 8. | Pink Hill | 1.33% | 0.13%(+1.20)#8 | 0.17%(+1.16)#405 |
| 9. | Mint Hill | 1.12% | 0.13%(+0.992)#9 | 0.17%(+0.954)#509 |
| 10. | Neuse Forest | 0.97% | 0.13%(+0.838)#10 | 0.17%(+0.800)#608 |
| 11. | St James | 0.91% | 0.13%(+0.787)#11 | 0.17%(+0.749)#655 |
| 12. | Summerfield | 0.86% | 0.13%(+0.738)#12 | 0.17%(+0.700)#709 |
| 13. | Harrisburg | 0.85% | 0.13%(+0.723)#13 | 0.17%(+0.685)#723 |
| 14. | Pine Knoll Shores | 0.73% | 0.13%(+0.607)#14 | 0.17%(+0.569)#865 |
| 15. | Rockfish | 0.67% | 0.13%(+0.546)#15 | 0.17%(+0.507)#969 |
| 16. | Minnesott Beach | 0.62% | 0.13%(+0.490)#16 | 0.17%(+0.452)#1,069 |
| 17. | Lake Junaluska | 0.57% | 0.13%(+0.444)#17 | 0.17%(+0.406)#1,157 |
| 18. | Stallings | 0.54% | 0.13%(+0.410)#18 | 0.17%(+0.372)#1,233 |
| 19. | Cape Carteret | 0.53% | 0.13%(+0.401)#19 | 0.17%(+0.363)#1,244 |
| 20. | Kill Devil Hills | 0.52% | 0.13%(+0.395)#20 | 0.17%(+0.357)#1,262 |
| 21. | Mills River | 0.52% | 0.13%(+0.394)#21 | 0.17%(+0.356)#1,265 |
| 22. | Porters Neck | 0.52% | 0.13%(+0.389)#22 | 0.17%(+0.351)#1,276 |
| 23. | Ogden | 0.49% | 0.13%(+0.367)#23 | 0.17%(+0.329)#1,337 |
| 24. | Briar Chapel | 0.49% | 0.13%(+0.361)#24 | 0.17%(+0.322)#1,359 |
| 25. | Anderson Creek | 0.48% | 0.13%(+0.358)#25 | 0.17%(+0.319)#1,371 |
| 26. | Franklinton | 0.48% | 0.13%(+0.358)#26 | 0.17%(+0.319)#1,372 |
| 27. | Cove City | 0.47% | 0.13%(+0.347)#27 | 0.17%(+0.309)#1,406 |
| 28. | Kings Grant | 0.47% | 0.13%(+0.340)#28 | 0.17%(+0.302)#1,427 |
| 29. | Swepsonville | 0.45% | 0.13%(+0.320)#29 | 0.17%(+0.281)#1,497 |
| 30. | New Bern | 0.44% | 0.13%(+0.313)#30 | 0.17%(+0.275)#1,516 |
| 31. | Huntersville | 0.44% | 0.13%(+0.311)#31 | 0.17%(+0.273)#1,527 |
| 32. | Sugar Mountain | 0.41% | 0.13%(+0.282)#32 | 0.17%(+0.244)#1,642 |
| 33. | Cramerton | 0.40% | 0.13%(+0.270)#33 | 0.17%(+0.232)#1,691 |
| 34. | James City | 0.39% | 0.13%(+0.259)#34 | 0.17%(+0.221)#1,732 |
| 35. | Hamlet | 0.38% | 0.13%(+0.254)#35 | 0.17%(+0.215)#1,756 |
| 36. | Salem | 0.37% | 0.13%(+0.240)#36 | 0.17%(+0.202)#1,814 |
| 37. | Lake Norman Of Catawba | 0.36% | 0.13%(+0.232)#37 | 0.17%(+0.194)#1,853 |
| 38. | Piney Green | 0.36% | 0.13%(+0.232)#38 | 0.17%(+0.194)#1,855 |
| 39. | Silver Lake | 0.34% | 0.13%(+0.215)#39 | 0.17%(+0.176)#1,939 |
| 40. | Tarboro | 0.33% | 0.13%(+0.200)#40 | 0.17%(+0.162)#2,007 |
| 41. | Saluda | 0.32% | 0.13%(+0.197)#41 | 0.17%(+0.159)#2,024 |
| 42. | Cornelius | 0.32% | 0.13%(+0.195)#42 | 0.17%(+0.157)#2,038 |
| 43. | Wendell | 0.32% | 0.13%(+0.195)#43 | 0.17%(+0.156)#2,043 |
| 44. | Waxhaw | 0.31% | 0.13%(+0.188)#44 | 0.17%(+0.149)#2,083 |
| 45. | Oriental | 0.31% | 0.13%(+0.183)#45 | 0.17%(+0.145)#2,111 |
| 46. | Denton | 0.31% | 0.13%(+0.179)#46 | 0.17%(+0.141)#2,134 |
| 47. | Indian Trail | 0.30% | 0.13%(+0.173)#47 | 0.17%(+0.135)#2,173 |
| 48. | Leland | 0.29% | 0.13%(+0.167)#48 | 0.17%(+0.129)#2,214 |
| 49. | Chapel Hill | 0.29% | 0.13%(+0.162)#49 | 0.17%(+0.123)#2,239 |
| 50. | Burgaw | 0.28% | 0.13%(+0.154)#50 | 0.17%(+0.115)#2,283 |
| 51. | Raleigh | 0.27% | 0.13%(+0.145)#51 | 0.17%(+0.107)#2,338 |
| 52. | Asheville | 0.26% | 0.13%(+0.136)#52 | 0.17%(+0.097)#2,394 |
| 53. | Jacksonville | 0.26% | 0.13%(+0.135)#53 | 0.17%(+0.096)#2,406 |
| 54. | Surf City | 0.26% | 0.13%(+0.130)#54 | 0.17%(+0.092)#2,438 |
| 55. | Bethel | 0.25% | 0.13%(+0.122)#55 | 0.17%(+0.084)#2,492 |
| 56. | Morehead City | 0.25% | 0.13%(+0.122)#56 | 0.17%(+0.084)#2,494 |
| 57. | Morrisville | 0.25% | 0.13%(+0.122)#57 | 0.17%(+0.084)#2,500 |
| 58. | Apex | 0.25% | 0.13%(+0.120)#58 | 0.17%(+0.082)#2,515 |
| 59. | Pilot Mountain | 0.24% | 0.13%(+0.113)#59 | 0.17%(+0.075)#2,563 |
| 60. | Shallotte | 0.24% | 0.13%(+0.110)#60 | 0.17%(+0.072)#2,584 |
| 61. | Cary | 0.23% | 0.13%(+0.106)#61 | 0.17%(+0.068)#2,617 |
| 62. | Holly Springs | 0.23% | 0.13%(+0.104)#62 | 0.17%(+0.066)#2,644 |
| 63. | Mount Pleasant | 0.23% | 0.13%(+0.098)#63 | 0.17%(+0.060)#2,685 |
| 64. | Roanoke Rapids | 0.22% | 0.13%(+0.098)#64 | 0.17%(+0.059)#2,688 |
| 65. | Wilmington | 0.21% | 0.13%(+0.086)#65 | 0.17%(+0.048)#2,812 |
| 66. | Myrtle Grove | 0.21% | 0.13%(+0.080)#66 | 0.17%(+0.042)#2,861 |
| 67. | Hendersonville | 0.21% | 0.13%(+0.078)#67 | 0.17%(+0.040)#2,870 |
| 68. | Charlotte | 0.21% | 0.13%(+0.078)#68 | 0.17%(+0.040)#2,872 |
| 69. | Weldon | 0.20% | 0.13%(+0.068)#69 | 0.17%(+0.030)#2,971 |
| 70. | Wilson S Mills | 0.19% | 0.13%(+0.067)#70 | 0.17%(+0.029)#2,989 |
| 71. | Lewisville | 0.19% | 0.13%(+0.058)#71 | 0.17%(+0.020)#3,072 |
| 72. | Carolina Beach | 0.18% | 0.13%(+0.055)#72 | 0.17%(+0.017)#3,093 |
| 73. | Fuquay Varina | 0.18% | 0.13%(+0.048)#73 | 0.17%(+0.010)#3,180 |
| 74. | Fletcher | 0.18% | 0.13%(+0.048)#74 | 0.17%(+0.010)#3,181 |
| 75. | Mocksville | 0.17% | 0.13%(+0.042)#75 | 0.17%(+0.004)#3,240 |
| 76. | Lincolnton | 0.16% | 0.13%(+0.033)#76 | 0.17%(-0.005)#3,331 |
| 77. | Garner | 0.14% | 0.13%(+0.009)#77 | 0.17%(-0.029)#3,595 |
| 78. | Havelock | 0.13% | 0.13%(+0.004)#78 | 0.17%(-0.034)#3,651 |
| 79. | Emerald Isle | 0.13% | 0.13%(+0.002)#79 | 0.17%(-0.036)#3,663 |
| 80. | Lake Lure | 0.13% | 0.13%(+0.000)#80 | 0.17%(-0.038)#3,684 |
| 81. | Dallas | 0.12% | 0.13%(-0.008)#81 | 0.17%(-0.046)#3,767 |
| 82. | Holly Ridge | 0.12% | 0.13%(-0.009)#82 | 0.17%(-0.047)#3,775 |
| 83. | Clemmons | 0.12% | 0.13%(-0.009)#83 | 0.17%(-0.048)#3,782 |
| 84. | Durham | 0.12% | 0.13%(-0.010)#84 | 0.17%(-0.048)#3,785 |
| 85. | Salisbury | 0.11% | 0.13%(-0.020)#85 | 0.17%(-0.058)#3,902 |
| 86. | Greensboro | 0.100% | 0.13%(-0.027)#86 | 0.17%(-0.065)#3,989 |
| 87. | Clinton | 0.096% | 0.13%(-0.031)#87 | 0.17%(-0.069)#4,053 |
| 88. | Butner | 0.096% | 0.13%(-0.031)#88 | 0.17%(-0.070)#4,057 |
| 89. | Pineville | 0.095% | 0.13%(-0.032)#89 | 0.17%(-0.070)#4,064 |
| 90. | Mooresville | 0.092% | 0.13%(-0.035)#90 | 0.17%(-0.073)#4,088 |
| 91. | Matthews | 0.088% | 0.13%(-0.039)#91 | 0.17%(-0.077)#4,119 |
| 92. | Wake Forest | 0.087% | 0.13%(-0.039)#92 | 0.17%(-0.078)#4,125 |
| 93. | Mount Holly | 0.085% | 0.13%(-0.042)#93 | 0.17%(-0.080)#4,165 |
| 94. | Goldsboro | 0.080% | 0.13%(-0.046)#94 | 0.17%(-0.085)#4,242 |
| 95. | High Point | 0.075% | 0.13%(-0.052)#95 | 0.17%(-0.090)#4,287 |
| 96. | Hickory | 0.074% | 0.13%(-0.053)#96 | 0.17%(-0.091)#4,300 |
| 97. | Fayetteville | 0.072% | 0.13%(-0.055)#97 | 0.17%(-0.093)#4,323 |
| 98. | Knightdale | 0.068% | 0.13%(-0.059)#98 | 0.17%(-0.097)#4,389 |
| 99. | Waynesville | 0.068% | 0.13%(-0.059)#99 | 0.17%(-0.097)#4,392 |
| 100. | Greenville | 0.067% | 0.13%(-0.060)#100 | 0.17%(-0.098)#4,405 |
Common Questions
What are the Top 10 Cities with the Highest Percentage of Lebanese Population in North Carolina?
Top 10 Cities with the Highest Percentage of Lebanese Population in North Carolina are:
#1
5.45%
#2
2.57%
#3
1.68%
#4
1.62%
#5
1.57%
#6
1.46%
#7
1.37%
#8
1.33%
#9
1.12%
#10
0.97%
What city has the Highest Percentage of Lebanese Population in North Carolina?
Bermuda Run has the Highest Percentage of Lebanese Population in North Carolina with 5.45%.
What is the Percentage of Lebanese Population in the State of North Carolina?
Percentage of Lebanese Population in North Carolina is 0.13%.
What is the Percentage of Lebanese Population in the United States?
Percentage of Lebanese Population in the United States is 0.17%.