Cities with the Highest Percentage of Lebanese Population in Michigan
RELATED REPORTS & OPTIONS
Lebanese
Michigan
Compare Cities
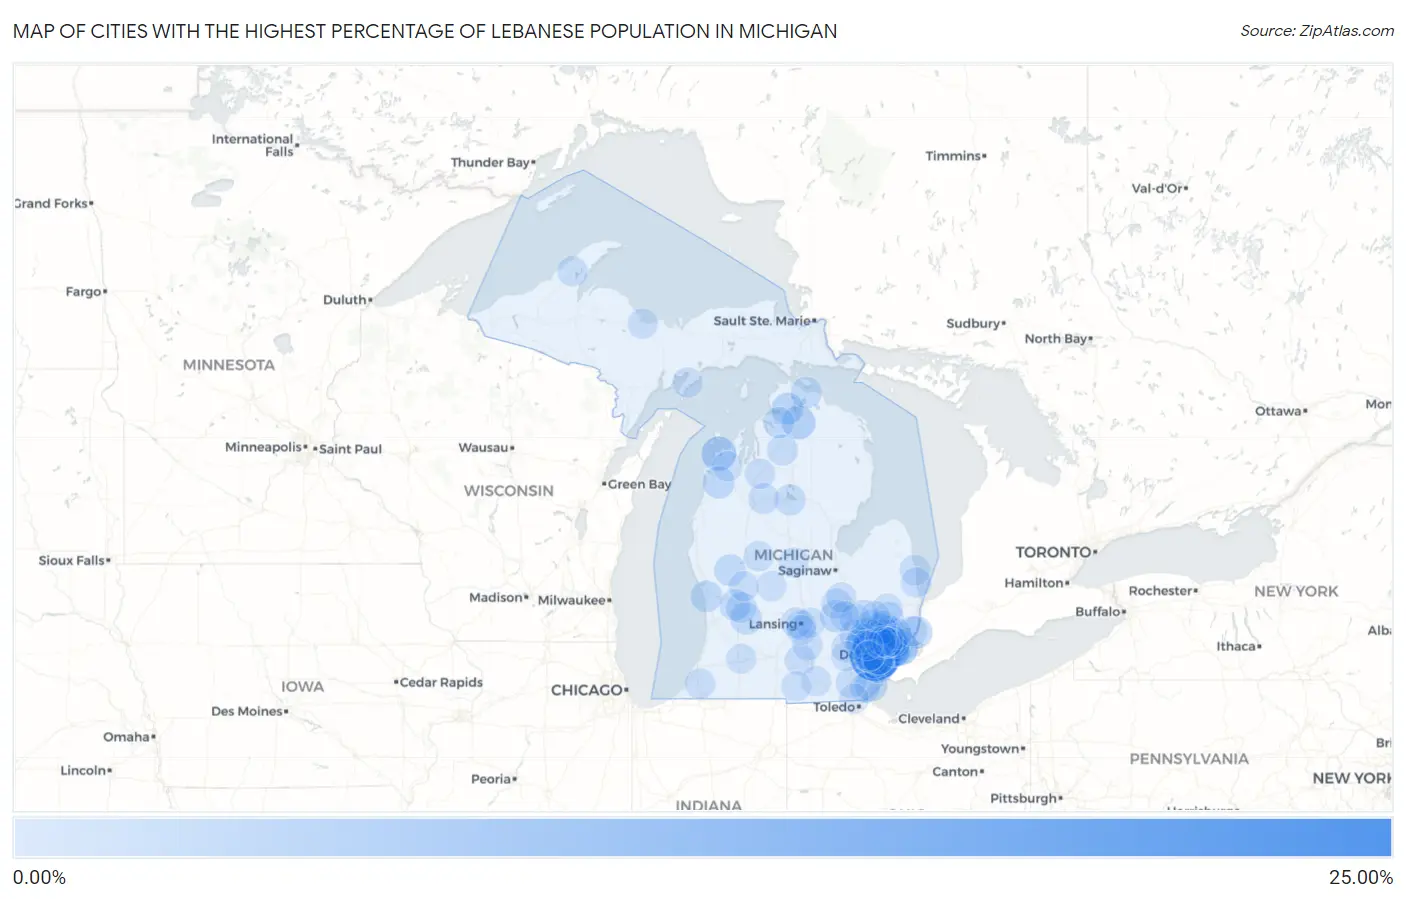
Map of Cities with the Highest Percentage of Lebanese Population in Michigan
0.00%
25.00%
Cities with the Highest Percentage of Lebanese Population in Michigan
| City | Lebanese | vs State | vs National | |
| 1. | Dearborn Heights | 21.06% | 0.69%(+20.4)#1 | 0.17%(+20.9)#4 |
| 2. | Dearborn | 17.21% | 0.69%(+16.5)#2 | 0.17%(+17.0)#6 |
| 3. | Village Of Grosse Pointe Shores | 6.67% | 0.69%(+5.97)#3 | 0.17%(+6.50)#23 |
| 4. | Glen Arbor | 4.80% | 0.69%(+4.10)#4 | 0.17%(+4.63)#44 |
| 5. | Orchard Lake Village | 4.70% | 0.69%(+4.00)#5 | 0.17%(+4.53)#45 |
| 6. | Wolverine | 3.90% | 0.69%(+3.21)#6 | 0.17%(+3.74)#60 |
| 7. | Grosse Pointe Woods | 3.09% | 0.69%(+2.40)#7 | 0.17%(+2.93)#97 |
| 8. | Woodland Beach | 2.81% | 0.69%(+2.12)#8 | 0.17%(+2.64)#111 |
| 9. | Algonac | 2.69% | 0.69%(+1.99)#9 | 0.17%(+2.52)#121 |
| 10. | Rochester | 2.67% | 0.69%(+1.98)#10 | 0.17%(+2.51)#123 |
| 11. | Byron | 2.65% | 0.69%(+1.96)#11 | 0.17%(+2.48)#126 |
| 12. | Alanson | 2.32% | 0.69%(+1.63)#12 | 0.17%(+2.16)#153 |
| 13. | Crystal Mountain | 2.31% | 0.69%(+1.61)#13 | 0.17%(+2.14)#158 |
| 14. | Lakeport | 2.13% | 0.69%(+1.44)#14 | 0.17%(+1.97)#177 |
| 15. | Caledonia | 1.94% | 0.69%(+1.24)#15 | 0.17%(+1.77)#213 |
| 16. | Franklin | 1.92% | 0.69%(+1.23)#16 | 0.17%(+1.76)#217 |
| 17. | Grosse Pointe Farms | 1.86% | 0.69%(+1.16)#17 | 0.17%(+1.69)#233 |
| 18. | Ferrysburg | 1.82% | 0.69%(+1.13)#18 | 0.17%(+1.66)#239 |
| 19. | Livonia | 1.79% | 0.69%(+1.09)#19 | 0.17%(+1.62)#248 |
| 20. | Crystal | 1.76% | 0.69%(+1.07)#20 | 0.17%(+1.60)#256 |
| 21. | Newaygo | 1.67% | 0.69%(+0.974)#21 | 0.17%(+1.50)#280 |
| 22. | Harper Woods | 1.57% | 0.69%(+0.875)#22 | 0.17%(+1.40)#307 |
| 23. | Grosse Pointe | 1.51% | 0.69%(+0.818)#23 | 0.17%(+1.35)#328 |
| 24. | Chassell | 1.50% | 0.69%(+0.804)#24 | 0.17%(+1.33)#338 |
| 25. | Lake Angelus | 1.39% | 0.69%(+0.700)#25 | 0.17%(+1.23)#371 |
| 26. | Farmington Hills | 1.39% | 0.69%(+0.695)#26 | 0.17%(+1.22)#375 |
| 27. | Walker | 1.39% | 0.69%(+0.692)#27 | 0.17%(+1.22)#378 |
| 28. | St Clair Shores | 1.38% | 0.69%(+0.682)#28 | 0.17%(+1.21)#384 |
| 29. | Northville | 1.36% | 0.69%(+0.669)#29 | 0.17%(+1.20)#388 |
| 30. | Cheboygan | 1.36% | 0.69%(+0.665)#30 | 0.17%(+1.19)#390 |
| 31. | Walloon Lake | 1.30% | 0.69%(+0.605)#31 | 0.17%(+1.13)#417 |
| 32. | Utica | 1.29% | 0.69%(+0.596)#32 | 0.17%(+1.12)#420 |
| 33. | Birmingham | 1.28% | 0.69%(+0.585)#33 | 0.17%(+1.11)#426 |
| 34. | Lincoln Park | 1.27% | 0.69%(+0.580)#34 | 0.17%(+1.11)#428 |
| 35. | Lakes Of The North | 1.26% | 0.69%(+0.567)#35 | 0.17%(+1.10)#433 |
| 36. | Berkley | 1.25% | 0.69%(+0.554)#36 | 0.17%(+1.08)#437 |
| 37. | Taylor | 1.24% | 0.69%(+0.544)#37 | 0.17%(+1.07)#444 |
| 38. | Houghton Lake | 1.23% | 0.69%(+0.538)#38 | 0.17%(+1.07)#446 |
| 39. | Inkster | 1.22% | 0.69%(+0.525)#39 | 0.17%(+1.05)#452 |
| 40. | Grosse Pointe Park | 1.20% | 0.69%(+0.505)#40 | 0.17%(+1.03)#463 |
| 41. | Riverview | 1.19% | 0.69%(+0.501)#41 | 0.17%(+1.03)#465 |
| 42. | Sterling Heights | 1.19% | 0.69%(+0.493)#42 | 0.17%(+1.02)#468 |
| 43. | Milford | 1.17% | 0.69%(+0.478)#43 | 0.17%(+1.01)#474 |
| 44. | Melvindale | 1.16% | 0.69%(+0.461)#44 | 0.17%(+0.990)#488 |
| 45. | Mount Clemens | 1.14% | 0.69%(+0.441)#45 | 0.17%(+0.970)#498 |
| 46. | Troy | 1.10% | 0.69%(+0.404)#46 | 0.17%(+0.933)#525 |
| 47. | East Grand Rapids | 1.08% | 0.69%(+0.386)#47 | 0.17%(+0.915)#531 |
| 48. | Dundee | 1.02% | 0.69%(+0.323)#48 | 0.17%(+0.852)#573 |
| 49. | Lake City | 1.00% | 0.69%(+0.303)#49 | 0.17%(+0.832)#588 |
| 50. | Clawson | 0.92% | 0.69%(+0.228)#50 | 0.17%(+0.757)#647 |
| 51. | Parma | 0.90% | 0.69%(+0.211)#51 | 0.17%(+0.740)#665 |
| 52. | Port Sanilac | 0.88% | 0.69%(+0.190)#52 | 0.17%(+0.719)#692 |
| 53. | Royal Oak | 0.87% | 0.69%(+0.179)#53 | 0.17%(+0.708)#701 |
| 54. | Bloomfield Hills | 0.86% | 0.69%(+0.169)#54 | 0.17%(+0.698)#711 |
| 55. | Romeo | 0.83% | 0.69%(+0.138)#55 | 0.17%(+0.667)#740 |
| 56. | Rochester Hills | 0.83% | 0.69%(+0.137)#56 | 0.17%(+0.666)#742 |
| 57. | Leslie | 0.79% | 0.69%(+0.095)#57 | 0.17%(+0.624)#785 |
| 58. | Lennon | 0.78% | 0.69%(+0.087)#58 | 0.17%(+0.616)#802 |
| 59. | Pleasant Ridge | 0.77% | 0.69%(+0.073)#59 | 0.17%(+0.601)#824 |
| 60. | Novi | 0.76% | 0.69%(+0.062)#60 | 0.17%(+0.591)#837 |
| 61. | Waverly | 0.75% | 0.69%(+0.056)#61 | 0.17%(+0.585)#849 |
| 62. | Berrien Springs | 0.69% | 0.69%(-0.002)#62 | 0.17%(+0.527)#927 |
| 63. | Center Line | 0.68% | 0.69%(-0.011)#63 | 0.17%(+0.518)#946 |
| 64. | Houghton | 0.66% | 0.69%(-0.032)#64 | 0.17%(+0.497)#987 |
| 65. | Canadian Lakes | 0.66% | 0.69%(-0.035)#65 | 0.17%(+0.494)#994 |
| 66. | South Boardman | 0.65% | 0.69%(-0.041)#66 | 0.17%(+0.487)#1,003 |
| 67. | Walled Lake | 0.65% | 0.69%(-0.047)#67 | 0.17%(+0.482)#1,013 |
| 68. | Almont | 0.64% | 0.69%(-0.057)#68 | 0.17%(+0.472)#1,029 |
| 69. | Ortonville | 0.63% | 0.69%(-0.065)#69 | 0.17%(+0.464)#1,050 |
| 70. | Allen Park | 0.63% | 0.69%(-0.067)#70 | 0.17%(+0.462)#1,056 |
| 71. | Lexington | 0.60% | 0.69%(-0.092)#71 | 0.17%(+0.437)#1,091 |
| 72. | Garden | 0.59% | 0.69%(-0.102)#72 | 0.17%(+0.427)#1,110 |
| 73. | Haslett | 0.59% | 0.69%(-0.107)#73 | 0.17%(+0.422)#1,119 |
| 74. | Holly | 0.58% | 0.69%(-0.110)#74 | 0.17%(+0.418)#1,125 |
| 75. | Whitmore Lake | 0.58% | 0.69%(-0.112)#75 | 0.17%(+0.416)#1,129 |
| 76. | Huntington Woods | 0.58% | 0.69%(-0.113)#76 | 0.17%(+0.416)#1,130 |
| 77. | Warren | 0.58% | 0.69%(-0.115)#77 | 0.17%(+0.414)#1,132 |
| 78. | Sheridan | 0.58% | 0.69%(-0.117)#78 | 0.17%(+0.412)#1,140 |
| 79. | Lansing | 0.57% | 0.69%(-0.126)#79 | 0.17%(+0.403)#1,162 |
| 80. | Garden City | 0.55% | 0.69%(-0.143)#80 | 0.17%(+0.386)#1,202 |
| 81. | Harvey | 0.54% | 0.69%(-0.154)#81 | 0.17%(+0.375)#1,229 |
| 82. | Roseville | 0.52% | 0.69%(-0.169)#82 | 0.17%(+0.359)#1,253 |
| 83. | Brimley | 0.52% | 0.69%(-0.170)#83 | 0.17%(+0.358)#1,257 |
| 84. | Pearl Beach | 0.50% | 0.69%(-0.190)#84 | 0.17%(+0.339)#1,309 |
| 85. | Manitou Beach Devils Lake | 0.50% | 0.69%(-0.196)#85 | 0.17%(+0.333)#1,322 |
| 86. | Shepherd | 0.49% | 0.69%(-0.199)#86 | 0.17%(+0.330)#1,334 |
| 87. | Flushing | 0.49% | 0.69%(-0.203)#87 | 0.17%(+0.326)#1,348 |
| 88. | South Monroe | 0.48% | 0.69%(-0.213)#88 | 0.17%(+0.315)#1,382 |
| 89. | Hillsdale | 0.47% | 0.69%(-0.219)#89 | 0.17%(+0.310)#1,403 |
| 90. | Madison Heights | 0.47% | 0.69%(-0.221)#90 | 0.17%(+0.308)#1,407 |
| 91. | Lake Ann | 0.47% | 0.69%(-0.221)#91 | 0.17%(+0.308)#1,409 |
| 92. | Farmington | 0.46% | 0.69%(-0.233)#92 | 0.17%(+0.296)#1,446 |
| 93. | Barton Hills | 0.45% | 0.69%(-0.244)#93 | 0.17%(+0.285)#1,484 |
| 94. | Lambertville | 0.45% | 0.69%(-0.247)#94 | 0.17%(+0.282)#1,496 |
| 95. | Westland | 0.44% | 0.69%(-0.254)#95 | 0.17%(+0.275)#1,517 |
| 96. | Cedar Springs | 0.44% | 0.69%(-0.255)#96 | 0.17%(+0.274)#1,523 |
| 97. | Linden | 0.44% | 0.69%(-0.258)#97 | 0.17%(+0.271)#1,533 |
| 98. | Holt | 0.43% | 0.69%(-0.260)#98 | 0.17%(+0.268)#1,548 |
| 99. | Oxford | 0.43% | 0.69%(-0.264)#99 | 0.17%(+0.265)#1,559 |
| 100. | Kalamazoo | 0.42% | 0.69%(-0.271)#100 | 0.17%(+0.258)#1,587 |
Common Questions
What are the Top 10 Cities with the Highest Percentage of Lebanese Population in Michigan?
Top 10 Cities with the Highest Percentage of Lebanese Population in Michigan are:
#1
21.06%
#2
17.21%
#3
6.67%
#4
4.80%
#5
4.70%
#6
3.90%
#7
3.09%
#8
2.81%
#9
2.69%
#10
2.67%
What city has the Highest Percentage of Lebanese Population in Michigan?
Dearborn Heights has the Highest Percentage of Lebanese Population in Michigan with 21.06%.
What is the Percentage of Lebanese Population in the State of Michigan?
Percentage of Lebanese Population in Michigan is 0.69%.
What is the Percentage of Lebanese Population in the United States?
Percentage of Lebanese Population in the United States is 0.17%.