Cities with the Highest Percentage of Lebanese Population in Illinois
RELATED REPORTS & OPTIONS
Lebanese
Illinois
Compare Cities
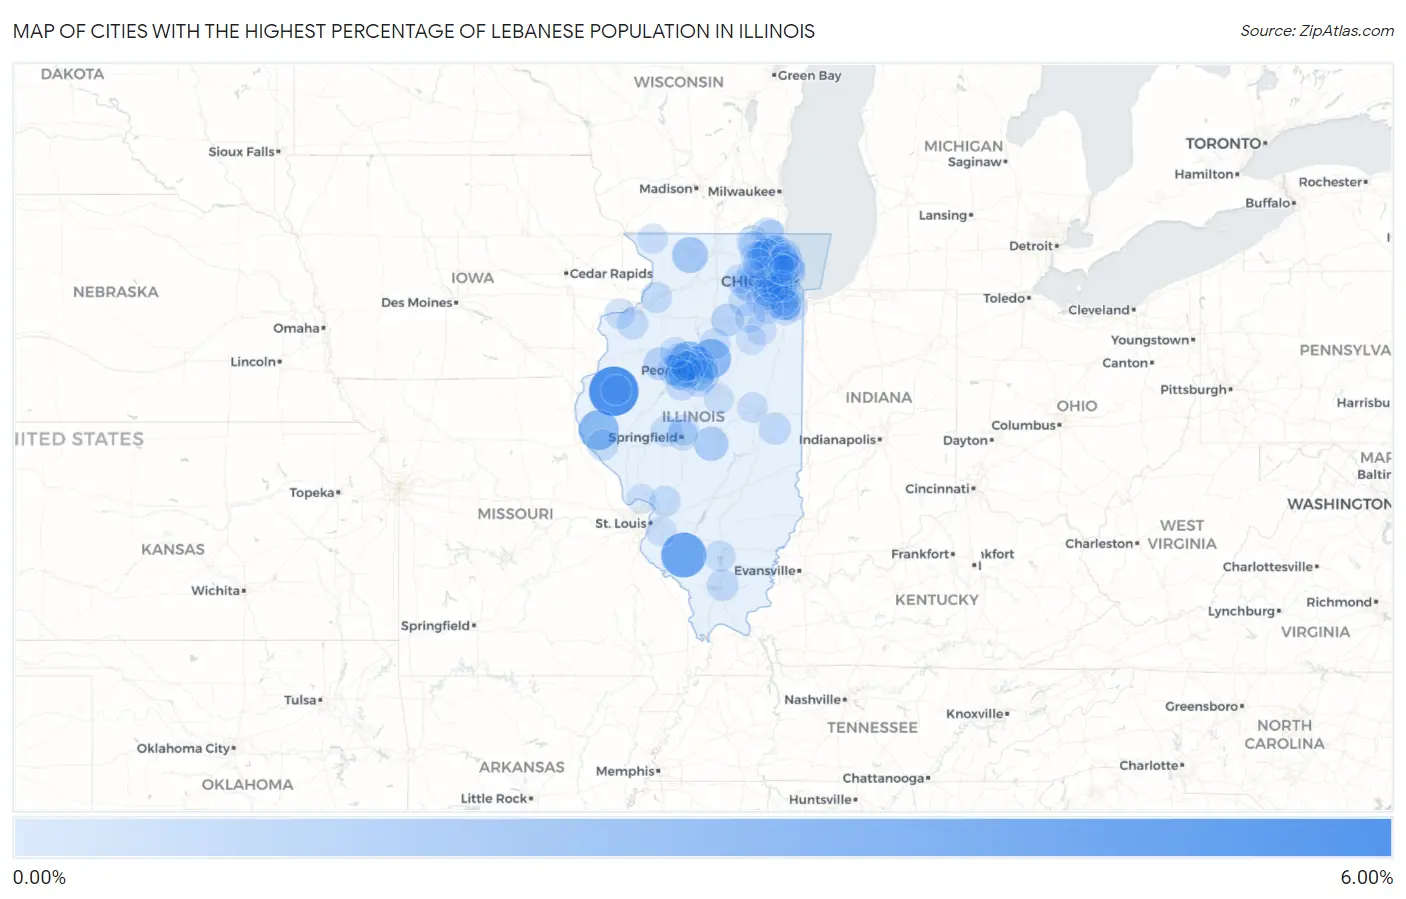
Map of Cities with the Highest Percentage of Lebanese Population in Illinois
0.00%
6.00%
Cities with the Highest Percentage of Lebanese Population in Illinois
| City | Lebanese | vs State | vs National | |
| 1. | Tennessee | 5.88% | 0.097%(+5.79)#1 | 0.17%(+5.72)#30 |
| 2. | Coulterville | 4.48% | 0.097%(+4.38)#2 | 0.17%(+4.31)#51 |
| 3. | Liberty | 2.99% | 0.097%(+2.90)#3 | 0.17%(+2.83)#99 |
| 4. | Bay View Gardens | 2.92% | 0.097%(+2.83)#4 | 0.17%(+2.76)#101 |
| 5. | Benson | 2.91% | 0.097%(+2.82)#5 | 0.17%(+2.75)#102 |
| 6. | German Valley | 1.81% | 0.097%(+1.71)#6 | 0.17%(+1.65)#241 |
| 7. | Orland Hills | 1.67% | 0.097%(+1.57)#7 | 0.17%(+1.50)#282 |
| 8. | Blue Mound | 1.39% | 0.097%(+1.29)#8 | 0.17%(+1.23)#372 |
| 9. | Hawthorn Woods | 1.31% | 0.097%(+1.21)#9 | 0.17%(+1.14)#410 |
| 10. | Bellevue | 1.30% | 0.097%(+1.21)#10 | 0.17%(+1.14)#413 |
| 11. | Metamora | 1.16% | 0.097%(+1.06)#11 | 0.17%(+0.991)#486 |
| 12. | Goodfield | 1.10% | 0.097%(+1.01)#12 | 0.17%(+0.939)#521 |
| 13. | Yates City | 0.99% | 0.097%(+0.893)#13 | 0.17%(+0.825)#591 |
| 14. | Peoria | 0.96% | 0.097%(+0.867)#14 | 0.17%(+0.799)#609 |
| 15. | Hinsdale | 0.96% | 0.097%(+0.858)#15 | 0.17%(+0.790)#618 |
| 16. | Ottawa | 0.88% | 0.097%(+0.780)#16 | 0.17%(+0.711)#699 |
| 17. | Lincolnwood | 0.78% | 0.097%(+0.687)#17 | 0.17%(+0.619)#796 |
| 18. | Elk Grove Village | 0.78% | 0.097%(+0.682)#18 | 0.17%(+0.613)#805 |
| 19. | Woodridge | 0.76% | 0.097%(+0.658)#19 | 0.17%(+0.590)#839 |
| 20. | Prestbury | 0.71% | 0.097%(+0.617)#20 | 0.17%(+0.549)#896 |
| 21. | Lake Catherine | 0.69% | 0.097%(+0.590)#21 | 0.17%(+0.521)#936 |
| 22. | Broadlands | 0.68% | 0.097%(+0.581)#22 | 0.17%(+0.513)#956 |
| 23. | Spillertown | 0.63% | 0.097%(+0.538)#23 | 0.17%(+0.470)#1,037 |
| 24. | Greenwood | 0.59% | 0.097%(+0.489)#24 | 0.17%(+0.421)#1,121 |
| 25. | Dunlap | 0.56% | 0.097%(+0.468)#25 | 0.17%(+0.399)#1,171 |
| 26. | Heritage Lake | 0.56% | 0.097%(+0.467)#26 | 0.17%(+0.399)#1,175 |
| 27. | Eureka | 0.56% | 0.097%(+0.466)#27 | 0.17%(+0.398)#1,178 |
| 28. | Pleasant Plains | 0.54% | 0.097%(+0.439)#28 | 0.17%(+0.370)#1,235 |
| 29. | Erie | 0.53% | 0.097%(+0.432)#29 | 0.17%(+0.363)#1,243 |
| 30. | Barry | 0.52% | 0.097%(+0.426)#30 | 0.17%(+0.357)#1,261 |
| 31. | Sherrard | 0.52% | 0.097%(+0.425)#31 | 0.17%(+0.357)#1,263 |
| 32. | Deer Creek | 0.51% | 0.097%(+0.415)#32 | 0.17%(+0.347)#1,291 |
| 33. | Mettawa | 0.50% | 0.097%(+0.402)#33 | 0.17%(+0.334)#1,318 |
| 34. | South Pekin | 0.50% | 0.097%(+0.402)#34 | 0.17%(+0.333)#1,320 |
| 35. | Wenona | 0.48% | 0.097%(+0.381)#35 | 0.17%(+0.312)#1,395 |
| 36. | Bloomingdale | 0.44% | 0.097%(+0.340)#36 | 0.17%(+0.272)#1,530 |
| 37. | Grandview | 0.43% | 0.097%(+0.334)#37 | 0.17%(+0.266)#1,556 |
| 38. | Holiday Shores | 0.43% | 0.097%(+0.329)#38 | 0.17%(+0.261)#1,574 |
| 39. | Riverside | 0.42% | 0.097%(+0.326)#39 | 0.17%(+0.258)#1,586 |
| 40. | East Peoria | 0.42% | 0.097%(+0.320)#40 | 0.17%(+0.252)#1,614 |
| 41. | Nason | 0.41% | 0.097%(+0.310)#41 | 0.17%(+0.241)#1,659 |
| 42. | Port Barrington | 0.39% | 0.097%(+0.288)#42 | 0.17%(+0.220)#1,734 |
| 43. | Westmont | 0.38% | 0.097%(+0.282)#43 | 0.17%(+0.214)#1,765 |
| 44. | Germantown Hills | 0.38% | 0.097%(+0.282)#44 | 0.17%(+0.214)#1,771 |
| 45. | Andalusia | 0.38% | 0.097%(+0.279)#45 | 0.17%(+0.210)#1,779 |
| 46. | Sherman | 0.36% | 0.097%(+0.267)#46 | 0.17%(+0.199)#1,830 |
| 47. | Lockport | 0.36% | 0.097%(+0.267)#47 | 0.17%(+0.199)#1,832 |
| 48. | Flossmoor | 0.36% | 0.097%(+0.265)#48 | 0.17%(+0.196)#1,842 |
| 49. | Hanna City | 0.35% | 0.097%(+0.256)#49 | 0.17%(+0.188)#1,883 |
| 50. | Kaneville | 0.35% | 0.097%(+0.253)#50 | 0.17%(+0.185)#1,902 |
| 51. | Lombard | 0.35% | 0.097%(+0.253)#51 | 0.17%(+0.184)#1,907 |
| 52. | Trout Valley | 0.34% | 0.097%(+0.240)#52 | 0.17%(+0.172)#1,958 |
| 53. | Warrenville | 0.34% | 0.097%(+0.240)#53 | 0.17%(+0.172)#1,961 |
| 54. | Marquette Heights | 0.34% | 0.097%(+0.240)#54 | 0.17%(+0.172)#1,963 |
| 55. | Bartonville | 0.34% | 0.097%(+0.239)#55 | 0.17%(+0.171)#1,968 |
| 56. | Antioch | 0.33% | 0.097%(+0.229)#56 | 0.17%(+0.161)#2,014 |
| 57. | Bull Valley | 0.32% | 0.097%(+0.224)#57 | 0.17%(+0.155)#2,049 |
| 58. | St Charles | 0.32% | 0.097%(+0.223)#58 | 0.17%(+0.155)#2,051 |
| 59. | Millbrook | 0.32% | 0.097%(+0.222)#59 | 0.17%(+0.153)#2,063 |
| 60. | Mahomet | 0.31% | 0.097%(+0.217)#60 | 0.17%(+0.149)#2,085 |
| 61. | Princeville | 0.31% | 0.097%(+0.210)#61 | 0.17%(+0.141)#2,129 |
| 62. | Highwood | 0.31% | 0.097%(+0.209)#62 | 0.17%(+0.141)#2,132 |
| 63. | Oak Lawn | 0.30% | 0.097%(+0.205)#63 | 0.17%(+0.137)#2,164 |
| 64. | Apple Canyon Lake | 0.28% | 0.097%(+0.187)#64 | 0.17%(+0.119)#2,268 |
| 65. | Fox River Grove | 0.28% | 0.097%(+0.186)#65 | 0.17%(+0.117)#2,274 |
| 66. | Braceville | 0.27% | 0.097%(+0.176)#66 | 0.17%(+0.108)#2,335 |
| 67. | Wilmette | 0.27% | 0.097%(+0.169)#67 | 0.17%(+0.101)#2,369 |
| 68. | Plainfield | 0.26% | 0.097%(+0.161)#68 | 0.17%(+0.093)#2,432 |
| 69. | Wheeling | 0.26% | 0.097%(+0.161)#69 | 0.17%(+0.092)#2,436 |
| 70. | Tinley Park | 0.25% | 0.097%(+0.153)#70 | 0.17%(+0.085)#2,485 |
| 71. | Morris | 0.23% | 0.097%(+0.138)#71 | 0.17%(+0.069)#2,606 |
| 72. | Tower Lakes | 0.23% | 0.097%(+0.137)#72 | 0.17%(+0.069)#2,613 |
| 73. | Naperville | 0.23% | 0.097%(+0.134)#73 | 0.17%(+0.066)#2,645 |
| 74. | Frankfort | 0.22% | 0.097%(+0.125)#74 | 0.17%(+0.057)#2,717 |
| 75. | Peoria Heights | 0.22% | 0.097%(+0.124)#75 | 0.17%(+0.056)#2,732 |
| 76. | Heyworth | 0.22% | 0.097%(+0.123)#76 | 0.17%(+0.055)#2,738 |
| 77. | Clarendon Hills | 0.22% | 0.097%(+0.123)#77 | 0.17%(+0.054)#2,749 |
| 78. | Libertyville | 0.22% | 0.097%(+0.122)#78 | 0.17%(+0.054)#2,754 |
| 79. | Bolingbrook | 0.22% | 0.097%(+0.121)#79 | 0.17%(+0.053)#2,759 |
| 80. | Highland Park | 0.21% | 0.097%(+0.112)#80 | 0.17%(+0.043)#2,848 |
| 81. | Skokie | 0.20% | 0.097%(+0.104)#81 | 0.17%(+0.036)#2,903 |
| 82. | Belleville | 0.20% | 0.097%(+0.100)#82 | 0.17%(+0.032)#2,957 |
| 83. | Downers Grove | 0.19% | 0.097%(+0.097)#83 | 0.17%(+0.029)#2,984 |
| 84. | Wheaton | 0.19% | 0.097%(+0.097)#84 | 0.17%(+0.029)#2,988 |
| 85. | Northbrook | 0.19% | 0.097%(+0.089)#85 | 0.17%(+0.021)#3,064 |
| 86. | Bartlett | 0.18% | 0.097%(+0.087)#86 | 0.17%(+0.019)#3,083 |
| 87. | Maple Park | 0.18% | 0.097%(+0.087)#87 | 0.17%(+0.018)#3,084 |
| 88. | Golf | 0.18% | 0.097%(+0.086)#88 | 0.17%(+0.018)#3,089 |
| 89. | Colchester | 0.18% | 0.097%(+0.082)#89 | 0.17%(+0.013)#3,149 |
| 90. | Orland Park | 0.17% | 0.097%(+0.076)#90 | 0.17%(+0.008)#3,193 |
| 91. | Lake In The Hills | 0.17% | 0.097%(+0.076)#91 | 0.17%(+0.008)#3,200 |
| 92. | Deerfield | 0.17% | 0.097%(+0.075)#92 | 0.17%(+0.007)#3,208 |
| 93. | Campton Hills | 0.17% | 0.097%(+0.074)#93 | 0.17%(+0.005)#3,226 |
| 94. | La Grange | 0.17% | 0.097%(+0.070)#94 | 0.17%(+0.002)#3,257 |
| 95. | Des Plaines | 0.17% | 0.097%(+0.070)#95 | 0.17%(+0.001)#3,263 |
| 96. | West Dundee | 0.17% | 0.097%(+0.069)#96 | 0.17%(+0.001)#3,273 |
| 97. | Rockdale | 0.16% | 0.097%(+0.067)#97 | 0.17%(-0.002)#3,299 |
| 98. | Park Ridge | 0.16% | 0.097%(+0.063)#98 | 0.17%(-0.005)#3,333 |
| 99. | Elsah | 0.16% | 0.097%(+0.062)#99 | 0.17%(-0.006)#3,345 |
| 100. | Dwight | 0.16% | 0.097%(+0.060)#100 | 0.17%(-0.008)#3,363 |
Common Questions
What are the Top 10 Cities with the Highest Percentage of Lebanese Population in Illinois?
Top 10 Cities with the Highest Percentage of Lebanese Population in Illinois are:
#1
5.88%
#2
4.48%
#3
2.99%
#4
2.92%
#5
2.91%
#6
1.81%
#7
1.67%
#8
1.39%
#9
1.31%
#10
1.30%
What city has the Highest Percentage of Lebanese Population in Illinois?
Tennessee has the Highest Percentage of Lebanese Population in Illinois with 5.88%.
What is the Percentage of Lebanese Population in the State of Illinois?
Percentage of Lebanese Population in Illinois is 0.097%.
What is the Percentage of Lebanese Population in the United States?
Percentage of Lebanese Population in the United States is 0.17%.