Cities with the Highest Percentage of Lebanese Population in Kentucky
RELATED REPORTS & OPTIONS
Lebanese
Kentucky
Compare Cities
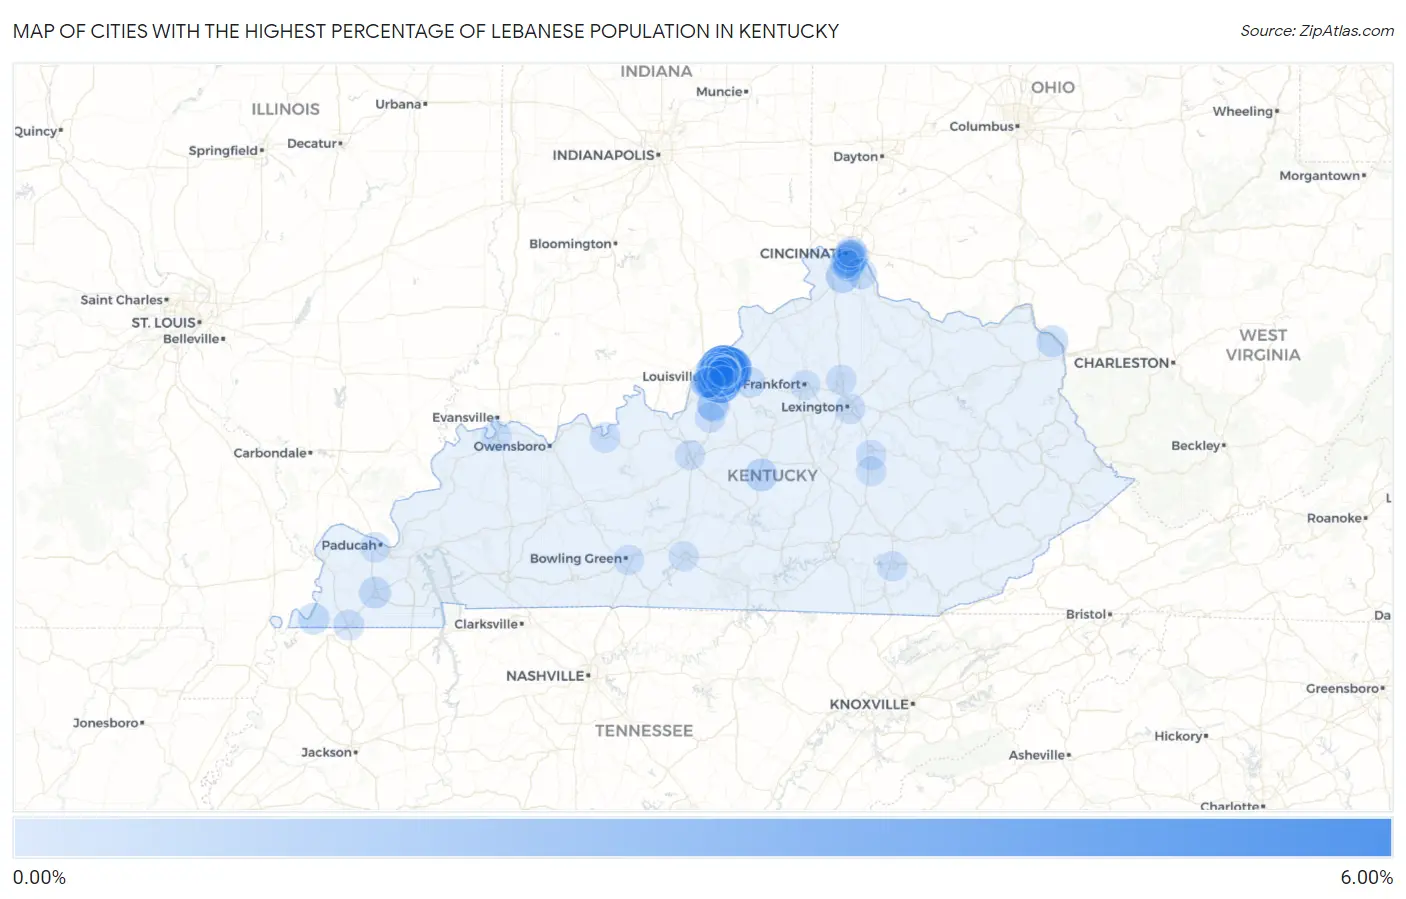
Map of Cities with the Highest Percentage of Lebanese Population in Kentucky
0.00%
6.00%
Cities with the Highest Percentage of Lebanese Population in Kentucky
| City | Lebanese | vs State | vs National | |
| 1. | Broeck Pointe | 5.54% | 0.077%(+5.46)#1 | 0.17%(+5.37)#35 |
| 2. | Lincolnshire | 3.81% | 0.077%(+3.73)#2 | 0.17%(+3.64)#65 |
| 3. | Worthington Hills | 3.72% | 0.077%(+3.64)#3 | 0.17%(+3.56)#70 |
| 4. | Riverwood | 2.40% | 0.077%(+2.32)#4 | 0.17%(+2.23)#147 |
| 5. | St Regis Park | 1.38% | 0.077%(+1.30)#5 | 0.17%(+1.21)#383 |
| 6. | Strathmoor Village | 1.33% | 0.077%(+1.26)#6 | 0.17%(+1.17)#400 |
| 7. | Indian Hills | 1.21% | 0.077%(+1.13)#7 | 0.17%(+1.05)#456 |
| 8. | Blue Ridge Manor | 1.17% | 0.077%(+1.09)#8 | 0.17%(+1.01)#475 |
| 9. | Richlawn | 1.11% | 0.077%(+1.03)#9 | 0.17%(+0.943)#517 |
| 10. | Brownsboro Farm | 1.08% | 0.077%(+1.01)#10 | 0.17%(+0.920)#528 |
| 11. | St Matthews | 1.06% | 0.077%(+0.985)#11 | 0.17%(+0.897)#541 |
| 12. | Southgate | 1.03% | 0.077%(+0.957)#12 | 0.17%(+0.868)#557 |
| 13. | Woodlawn Park | 1.03% | 0.077%(+0.954)#13 | 0.17%(+0.866)#558 |
| 14. | Norwood | 1.03% | 0.077%(+0.951)#14 | 0.17%(+0.863)#561 |
| 15. | Moorland | 0.98% | 0.077%(+0.904)#15 | 0.17%(+0.815)#597 |
| 16. | Rolling Fields | 0.97% | 0.077%(+0.892)#16 | 0.17%(+0.804)#604 |
| 17. | Brownsboro Village | 0.92% | 0.077%(+0.843)#17 | 0.17%(+0.755)#648 |
| 18. | Wilder | 0.92% | 0.077%(+0.843)#18 | 0.17%(+0.755)#649 |
| 19. | Independence | 0.89% | 0.077%(+0.811)#19 | 0.17%(+0.723)#687 |
| 20. | Fort Thomas | 0.75% | 0.077%(+0.668)#20 | 0.17%(+0.580)#853 |
| 21. | Lebanon | 0.73% | 0.077%(+0.656)#21 | 0.17%(+0.568)#867 |
| 22. | Wellington | 0.68% | 0.077%(+0.600)#22 | 0.17%(+0.512)#959 |
| 23. | Meadowview Estates | 0.67% | 0.077%(+0.594)#23 | 0.17%(+0.506)#973 |
| 24. | Coldstream | 0.58% | 0.077%(+0.505)#24 | 0.17%(+0.417)#1,128 |
| 25. | Glenview | 0.52% | 0.077%(+0.446)#25 | 0.17%(+0.358)#1,259 |
| 26. | Barbourmeade | 0.49% | 0.077%(+0.418)#26 | 0.17%(+0.329)#1,335 |
| 27. | Bellefonte | 0.49% | 0.077%(+0.417)#27 | 0.17%(+0.328)#1,339 |
| 28. | Mayfield | 0.47% | 0.077%(+0.393)#28 | 0.17%(+0.304)#1,416 |
| 29. | Spring Valley | 0.47% | 0.077%(+0.389)#29 | 0.17%(+0.301)#1,435 |
| 30. | Hebron Estates | 0.46% | 0.077%(+0.382)#30 | 0.17%(+0.294)#1,454 |
| 31. | Prospect | 0.45% | 0.077%(+0.377)#31 | 0.17%(+0.289)#1,471 |
| 32. | Taylor Mill | 0.42% | 0.077%(+0.346)#32 | 0.17%(+0.258)#1,584 |
| 33. | Jeffersontown | 0.40% | 0.077%(+0.322)#33 | 0.17%(+0.234)#1,680 |
| 34. | Hickman | 0.37% | 0.077%(+0.295)#34 | 0.17%(+0.206)#1,795 |
| 35. | Audubon Park | 0.35% | 0.077%(+0.277)#35 | 0.17%(+0.189)#1,876 |
| 36. | Parkway Village | 0.32% | 0.077%(+0.245)#36 | 0.17%(+0.156)#2,042 |
| 37. | Alexandria | 0.29% | 0.077%(+0.214)#37 | 0.17%(+0.125)#2,230 |
| 38. | Creekside | 0.27% | 0.077%(+0.198)#38 | 0.17%(+0.110)#2,322 |
| 39. | Northfield | 0.27% | 0.077%(+0.194)#39 | 0.17%(+0.106)#2,344 |
| 40. | Hillview | 0.25% | 0.077%(+0.177)#40 | 0.17%(+0.088)#2,462 |
| 41. | Simpsonville | 0.24% | 0.077%(+0.158)#41 | 0.17%(+0.070)#2,601 |
| 42. | Fulton | 0.22% | 0.077%(+0.146)#42 | 0.17%(+0.058)#2,703 |
| 43. | Meadow Vale | 0.22% | 0.077%(+0.140)#43 | 0.17%(+0.052)#2,773 |
| 44. | Langdon Place | 0.21% | 0.077%(+0.137)#44 | 0.17%(+0.049)#2,795 |
| 45. | Rolling Hills | 0.20% | 0.077%(+0.123)#45 | 0.17%(+0.035)#2,921 |
| 46. | Cloverport | 0.17% | 0.077%(+0.092)#46 | 0.17%(+0.004)#3,244 |
| 47. | Lexington | 0.16% | 0.077%(+0.087)#47 | 0.17%(-0.001)#3,287 |
| 48. | Beechwood Village | 0.15% | 0.077%(+0.077)#48 | 0.17%(-0.012)#3,402 |
| 49. | Henderson | 0.15% | 0.077%(+0.076)#49 | 0.17%(-0.012)#3,413 |
| 50. | Hurstbourne Acres | 0.15% | 0.077%(+0.073)#50 | 0.17%(-0.015)#3,441 |
| 51. | Newport | 0.11% | 0.077%(+0.036)#51 | 0.17%(-0.052)#3,833 |
| 52. | Louisville | 0.10% | 0.077%(+0.028)#52 | 0.17%(-0.060)#3,932 |
| 53. | Corbin | 0.10% | 0.077%(+0.028)#53 | 0.17%(-0.061)#3,935 |
| 54. | Georgetown | 0.10% | 0.077%(+0.024)#54 | 0.17%(-0.064)#3,972 |
| 55. | Richmond | 0.095% | 0.077%(+0.018)#55 | 0.17%(-0.071)#4,068 |
| 56. | Shepherdsville | 0.092% | 0.077%(+0.015)#56 | 0.17%(-0.073)#4,087 |
| 57. | Elizabethtown | 0.089% | 0.077%(+0.012)#57 | 0.17%(-0.076)#4,110 |
| 58. | Bowling Green | 0.086% | 0.077%(+0.009)#58 | 0.17%(-0.079)#4,154 |
| 59. | Paducah | 0.086% | 0.077%(+0.009)#59 | 0.17%(-0.080)#4,156 |
| 60. | Covington | 0.081% | 0.077%(+0.004)#60 | 0.17%(-0.085)#4,239 |
| 61. | Dayton | 0.070% | 0.077%(-0.006)#61 | 0.17%(-0.095)#4,348 |
| 62. | Glasgow | 0.060% | 0.077%(-0.017)#62 | 0.17%(-0.105)#4,505 |
| 63. | Frankfort | 0.039% | 0.077%(-0.038)#63 | 0.17%(-0.126)#4,787 |
| 64. | Berea | 0.032% | 0.077%(-0.044)#64 | 0.17%(-0.133)#4,859 |
Common Questions
What are the Top 10 Cities with the Highest Percentage of Lebanese Population in Kentucky?
Top 10 Cities with the Highest Percentage of Lebanese Population in Kentucky are:
#1
5.54%
#2
3.81%
#3
3.72%
#4
2.40%
#5
1.38%
#6
1.33%
#7
1.21%
#8
1.17%
#9
1.11%
#10
1.08%
What city has the Highest Percentage of Lebanese Population in Kentucky?
Broeck Pointe has the Highest Percentage of Lebanese Population in Kentucky with 5.54%.
What is the Percentage of Lebanese Population in the State of Kentucky?
Percentage of Lebanese Population in Kentucky is 0.077%.
What is the Percentage of Lebanese Population in the United States?
Percentage of Lebanese Population in the United States is 0.17%.