Cities with the Highest Percentage of Lebanese Population in Maryland
RELATED REPORTS & OPTIONS
Lebanese
Maryland
Compare Cities
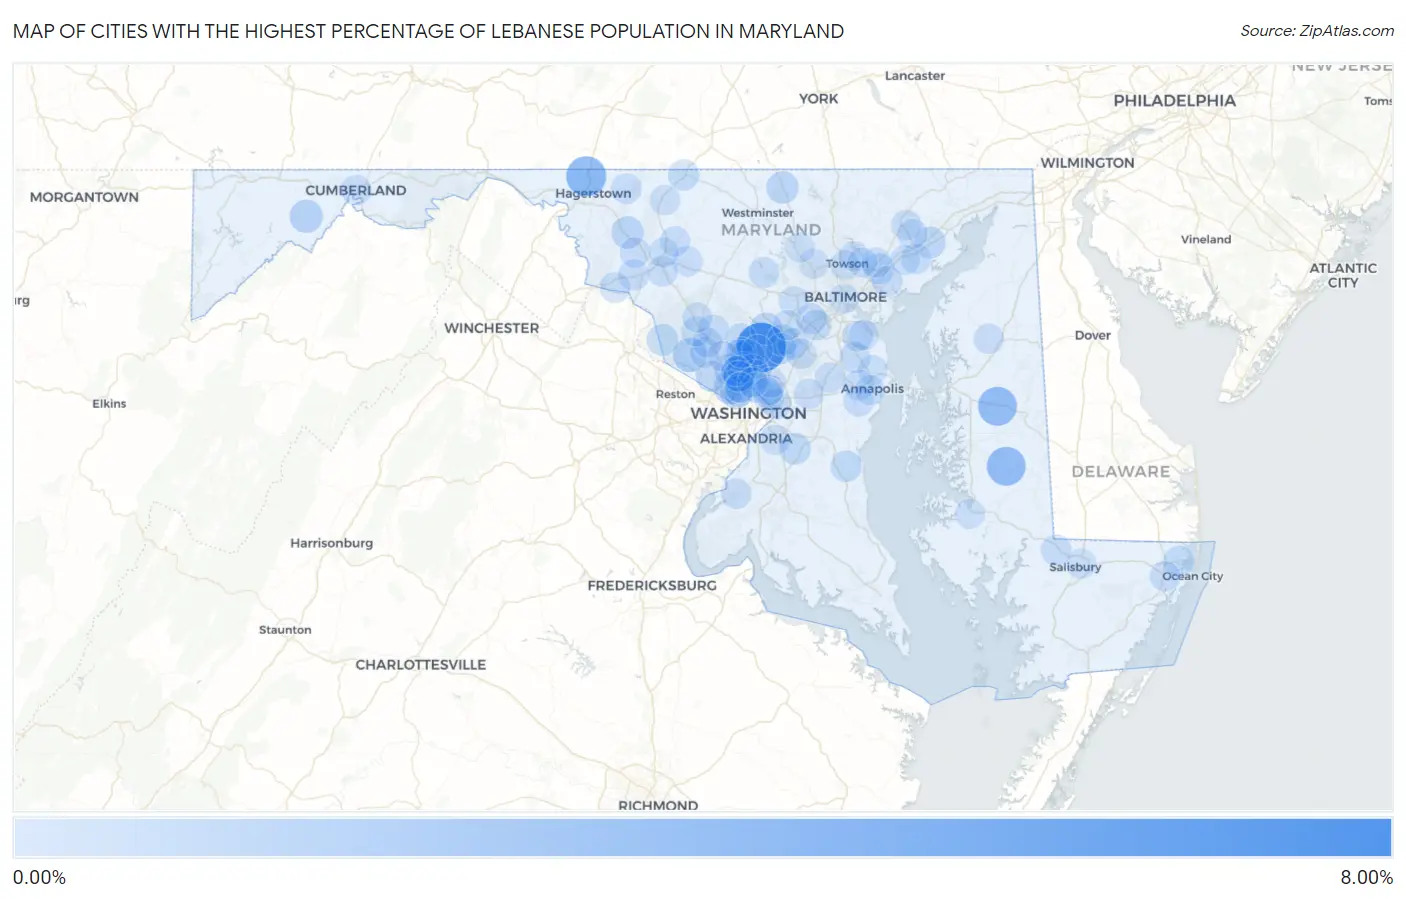
Map of Cities with the Highest Percentage of Lebanese Population in Maryland
0.00%
8.00%
Cities with the Highest Percentage of Lebanese Population in Maryland
| City | Lebanese | vs State | vs National | |
| 1. | Spencerville | 7.52% | 0.12%(+7.40)#1 | 0.17%(+7.35)#16 |
| 2. | Maugansville | 3.79% | 0.12%(+3.67)#2 | 0.17%(+3.63)#67 |
| 3. | Hillsboro | 3.36% | 0.12%(+3.24)#3 | 0.17%(+3.19)#86 |
| 4. | Preston | 3.31% | 0.12%(+3.19)#4 | 0.17%(+3.14)#88 |
| 5. | Kensington | 2.59% | 0.12%(+2.47)#5 | 0.17%(+2.42)#128 |
| 6. | Darnestown | 1.60% | 0.12%(+1.48)#6 | 0.17%(+1.44)#299 |
| 7. | Layhill | 1.47% | 0.12%(+1.35)#7 | 0.17%(+1.31)#342 |
| 8. | Lonaconing | 1.21% | 0.12%(+1.09)#8 | 0.17%(+1.05)#453 |
| 9. | Bethesda | 1.17% | 0.12%(+1.05)#9 | 0.17%(+1.01)#473 |
| 10. | Manchester | 0.91% | 0.12%(+0.786)#10 | 0.17%(+0.742)#664 |
| 11. | Wildewood | 0.89% | 0.12%(+0.767)#11 | 0.17%(+0.722)#688 |
| 12. | Myersville | 0.88% | 0.12%(+0.762)#12 | 0.17%(+0.717)#693 |
| 13. | Highland | 0.86% | 0.12%(+0.742)#13 | 0.17%(+0.698)#712 |
| 14. | Friendship Heights Village | 0.86% | 0.12%(+0.737)#14 | 0.17%(+0.692)#718 |
| 15. | Riverside | 0.69% | 0.12%(+0.572)#15 | 0.17%(+0.527)#928 |
| 16. | Poolesville | 0.69% | 0.12%(+0.565)#16 | 0.17%(+0.521)#937 |
| 17. | North Kensington | 0.67% | 0.12%(+0.552)#17 | 0.17%(+0.508)#968 |
| 18. | North Bethesda | 0.67% | 0.12%(+0.547)#18 | 0.17%(+0.502)#977 |
| 19. | Rosaryville | 0.62% | 0.12%(+0.495)#19 | 0.17%(+0.450)#1,071 |
| 20. | South Kensington | 0.60% | 0.12%(+0.477)#20 | 0.17%(+0.432)#1,095 |
| 21. | Scaggsville | 0.56% | 0.12%(+0.435)#21 | 0.17%(+0.391)#1,190 |
| 22. | Owings | 0.55% | 0.12%(+0.427)#22 | 0.17%(+0.382)#1,214 |
| 23. | North Laurel | 0.48% | 0.12%(+0.359)#23 | 0.17%(+0.314)#1,386 |
| 24. | Olney | 0.46% | 0.12%(+0.338)#24 | 0.17%(+0.294)#1,453 |
| 25. | White Marsh | 0.44% | 0.12%(+0.315)#25 | 0.17%(+0.270)#1,537 |
| 26. | Ocean Pines | 0.43% | 0.12%(+0.310)#26 | 0.17%(+0.265)#1,558 |
| 27. | Emmitsburg | 0.43% | 0.12%(+0.305)#27 | 0.17%(+0.261)#1,577 |
| 28. | Severna Park | 0.41% | 0.12%(+0.285)#28 | 0.17%(+0.240)#1,661 |
| 29. | Martin S Additions | 0.40% | 0.12%(+0.282)#29 | 0.17%(+0.238)#1,667 |
| 30. | Ilchester | 0.37% | 0.12%(+0.249)#30 | 0.17%(+0.205)#1,801 |
| 31. | Jefferson | 0.36% | 0.12%(+0.244)#31 | 0.17%(+0.200)#1,828 |
| 32. | Hebron | 0.35% | 0.12%(+0.234)#32 | 0.17%(+0.190)#1,873 |
| 33. | Sykesville | 0.35% | 0.12%(+0.228)#33 | 0.17%(+0.183)#1,914 |
| 34. | Kemp Mill | 0.33% | 0.12%(+0.213)#34 | 0.17%(+0.168)#1,982 |
| 35. | Elkridge | 0.33% | 0.12%(+0.208)#35 | 0.17%(+0.164)#2,002 |
| 36. | Parole | 0.32% | 0.12%(+0.203)#36 | 0.17%(+0.159)#2,025 |
| 37. | West Laurel | 0.32% | 0.12%(+0.203)#37 | 0.17%(+0.158)#2,029 |
| 38. | Brunswick | 0.32% | 0.12%(+0.201)#38 | 0.17%(+0.156)#2,045 |
| 39. | Chevy Chase Village | 0.32% | 0.12%(+0.198)#39 | 0.17%(+0.153)#2,064 |
| 40. | Wheaton | 0.31% | 0.12%(+0.188)#40 | 0.17%(+0.144)#2,118 |
| 41. | Green Valley | 0.31% | 0.12%(+0.188)#41 | 0.17%(+0.143)#2,122 |
| 42. | Potomac | 0.30% | 0.12%(+0.176)#42 | 0.17%(+0.132)#2,203 |
| 43. | North Brentwood | 0.26% | 0.12%(+0.141)#43 | 0.17%(+0.096)#2,412 |
| 44. | North Potomac | 0.26% | 0.12%(+0.139)#44 | 0.17%(+0.094)#2,423 |
| 45. | Montgomery Village | 0.25% | 0.12%(+0.133)#45 | 0.17%(+0.088)#2,464 |
| 46. | Middletown | 0.24% | 0.12%(+0.120)#46 | 0.17%(+0.076)#2,556 |
| 47. | Linganore | 0.24% | 0.12%(+0.115)#47 | 0.17%(+0.071)#2,595 |
| 48. | Maryland City | 0.23% | 0.12%(+0.114)#48 | 0.17%(+0.069)#2,609 |
| 49. | Smithsburg | 0.23% | 0.12%(+0.111)#49 | 0.17%(+0.066)#2,638 |
| 50. | Edgewood | 0.23% | 0.12%(+0.106)#50 | 0.17%(+0.062)#2,666 |
| 51. | Aspen Hill | 0.23% | 0.12%(+0.106)#51 | 0.17%(+0.062)#2,668 |
| 52. | Crofton | 0.22% | 0.12%(+0.104)#52 | 0.17%(+0.060)#2,686 |
| 53. | Edgewater | 0.22% | 0.12%(+0.103)#53 | 0.17%(+0.059)#2,691 |
| 54. | Fairwood | 0.22% | 0.12%(+0.102)#54 | 0.17%(+0.057)#2,716 |
| 55. | Pasadena | 0.22% | 0.12%(+0.100)#55 | 0.17%(+0.056)#2,730 |
| 56. | Ballenger Creek | 0.20% | 0.12%(+0.081)#56 | 0.17%(+0.036)#2,901 |
| 57. | Cumberland | 0.20% | 0.12%(+0.079)#57 | 0.17%(+0.034)#2,923 |
| 58. | Four Corners | 0.19% | 0.12%(+0.073)#58 | 0.17%(+0.028)#3,000 |
| 59. | Middle River | 0.19% | 0.12%(+0.072)#59 | 0.17%(+0.027)#3,006 |
| 60. | Bryans Road | 0.19% | 0.12%(+0.066)#60 | 0.17%(+0.021)#3,057 |
| 61. | Church Hill | 0.18% | 0.12%(+0.064)#61 | 0.17%(+0.019)#3,078 |
| 62. | Rockville | 0.18% | 0.12%(+0.061)#62 | 0.17%(+0.017)#3,104 |
| 63. | Bel Air | 0.18% | 0.12%(+0.058)#63 | 0.17%(+0.014)#3,147 |
| 64. | Chevy Chase View | 0.18% | 0.12%(+0.058)#64 | 0.17%(+0.013)#3,153 |
| 65. | Takoma Park | 0.18% | 0.12%(+0.056)#65 | 0.17%(+0.012)#3,166 |
| 66. | Riviera Beach | 0.17% | 0.12%(+0.053)#66 | 0.17%(+0.008)#3,191 |
| 67. | Germantown | 0.16% | 0.12%(+0.043)#67 | 0.17%(-0.001)#3,292 |
| 68. | Cheverly | 0.16% | 0.12%(+0.043)#68 | 0.17%(-0.002)#3,303 |
| 69. | Berlin | 0.16% | 0.12%(+0.038)#69 | 0.17%(-0.007)#3,352 |
| 70. | Leisure World | 0.16% | 0.12%(+0.035)#70 | 0.17%(-0.009)#3,374 |
| 71. | University Park | 0.15% | 0.12%(+0.033)#71 | 0.17%(-0.012)#3,407 |
| 72. | Cloverly | 0.15% | 0.12%(+0.032)#72 | 0.17%(-0.013)#3,422 |
| 73. | Walkersville | 0.14% | 0.12%(+0.024)#73 | 0.17%(-0.021)#3,503 |
| 74. | Garrison | 0.14% | 0.12%(+0.023)#74 | 0.17%(-0.022)#3,512 |
| 75. | Salisbury | 0.14% | 0.12%(+0.022)#75 | 0.17%(-0.023)#3,523 |
| 76. | Towson | 0.14% | 0.12%(+0.020)#76 | 0.17%(-0.025)#3,542 |
| 77. | Hampton | 0.14% | 0.12%(+0.017)#77 | 0.17%(-0.027)#3,564 |
| 78. | Flower Hill | 0.14% | 0.12%(+0.016)#78 | 0.17%(-0.028)#3,582 |
| 79. | Honeygo | 0.13% | 0.12%(+0.012)#79 | 0.17%(-0.032)#3,625 |
| 80. | College Park | 0.13% | 0.12%(+0.010)#80 | 0.17%(-0.034)#3,653 |
| 81. | Thurmont | 0.13% | 0.12%(+0.006)#81 | 0.17%(-0.038)#3,689 |
| 82. | Garrett Park | 0.12% | 0.12%(+0.002)#82 | 0.17%(-0.043)#3,732 |
| 83. | Cambridge | 0.12% | 0.12%(+0.002)#83 | 0.17%(-0.043)#3,734 |
| 84. | Silver Spring | 0.12% | 0.12%(-0.001)#84 | 0.17%(-0.045)#3,759 |
| 85. | Ellicott City | 0.12% | 0.12%(-0.004)#85 | 0.17%(-0.048)#3,789 |
| 86. | Arnold | 0.12% | 0.12%(-0.004)#86 | 0.17%(-0.048)#3,791 |
| 87. | Camp Springs | 0.12% | 0.12%(-0.005)#87 | 0.17%(-0.049)#3,795 |
| 88. | Gaithersburg | 0.12% | 0.12%(-0.005)#88 | 0.17%(-0.049)#3,796 |
| 89. | Clarksburg | 0.11% | 0.12%(-0.011)#89 | 0.17%(-0.056)#3,876 |
| 90. | Bel Air South | 0.11% | 0.12%(-0.016)#90 | 0.17%(-0.060)#3,928 |
| 91. | Reisterstown | 0.11% | 0.12%(-0.016)#91 | 0.17%(-0.060)#3,929 |
| 92. | Frederick | 0.10% | 0.12%(-0.017)#92 | 0.17%(-0.062)#3,953 |
| 93. | Perry Hall | 0.099% | 0.12%(-0.021)#93 | 0.17%(-0.066)#3,999 |
| 94. | Chevy Chase Section Three | 0.097% | 0.12%(-0.023)#94 | 0.17%(-0.068)#4,022 |
| 95. | Hyattsville | 0.096% | 0.12%(-0.025)#95 | 0.17%(-0.069)#4,044 |
| 96. | Annapolis | 0.096% | 0.12%(-0.025)#96 | 0.17%(-0.069)#4,048 |
| 97. | Columbia | 0.087% | 0.12%(-0.033)#97 | 0.17%(-0.078)#4,129 |
| 98. | Baltimore | 0.085% | 0.12%(-0.036)#98 | 0.17%(-0.080)#4,164 |
| 99. | Joppatowne | 0.082% | 0.12%(-0.038)#99 | 0.17%(-0.083)#4,209 |
| 100. | Carney | 0.082% | 0.12%(-0.039)#100 | 0.17%(-0.083)#4,221 |
Common Questions
What are the Top 10 Cities with the Highest Percentage of Lebanese Population in Maryland?
Top 10 Cities with the Highest Percentage of Lebanese Population in Maryland are:
#1
7.52%
#2
3.79%
#3
3.36%
#4
3.31%
#5
2.59%
#6
1.60%
#7
1.47%
#8
1.21%
#9
1.17%
#10
0.91%
What city has the Highest Percentage of Lebanese Population in Maryland?
Spencerville has the Highest Percentage of Lebanese Population in Maryland with 7.52%.
What is the Percentage of Lebanese Population in the State of Maryland?
Percentage of Lebanese Population in Maryland is 0.12%.
What is the Percentage of Lebanese Population in the United States?
Percentage of Lebanese Population in the United States is 0.17%.