Cities with the Highest Owner-Occupied Median Costs of Housing in South Carolina
RELATED REPORTS & OPTIONS
Highest Owner Housing Costs
South Carolina
Compare Cities
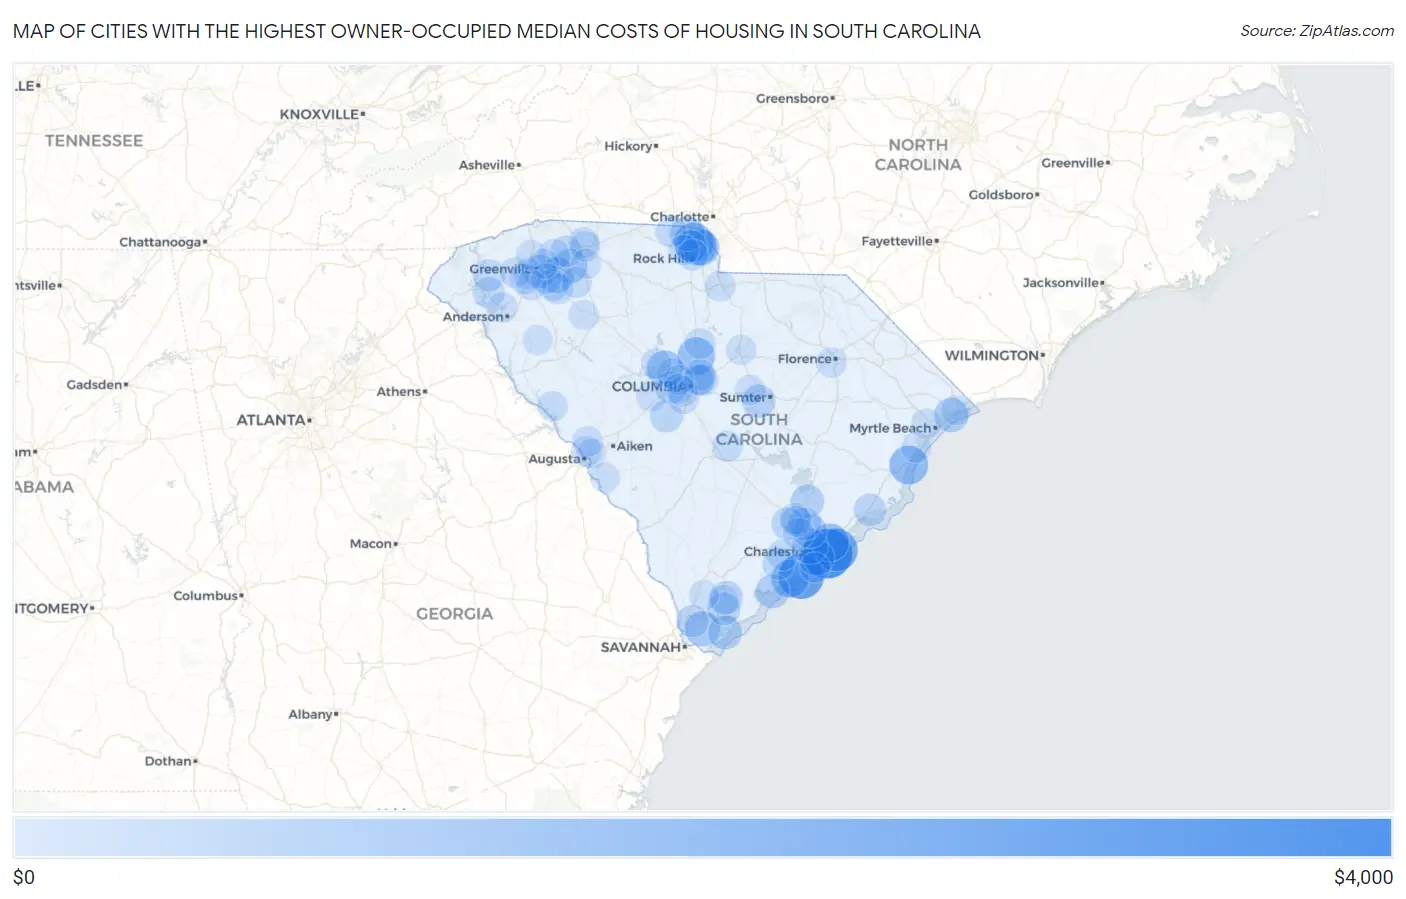
Map of Cities with the Highest Owner-Occupied Median Costs of Housing in South Carolina
$0
$4,000
Cities with the Highest Owner-Occupied Median Costs of Housing in South Carolina
| City | Housing Costs | vs State | vs National | |
| 1. | Sullivan S Island | $3,693 | $948(+2.75k)#1 | $1,282(+2.41k)#259 |
| 2. | Kiawah Island | $3,088 | $948(+2.14k)#2 | $1,282(+1.81k)#556 |
| 3. | Debordieu Colony | $2,750 | $948(+1.80k)#3 | $1,282(+1.47k)#869 |
| 4. | Isle Of Palms | $2,721 | $948(+1.77k)#4 | $1,282(+1.44k)#916 |
| 5. | Pimlico | $2,279 | $948(+1.33k)#5 | $1,282(+997)#1,782 |
| 6. | Tega Cay | $2,274 | $948(+1.33k)#6 | $1,282(+992)#1,794 |
| 7. | Daufuskie Island | $2,178 | $948(+1.23k)#7 | $1,282(+896)#2,049 |
| 8. | Pawleys Island | $2,150 | $948(+1.20k)#8 | $1,282(+868)#2,139 |
| 9. | Riverview | $2,077 | $948(+1.13k)#9 | $1,282(+795)#2,378 |
| 10. | Mount Pleasant | $2,033 | $948(+1.08k)#10 | $1,282(+751)#2,532 |
| 11. | Seabrook Island | $2,002 | $948(+1.05k)#11 | $1,282(+720)#2,666 |
| 12. | Blythewood | $1,999 | $948(+1.05k)#12 | $1,282(+717)#2,686 |
| 13. | Lake Murray Of Richland | $1,826 | $948(+878)#13 | $1,282(+544)#3,392 |
| 14. | James Island | $1,815 | $948(+867)#14 | $1,282(+533)#3,454 |
| 15. | Baxter | $1,787 | $948(+839)#15 | $1,282(+505)#3,626 |
| 16. | Fort Mill | $1,763 | $948(+815)#16 | $1,282(+481)#3,752 |
| 17. | Five Forks | $1,742 | $948(+794)#17 | $1,282(+460)#3,876 |
| 18. | Charleston | $1,714 | $948(+766)#18 | $1,282(+432)#4,018 |
| 19. | Bluffton | $1,686 | $948(+738)#19 | $1,282(+404)#4,174 |
| 20. | Lake Wylie | $1,618 | $948(+670)#20 | $1,282(+336)#4,620 |
| 21. | Reidville | $1,552 | $948(+604)#21 | $1,282(+270)#5,093 |
| 22. | Briarcliffe Acres | $1,550 | $948(+602)#22 | $1,282(+268)#5,110 |
| 23. | Hanahan | $1,498 | $948(+550)#23 | $1,282(+216)#5,543 |
| 24. | Edisto Beach | $1,496 | $948(+548)#24 | $1,282(+214)#5,566 |
| 25. | Hilton Head Island | $1,475 | $948(+527)#25 | $1,282(+193)#5,713 |
| 26. | Fripp Island | $1,470 | $948(+522)#26 | $1,282(+188)#5,761 |
| 27. | The Cliffs Valley | $1,404 | $948(+456)#27 | $1,282(+122)#6,268 |
| 28. | Moncks Corner | $1,403 | $948(+455)#28 | $1,282(+121)#6,276 |
| 29. | Cane Savannah | $1,400 | $948(+452)#29 | $1,282(+118)#6,317 |
| 30. | Greenville | $1,394 | $948(+446)#30 | $1,282(+112)#6,368 |
| 31. | Beaufort | $1,364 | $948(+416)#31 | $1,282(+82.0)#6,639 |
| 32. | White Knoll | $1,358 | $948(+410)#32 | $1,282(+76.0)#6,707 |
| 33. | Port Royal | $1,343 | $948(+395)#33 | $1,282(+61.0)#6,855 |
| 34. | Goose Creek | $1,309 | $948(+361)#34 | $1,282(+27.0)#7,246 |
| 35. | Summerville | $1,301 | $948(+353)#35 | $1,282(+19.0)#7,329 |
| 36. | Mcclellanville | $1,300 | $948(+352)#36 | $1,282(+18.0)#7,344 |
| 37. | Pelion | $1,277 | $948(+329)#37 | $1,282(-5.00)#7,603 |
| 38. | India Hook | $1,268 | $948(+320)#38 | $1,282(-14.0)#7,698 |
| 39. | Carolina Forest | $1,256 | $948(+308)#39 | $1,282(-26.0)#7,844 |
| 40. | Hardeeville | $1,254 | $948(+306)#40 | $1,282(-28.0)#7,861 |
| 41. | Meggett | $1,250 | $948(+302)#41 | $1,282(-32.0)#7,906 |
| 42. | Lexington | $1,237 | $948(+289)#42 | $1,282(-45.0)#8,044 |
| 43. | Six Mile | $1,209 | $948(+261)#43 | $1,282(-73.0)#8,365 |
| 44. | Greer | $1,192 | $948(+244)#44 | $1,282(-90.0)#8,579 |
| 45. | Clemson | $1,188 | $948(+240)#45 | $1,282(-94.0)#8,624 |
| 46. | Arcadia Lakes | $1,182 | $948(+234)#46 | $1,282(-100.0)#8,714 |
| 47. | Columbia | $1,173 | $948(+225)#47 | $1,282(-109)#8,807 |
| 48. | Litchfield Beach | $1,172 | $948(+224)#48 | $1,282(-110)#8,825 |
| 49. | Simpsonville | $1,168 | $948(+220)#49 | $1,282(-114)#8,868 |
| 50. | Lyman | $1,167 | $948(+219)#50 | $1,282(-115)#8,885 |
| 51. | North Charleston | $1,153 | $948(+205)#51 | $1,282(-129)#9,082 |
| 52. | Sangaree | $1,147 | $948(+199)#52 | $1,282(-135)#9,164 |
| 53. | Rock Hill | $1,130 | $948(+182)#53 | $1,282(-152)#9,399 |
| 54. | Irmo | $1,129 | $948(+181)#54 | $1,282(-153)#9,422 |
| 55. | Clover | $1,129 | $948(+181)#55 | $1,282(-153)#9,423 |
| 56. | Dentsville | $1,122 | $948(+174)#56 | $1,282(-160)#9,550 |
| 57. | Fountain Inn | $1,121 | $948(+173)#57 | $1,282(-161)#9,566 |
| 58. | Woodruff | $1,105 | $948(+157)#58 | $1,282(-177)#9,811 |
| 59. | Cameron | $1,105 | $948(+157)#59 | $1,282(-177)#9,825 |
| 60. | Caesars Head | $1,104 | $948(+156)#60 | $1,282(-178)#9,841 |
| 61. | Hollywood | $1,098 | $948(+150)#61 | $1,282(-184)#9,933 |
| 62. | Ridgeway | $1,089 | $948(+141)#62 | $1,282(-193)#10,112 |
| 63. | Welcome | $1,081 | $948(+133)#63 | $1,282(-201)#10,227 |
| 64. | Ladson | $1,074 | $948(+126)#64 | $1,282(-208)#10,357 |
| 65. | Chapin | $1,074 | $948(+126)#65 | $1,282(-208)#10,368 |
| 66. | Boiling Springs | $1,065 | $948(+117)#66 | $1,282(-217)#10,494 |
| 67. | Lancaster | $1,064 | $948(+116)#67 | $1,282(-218)#10,511 |
| 68. | Pine Ridge | $1,063 | $948(+115)#68 | $1,282(-219)#10,519 |
| 69. | Powdersville | $1,059 | $948(+111)#69 | $1,282(-223)#10,586 |
| 70. | Mauldin | $1,048 | $948(+100.0)#70 | $1,282(-234)#10,772 |
| 71. | Easley | $1,048 | $948(+100.0)#71 | $1,282(-234)#10,773 |
| 72. | Valley Falls | $1,046 | $948(+98.0)#72 | $1,282(-236)#10,815 |
| 73. | Springdale | $1,046 | $948(+98.0)#73 | $1,282(-236)#10,822 |
| 74. | Forest Acres | $1,042 | $948(+94.0)#74 | $1,282(-240)#10,884 |
| 75. | North Augusta | $1,036 | $948(+88.0)#75 | $1,282(-246)#11,014 |
| 76. | Plum Branch | $1,031 | $948(+83.0)#76 | $1,282(-251)#11,124 |
| 77. | Travelers Rest | $1,029 | $948(+81.0)#77 | $1,282(-253)#11,154 |
| 78. | Murphys Estates | $1,025 | $948(+77.0)#78 | $1,282(-257)#11,233 |
| 79. | Golden Grove | $1,021 | $948(+73.0)#79 | $1,282(-261)#11,310 |
| 80. | Stateburg | $1,021 | $948(+73.0)#80 | $1,282(-261)#11,313 |
| 81. | Northlake | $1,018 | $948(+70.0)#81 | $1,282(-264)#11,367 |
| 82. | Florence | $1,013 | $948(+65.0)#82 | $1,282(-269)#11,452 |
| 83. | Murrells Inlet | $1,009 | $948(+61.0)#83 | $1,282(-273)#11,515 |
| 84. | Newport | $1,007 | $948(+59.0)#84 | $1,282(-275)#11,551 |
| 85. | Wade Hampton | $1,002 | $948(+54.0)#85 | $1,282(-280)#11,633 |
| 86. | Clearwater | $1,001 | $948(+53.0)#86 | $1,282(-281)#11,659 |
| 87. | Gilbert | $1,000 | $948(+52.0)#87 | $1,282(-282)#11,686 |
| 88. | Camden | $997 | $948(+49.0)#88 | $1,282(-285)#11,736 |
| 89. | Harbor Island | $994 | $948(+46.0)#89 | $1,282(-288)#11,800 |
| 90. | Forestbrook | $992 | $948(+44.0)#90 | $1,282(-290)#11,817 |
| 91. | Seven Oaks | $989 | $948(+41.0)#91 | $1,282(-293)#11,865 |
| 92. | Folly Beach | $989 | $948(+41.0)#92 | $1,282(-293)#11,875 |
| 93. | North Myrtle Beach | $983 | $948(+35.0)#93 | $1,282(-299)#11,955 |
| 94. | Jackson | $982 | $948(+34.0)#94 | $1,282(-300)#11,990 |
| 95. | Roebuck | $977 | $948(+29.0)#95 | $1,282(-305)#12,077 |
| 96. | Watts Mills | $975 | $948(+27.0)#96 | $1,282(-307)#12,108 |
| 97. | Due West | $974 | $948(+26.0)#97 | $1,282(-308)#12,149 |
| 98. | Burton | $970 | $948(+22.0)#98 | $1,282(-312)#12,207 |
| 99. | Oak Grove | $967 | $948(+19.0)#99 | $1,282(-315)#12,252 |
| 100. | Ridgeland | $962 | $948(+14.0)#100 | $1,282(-320)#12,377 |
Common Questions
What are the Top 10 Cities with the Highest Owner-Occupied Median Costs of Housing in South Carolina?
Top 10 Cities with the Highest Owner-Occupied Median Costs of Housing in South Carolina are:
#1
$3,693
#2
$3,088
#3
$2,721
#4
$2,274
#5
$2,150
#6
$2,077
#7
$2,033
#8
$2,002
#9
$1,999
#10
$1,826
What city has the Highest Owner-Occupied Median Costs of Housing in South Carolina?
Sullivan s Island has the Highest Owner-Occupied Median Costs of Housing in South Carolina with $3,693.
What is the Median Renter-Occupied Housing Costs in the State of South Carolina?
Median Renter-Occupied Housing Costs in South Carolina is $948.
What is the Median Renter-Occupied Housing Costs in the United States?
Median Renter-Occupied Housing Costs in the United States is $1,282.