Cities with the Highest Owner-Occupied Median Costs of Housing in New Mexico
RELATED REPORTS & OPTIONS
Highest Owner Housing Costs
New Mexico
Compare Cities
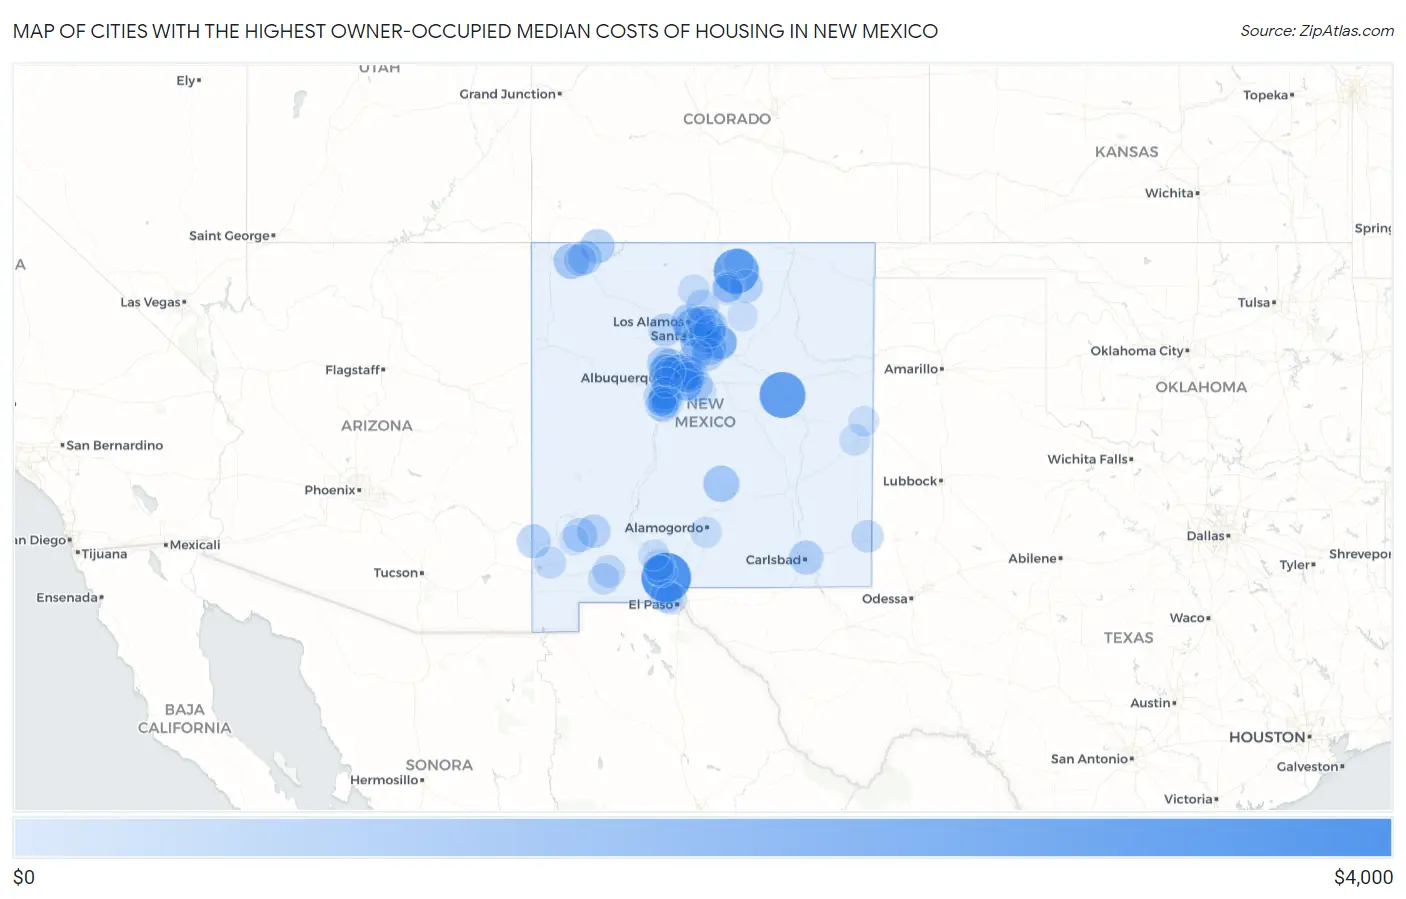
Map of Cities with the Highest Owner-Occupied Median Costs of Housing in New Mexico
$0
$4,000
Cities with the Highest Owner-Occupied Median Costs of Housing in New Mexico
| City | Housing Costs | vs State | vs National | |
| 1. | Mesquite | $3,152 | $879(+2.27k)#1 | $1,282(+1.87k)#501 |
| 2. | Hyde Park | $3,103 | $879(+2.22k)#2 | $1,282(+1.82k)#544 |
| 3. | Conejo | $2,792 | $879(+1.91k)#3 | $1,282(+1.51k)#825 |
| 4. | La Tierra | $2,741 | $879(+1.86k)#4 | $1,282(+1.46k)#889 |
| 5. | Puerto De Luna | $2,707 | $879(+1.83k)#5 | $1,282(+1.43k)#940 |
| 6. | Taos Ski Valley | $2,600 | $879(+1.72k)#6 | $1,282(+1.32k)#1,108 |
| 7. | Paa-Ko | $2,515 | $879(+1.64k)#7 | $1,282(+1.23k)#1,264 |
| 8. | Santa Fe Foothills | $1,857 | $879(+978)#8 | $1,282(+575)#3,244 |
| 9. | White Rock | $1,790 | $879(+911)#9 | $1,282(+508)#3,605 |
| 10. | Las Campanas | $1,630 | $879(+751)#10 | $1,282(+348)#4,541 |
| 11. | Sandia Park | $1,611 | $879(+732)#11 | $1,282(+329)#4,681 |
| 12. | Tano Road | $1,594 | $879(+715)#12 | $1,282(+312)#4,775 |
| 13. | La Cienega | $1,585 | $879(+706)#13 | $1,282(+303)#4,843 |
| 14. | Glorieta | $1,564 | $879(+685)#14 | $1,282(+282)#4,995 |
| 15. | Tres Arroyos | $1,562 | $879(+683)#15 | $1,282(+280)#5,015 |
| 16. | Nogal | $1,531 | $879(+652)#16 | $1,282(+249)#5,282 |
| 17. | San Antonito Cdp Bernalillo County | $1,513 | $879(+634)#17 | $1,282(+231)#5,431 |
| 18. | Cedro | $1,474 | $879(+595)#18 | $1,282(+192)#5,724 |
| 19. | Eldorado At Santa Fe | $1,454 | $879(+575)#19 | $1,282(+172)#5,891 |
| 20. | Kirtland | $1,443 | $879(+564)#20 | $1,282(+161)#5,973 |
| 21. | Sunlit Hills | $1,431 | $879(+552)#21 | $1,282(+149)#6,059 |
| 22. | Los Ranchos De Albuquerque | $1,427 | $879(+548)#22 | $1,282(+145)#6,084 |
| 23. | Cuyamungue Grant | $1,413 | $879(+534)#23 | $1,282(+131)#6,196 |
| 24. | Corrales | $1,404 | $879(+525)#24 | $1,282(+122)#6,262 |
| 25. | Peralta | $1,400 | $879(+521)#25 | $1,282(+118)#6,315 |
| 26. | Catalpa Canyon | $1,370 | $879(+491)#26 | $1,282(+88.0)#6,600 |
| 27. | Chupadero | $1,343 | $879(+464)#27 | $1,282(+61.0)#6,863 |
| 28. | Los Alamos | $1,316 | $879(+437)#28 | $1,282(+34.0)#7,166 |
| 29. | Cedar Hill | $1,306 | $879(+427)#29 | $1,282(+24.0)#7,284 |
| 30. | Fruitland | $1,300 | $879(+421)#30 | $1,282(+18.0)#7,348 |
| 31. | La Huerta | $1,292 | $879(+413)#31 | $1,282(+10.00)#7,438 |
| 32. | Arenas Valley | $1,286 | $879(+407)#32 | $1,282(+4.00)#7,498 |
| 33. | Flora Vista | $1,266 | $879(+387)#33 | $1,282(-16.0)#7,725 |
| 34. | White Cliffs | $1,266 | $879(+387)#34 | $1,282(-16.0)#7,728 |
| 35. | Rio Rancho | $1,257 | $879(+378)#35 | $1,282(-25.0)#7,829 |
| 36. | Virden | $1,253 | $879(+374)#36 | $1,282(-29.0)#7,885 |
| 37. | Santa Fe | $1,215 | $879(+336)#37 | $1,282(-67.0)#8,280 |
| 38. | Mimbres | $1,214 | $879(+335)#38 | $1,282(-68.0)#8,300 |
| 39. | Sandia Knolls | $1,211 | $879(+332)#39 | $1,282(-71.0)#8,338 |
| 40. | Angel Fire | $1,188 | $879(+309)#40 | $1,282(-94.0)#8,633 |
| 41. | Albuquerque | $1,184 | $879(+305)#41 | $1,282(-98.0)#8,676 |
| 42. | Sandia Heights | $1,183 | $879(+304)#42 | $1,282(-99.0)#8,698 |
| 43. | La Cueva | $1,172 | $879(+293)#43 | $1,282(-110)#8,832 |
| 44. | Jemez Springs | $1,167 | $879(+288)#44 | $1,282(-115)#8,896 |
| 45. | Los Lunas | $1,158 | $879(+279)#45 | $1,282(-124)#9,001 |
| 46. | La Villita | $1,157 | $879(+278)#46 | $1,282(-125)#9,027 |
| 47. | Cañoncito | $1,156 | $879(+277)#47 | $1,282(-126)#9,045 |
| 48. | Thunder Mountain | $1,134 | $879(+255)#48 | $1,282(-148)#9,343 |
| 49. | Edgewood | $1,133 | $879(+254)#49 | $1,282(-149)#9,350 |
| 50. | Farmington | $1,121 | $879(+242)#50 | $1,282(-161)#9,563 |
| 51. | Indian Hills | $1,118 | $879(+239)#51 | $1,282(-164)#9,622 |
| 52. | Santa Teresa | $1,115 | $879(+236)#52 | $1,282(-167)#9,659 |
| 53. | North Hobbs | $1,099 | $879(+220)#53 | $1,282(-183)#9,920 |
| 54. | Barton | $1,096 | $879(+217)#54 | $1,282(-186)#9,979 |
| 55. | Cedar Crest | $1,094 | $879(+215)#55 | $1,282(-188)#10,016 |
| 56. | Chical | $1,084 | $879(+205)#56 | $1,282(-198)#10,182 |
| 57. | Ventura | $1,083 | $879(+204)#57 | $1,282(-199)#10,196 |
| 58. | Galisteo | $1,078 | $879(+199)#58 | $1,282(-204)#10,298 |
| 59. | Tesuque | $1,076 | $879(+197)#59 | $1,282(-206)#10,326 |
| 60. | Edith Enclave | $1,073 | $879(+194)#60 | $1,282(-209)#10,391 |
| 61. | Sausal | $1,072 | $879(+193)#61 | $1,282(-210)#10,400 |
| 62. | El Cerro | $1,063 | $879(+184)#62 | $1,282(-219)#10,518 |
| 63. | Encantado | $1,053 | $879(+174)#63 | $1,282(-229)#10,709 |
| 64. | Middle Mesa | $1,048 | $879(+169)#64 | $1,282(-234)#10,784 |
| 65. | Paradise Hills | $1,045 | $879(+166)#65 | $1,282(-237)#10,830 |
| 66. | Bosque Farms | $1,035 | $879(+156)#66 | $1,282(-247)#11,044 |
| 67. | Lobo Canyon | $1,034 | $879(+155)#67 | $1,282(-248)#11,070 |
| 68. | Glen Acres | $1,030 | $879(+151)#68 | $1,282(-252)#11,142 |
| 69. | Ponderosa Pine | $1,025 | $879(+146)#69 | $1,282(-257)#11,236 |
| 70. | Tome | $1,023 | $879(+144)#70 | $1,282(-259)#11,274 |
| 71. | Sunland Park | $1,013 | $879(+134)#71 | $1,282(-269)#11,455 |
| 72. | Madrid | $1,009 | $879(+130)#72 | $1,282(-273)#11,529 |
| 73. | Sunshine | $1,004 | $879(+125)#73 | $1,282(-278)#11,610 |
| 74. | Taos | $996 | $879(+117)#74 | $1,282(-286)#11,756 |
| 75. | Rio Rancho Estates | $980 | $879(+101)#75 | $1,282(-302)#12,032 |
| 76. | Las Maravillas | $976 | $879(+97.0)#76 | $1,282(-306)#12,096 |
| 77. | San Pablo | $972 | $879(+93.0)#77 | $1,282(-310)#12,184 |
| 78. | Las Cruces | $968 | $879(+89.0)#78 | $1,282(-314)#12,231 |
| 79. | Portales | $954 | $879(+75.0)#79 | $1,282(-328)#12,527 |
| 80. | El Rito | $949 | $879(+70.0)#80 | $1,282(-333)#12,677 |
| 81. | Boles Acres | $944 | $879(+65.0)#81 | $1,282(-338)#12,761 |
| 82. | Sedillo | $932 | $879(+53.0)#82 | $1,282(-350)#13,027 |
| 83. | Ojo Encino | $923 | $879(+44.0)#83 | $1,282(-359)#13,233 |
| 84. | Radium Springs | $908 | $879(+29.0)#84 | $1,282(-374)#13,593 |
| 85. | Red River | $906 | $879(+27.0)#85 | $1,282(-376)#13,646 |
| 86. | North Valley | $898 | $879(+19.0)#86 | $1,282(-384)#13,835 |
| 87. | Clovis | $887 | $879(+8.00)#87 | $1,282(-395)#14,058 |
| 88. | Jaconita | $874 | $879(-5.00)#88 | $1,282(-408)#14,371 |
| 89. | Talpa | $871 | $879(-8.00)#89 | $1,282(-411)#14,428 |
| 90. | Rio Communities | $869 | $879(-10.00)#90 | $1,282(-413)#14,475 |
| 91. | Valle Vista | $866 | $879(-13.0)#91 | $1,282(-416)#14,574 |
| 92. | Mora | $859 | $879(-20.0)#92 | $1,282(-423)#14,727 |
| 93. | Mesilla | $856 | $879(-23.0)#93 | $1,282(-426)#14,780 |
| 94. | Ranchos De Taos | $854 | $879(-25.0)#94 | $1,282(-428)#14,824 |
| 95. | Casas Adobes | $848 | $879(-31.0)#95 | $1,282(-434)#15,025 |
| 96. | Mcintosh | $846 | $879(-33.0)#96 | $1,282(-436)#15,065 |
| 97. | Tyrone | $833 | $879(-46.0)#97 | $1,282(-449)#15,349 |
| 98. | South Valley | $830 | $879(-49.0)#98 | $1,282(-452)#15,420 |
| 99. | Placitas Cdp Sandoval County | $829 | $879(-50.0)#99 | $1,282(-453)#15,462 |
| 100. | Los Chaves | $820 | $879(-59.0)#100 | $1,282(-462)#15,722 |
Common Questions
What are the Top 10 Cities with the Highest Owner-Occupied Median Costs of Housing in New Mexico?
Top 10 Cities with the Highest Owner-Occupied Median Costs of Housing in New Mexico are:
#1
$3,152
#2
$2,707
#3
$2,600
#4
$1,790
#5
$1,611
#6
$1,585
#7
$1,564
#8
$1,531
#9
$1,474
#10
$1,454
What city has the Highest Owner-Occupied Median Costs of Housing in New Mexico?
Mesquite has the Highest Owner-Occupied Median Costs of Housing in New Mexico with $3,152.
What is the Median Renter-Occupied Housing Costs in the State of New Mexico?
Median Renter-Occupied Housing Costs in New Mexico is $879.
What is the Median Renter-Occupied Housing Costs in the United States?
Median Renter-Occupied Housing Costs in the United States is $1,282.