Cities with the Highest Owner-Occupied Median Costs of Housing in Connecticut
RELATED REPORTS & OPTIONS
Highest Owner Housing Costs
Connecticut
Compare Cities
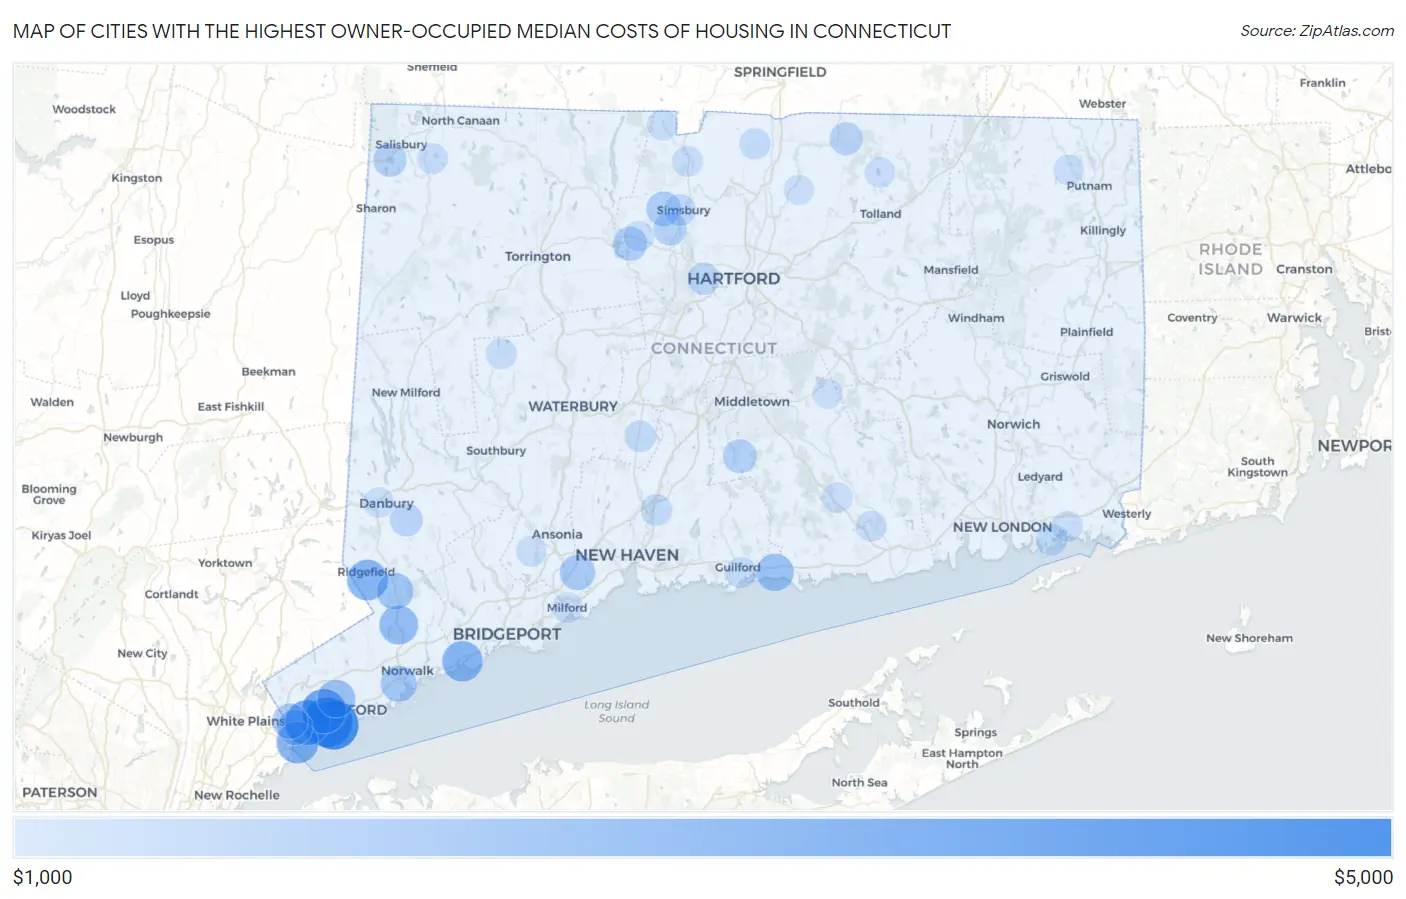
Map of Cities with the Highest Owner-Occupied Median Costs of Housing in Connecticut
$0
$5,000
Cities with the Highest Owner-Occupied Median Costs of Housing in Connecticut
| City | Housing Costs | vs State | vs National | |
| 1. | Riverside | $4,001 | $1,862(+2.14k)#1 | $1,282(+2.72k)#35 |
| 2. | Old Greenwich | $4,001 | $1,862(+2.14k)#2 | $1,282(+2.72k)#47 |
| 3. | Noroton | $4,001 | $1,862(+2.14k)#3 | $1,282(+2.72k)#55 |
| 4. | Compo | $4,001 | $1,862(+2.14k)#4 | $1,282(+2.72k)#70 |
| 5. | Coleytown | $4,001 | $1,862(+2.14k)#5 | $1,282(+2.72k)#77 |
| 6. | Greens Farms | $4,001 | $1,862(+2.14k)#6 | $1,282(+2.72k)#83 |
| 7. | Tokeneke | $4,001 | $1,862(+2.14k)#7 | $1,282(+2.72k)#94 |
| 8. | Ridgebury | $4,001 | $1,862(+2.14k)#8 | $1,282(+2.72k)#99 |
| 9. | Poplar Plains | $4,001 | $1,862(+2.14k)#9 | $1,282(+2.72k)#118 |
| 10. | Weston | $4,001 | $1,862(+2.14k)#10 | $1,282(+2.72k)#143 |
| 11. | Mamanasco Lake | $4,001 | $1,862(+2.14k)#11 | $1,282(+2.72k)#163 |
| 12. | Indian Field | $4,001 | $1,862(+2.14k)#12 | $1,282(+2.72k)#165 |
| 13. | Rock Ridge | $4,001 | $1,862(+2.14k)#13 | $1,282(+2.72k)#168 |
| 14. | Sail Harbor | $4,001 | $1,862(+2.14k)#14 | $1,282(+2.72k)#180 |
| 15. | Fenwick Borough | $4,001 | $1,862(+2.14k)#15 | $1,282(+2.72k)#187 |
| 16. | Bogus Hill | $3,912 | $1,862(+2.05k)#16 | $1,282(+2.63k)#201 |
| 17. | Candlewood Isle | $3,863 | $1,862(+2.00k)#17 | $1,282(+2.58k)#213 |
| 18. | Noroton Heights | $3,791 | $1,862(+1.93k)#18 | $1,282(+2.51k)#233 |
| 19. | Westport | $3,718 | $1,862(+1.86k)#19 | $1,282(+2.44k)#254 |
| 20. | West Mountain | $3,613 | $1,862(+1.75k)#20 | $1,282(+2.33k)#282 |
| 21. | Candlewood Lake Club | $3,606 | $1,862(+1.74k)#21 | $1,282(+2.32k)#283 |
| 22. | Saugatuck | $3,533 | $1,862(+1.67k)#22 | $1,282(+2.25k)#312 |
| 23. | Topstone | $3,500 | $1,862(+1.64k)#23 | $1,282(+2.22k)#329 |
| 24. | Greenwich | $3,494 | $1,862(+1.63k)#24 | $1,282(+2.21k)#331 |
| 25. | Cos Cob | $3,449 | $1,862(+1.59k)#25 | $1,282(+2.17k)#347 |
| 26. | Redding Center | $3,425 | $1,862(+1.56k)#26 | $1,282(+2.14k)#358 |
| 27. | Murray | $3,404 | $1,862(+1.54k)#27 | $1,282(+2.12k)#366 |
| 28. | Staples | $3,381 | $1,862(+1.52k)#28 | $1,282(+2.10k)#380 |
| 29. | Darien Downtown | $3,241 | $1,862(+1.38k)#29 | $1,282(+1.96k)#450 |
| 30. | Tashua | $3,154 | $1,862(+1.29k)#30 | $1,282(+1.87k)#498 |
| 31. | Byram | $3,120 | $1,862(+1.26k)#31 | $1,282(+1.84k)#531 |
| 32. | Lakes West | $3,108 | $1,862(+1.25k)#32 | $1,282(+1.83k)#539 |
| 33. | South Wilton | $3,033 | $1,862(+1.17k)#33 | $1,282(+1.75k)#594 |
| 34. | Ridgefield | $3,017 | $1,862(+1.16k)#34 | $1,282(+1.74k)#607 |
| 35. | Southport | $2,993 | $1,862(+1.13k)#35 | $1,282(+1.71k)#635 |
| 36. | Lakes East | $2,919 | $1,862(+1.06k)#36 | $1,282(+1.64k)#701 |
| 37. | East | $2,917 | $1,862(+1.05k)#37 | $1,282(+1.64k)#703 |
| 38. | New Canaan | $2,915 | $1,862(+1.05k)#38 | $1,282(+1.63k)#705 |
| 39. | Mill Plain | $2,869 | $1,862(+1.01k)#39 | $1,282(+1.59k)#752 |
| 40. | Old Hill | $2,839 | $1,862(+977)#40 | $1,282(+1.56k)#777 |
| 41. | Wilton Center | $2,808 | $1,862(+946)#41 | $1,282(+1.53k)#801 |
| 42. | Daniels Farm | $2,763 | $1,862(+901)#42 | $1,282(+1.48k)#855 |
| 43. | Stamford | $2,707 | $1,862(+845)#43 | $1,282(+1.43k)#938 |
| 44. | Route 7 Gateway | $2,676 | $1,862(+814)#44 | $1,282(+1.39k)#969 |
| 45. | Stonington Borough | $2,656 | $1,862(+794)#45 | $1,282(+1.37k)#1,004 |
| 46. | Groton Long Point Borough | $2,641 | $1,862(+779)#46 | $1,282(+1.36k)#1,027 |
| 47. | Madison Center | $2,634 | $1,862(+772)#47 | $1,282(+1.35k)#1,041 |
| 48. | Georgetown | $2,577 | $1,862(+715)#48 | $1,282(+1.29k)#1,154 |
| 49. | Brookfield Center | $2,559 | $1,862(+697)#49 | $1,282(+1.28k)#1,184 |
| 50. | Newtown Borough | $2,549 | $1,862(+687)#50 | $1,282(+1.27k)#1,204 |
| 51. | Trumbull Center | $2,520 | $1,862(+658)#51 | $1,282(+1.24k)#1,257 |
| 52. | Norwalk | $2,512 | $1,862(+650)#52 | $1,282(+1.23k)#1,269 |
| 53. | Pemberwick | $2,441 | $1,862(+579)#53 | $1,282(+1.16k)#1,395 |
| 54. | Glenville | $2,438 | $1,862(+576)#54 | $1,282(+1.16k)#1,405 |
| 55. | Orange | $2,424 | $1,862(+562)#55 | $1,282(+1.14k)#1,429 |
| 56. | Sandy Hook | $2,414 | $1,862(+552)#56 | $1,282(+1.13k)#1,444 |
| 57. | Botsford | $2,389 | $1,862(+527)#57 | $1,282(+1.11k)#1,492 |
| 58. | Gaylordsville | $2,375 | $1,862(+513)#58 | $1,282(+1.09k)#1,524 |
| 59. | West Simsbury | $2,334 | $1,862(+472)#59 | $1,282(+1.05k)#1,614 |
| 60. | Plattsville | $2,313 | $1,862(+451)#60 | $1,282(+1.03k)#1,670 |
| 61. | Collinsville | $2,302 | $1,862(+440)#61 | $1,282(+1.02k)#1,714 |
| 62. | Stepney | $2,288 | $1,862(+426)#62 | $1,282(+1.01k)#1,753 |
| 63. | Durham | $2,266 | $1,862(+404)#63 | $1,282(+984)#1,817 |
| 64. | Weatogue | $2,221 | $1,862(+359)#64 | $1,282(+939)#1,910 |
| 65. | Lakeville | $2,220 | $1,862(+358)#65 | $1,282(+938)#1,916 |
| 66. | Bigelow Corners | $2,202 | $1,862(+340)#66 | $1,282(+920)#1,959 |
| 67. | Somers | $2,195 | $1,862(+333)#67 | $1,282(+913)#1,985 |
| 68. | Bethel | $2,153 | $1,862(+291)#68 | $1,282(+871)#2,126 |
| 69. | Lakeside Woods | $2,111 | $1,862(+249)#69 | $1,282(+829)#2,261 |
| 70. | West Hartford | $2,093 | $1,862(+231)#70 | $1,282(+811)#2,319 |
| 71. | Simsbury Center | $2,048 | $1,862(+186)#71 | $1,282(+766)#2,474 |
| 72. | Taylor Corners | $2,047 | $1,862(+185)#72 | $1,282(+765)#2,482 |
| 73. | North Haven | $2,019 | $1,862(+157)#73 | $1,282(+737)#2,592 |
| 74. | Cheshire Village | $2,016 | $1,862(+154)#74 | $1,282(+734)#2,608 |
| 75. | Noank | $1,996 | $1,862(+134)#75 | $1,282(+714)#2,693 |
| 76. | Ball Pond | $1,990 | $1,862(+128)#76 | $1,282(+708)#2,708 |
| 77. | Suffield Depot | $1,979 | $1,862(+117)#77 | $1,282(+697)#2,736 |
| 78. | Guilford Center | $1,966 | $1,862(+104)#78 | $1,282(+684)#2,781 |
| 79. | Bantam Borough | $1,961 | $1,862(+99.0)#79 | $1,282(+679)#2,797 |
| 80. | Bethlehem Village | $1,950 | $1,862(+88.0)#80 | $1,282(+668)#2,827 |
| 81. | Salmon Brook | $1,946 | $1,862(+84.0)#81 | $1,282(+664)#2,843 |
| 82. | North Granby | $1,946 | $1,862(+84.0)#82 | $1,282(+664)#2,844 |
| 83. | Falls Village | $1,943 | $1,862(+81.0)#83 | $1,282(+661)#2,856 |
| 84. | Essex Village | $1,939 | $1,862(+77.0)#84 | $1,282(+657)#2,871 |
| 85. | Milford City Balance | $1,932 | $1,862(+70.0)#85 | $1,282(+650)#2,896 |
| 86. | Quasset Lake | $1,927 | $1,862(+65.0)#86 | $1,282(+645)#2,914 |
| 87. | Litchfield Borough | $1,924 | $1,862(+62.0)#87 | $1,282(+642)#2,929 |
| 88. | Danbury | $1,918 | $1,862(+56.0)#88 | $1,282(+636)#2,948 |
| 89. | Inglenook | $1,918 | $1,862(+56.0)#89 | $1,282(+636)#2,950 |
| 90. | Northford | $1,914 | $1,862(+52.0)#90 | $1,282(+632)#2,966 |
| 91. | Mystic | $1,913 | $1,862(+51.0)#91 | $1,282(+631)#2,975 |
| 92. | Chester Center | $1,911 | $1,862(+49.0)#92 | $1,282(+629)#2,980 |
| 93. | Crystal Lake | $1,910 | $1,862(+48.0)#93 | $1,282(+628)#2,988 |
| 94. | South Woodstock | $1,908 | $1,862(+46.0)#94 | $1,282(+626)#2,996 |
| 95. | Shelton | $1,907 | $1,862(+45.0)#95 | $1,282(+625)#3,000 |
| 96. | Canton Valley | $1,906 | $1,862(+44.0)#96 | $1,282(+624)#3,010 |
| 97. | Broad Brook | $1,878 | $1,862(+16.0)#97 | $1,282(+596)#3,139 |
| 98. | Jewett City Borough | $1,878 | $1,862(+16.0)#98 | $1,282(+596)#3,140 |
| 99. | Candlewood Shores | $1,871 | $1,862(+9.00)#99 | $1,282(+589)#3,179 |
| 100. | East Hampton | $1,865 | $1,862(+3.00)#100 | $1,282(+583)#3,207 |
Common Questions
What are the Top 10 Cities with the Highest Owner-Occupied Median Costs of Housing in Connecticut?
Top 10 Cities with the Highest Owner-Occupied Median Costs of Housing in Connecticut are:
#1
$4,001
#2
$4,001
#3
$3,494
#4
$3,449
#5
$3,120
#6
$3,017
#7
$2,993
#8
$2,808
#9
$2,707
#10
$2,634
What city has the Highest Owner-Occupied Median Costs of Housing in Connecticut?
Riverside has the Highest Owner-Occupied Median Costs of Housing in Connecticut with $4,001.
What is the Median Renter-Occupied Housing Costs in the State of Connecticut?
Median Renter-Occupied Housing Costs in Connecticut is $1,862.
What is the Median Renter-Occupied Housing Costs in the United States?
Median Renter-Occupied Housing Costs in the United States is $1,282.