Cities with the Highest Percentage of Costa Rican Population in Maryland
RELATED REPORTS & OPTIONS
Costa Rican
Maryland
Compare Cities
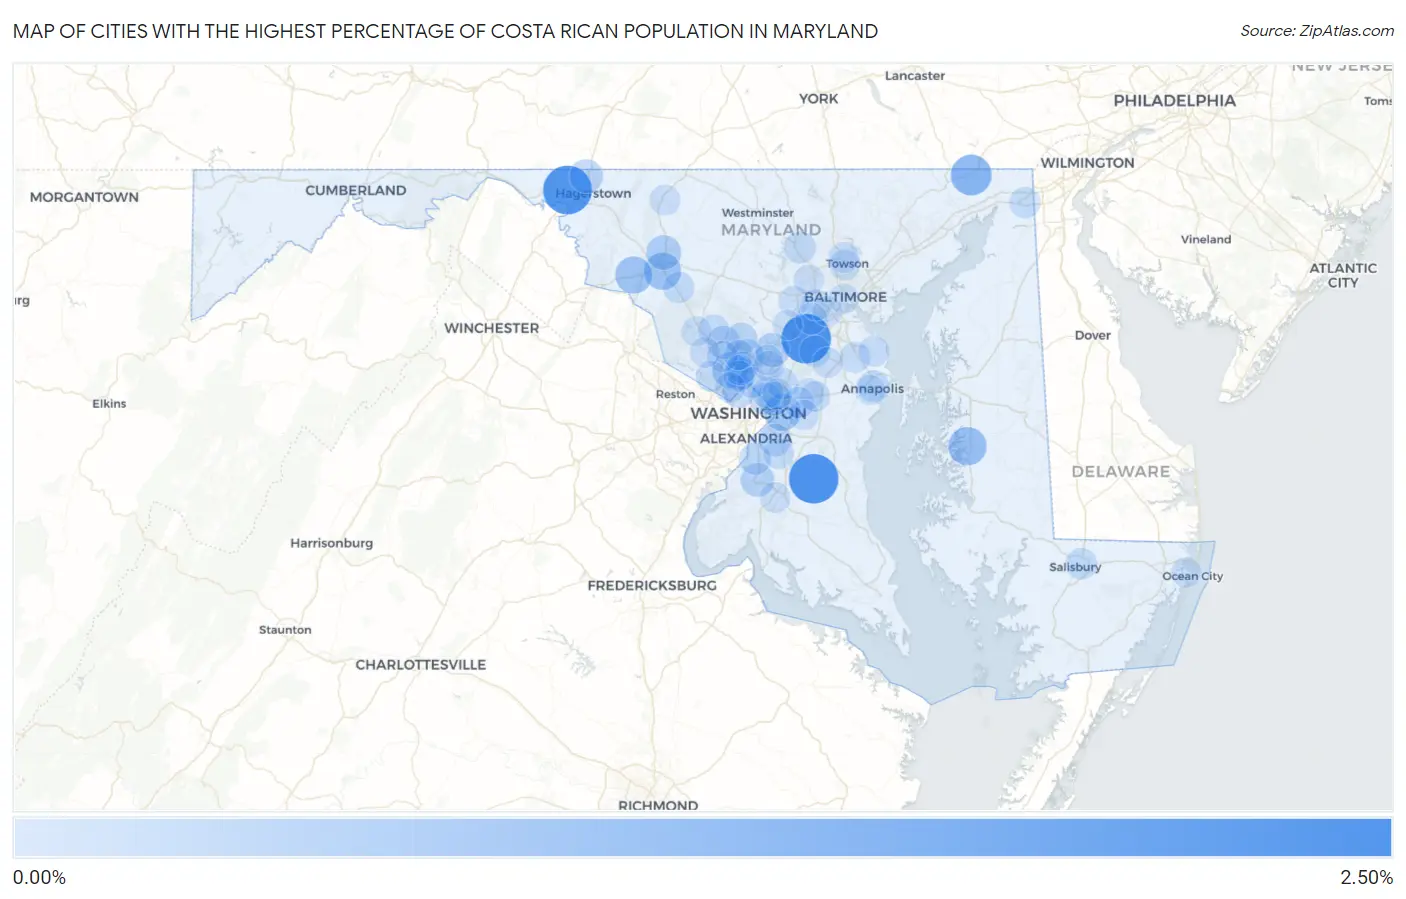
Map of Cities with the Highest Percentage of Costa Rican Population in Maryland
0.00%
2.50%
Cities with the Highest Percentage of Costa Rican Population in Maryland
| City | Costa Rican | vs State | vs National | |
| 1. | Jessup | 2.10% | 0.057%(+2.05)#1 | 0.052%(+2.05)#64 |
| 2. | Baden | 2.10% | 0.057%(+2.05)#2 | 0.052%(+2.05)#65 |
| 3. | Wilson Conococheague | 2.01% | 0.057%(+1.95)#3 | 0.052%(+1.95)#68 |
| 4. | Rising Sun | 1.12% | 0.057%(+1.07)#4 | 0.052%(+1.07)#139 |
| 5. | Easton | 0.86% | 0.057%(+0.802)#5 | 0.052%(+0.806)#186 |
| 6. | Ballenger Creek | 0.74% | 0.057%(+0.687)#6 | 0.052%(+0.692)#227 |
| 7. | Jefferson | 0.73% | 0.057%(+0.672)#7 | 0.052%(+0.677)#232 |
| 8. | Peppermill Village | 0.67% | 0.057%(+0.617)#8 | 0.052%(+0.622)#257 |
| 9. | North Bethesda | 0.57% | 0.057%(+0.509)#9 | 0.052%(+0.514)#303 |
| 10. | Frederick | 0.48% | 0.057%(+0.420)#10 | 0.052%(+0.425)#346 |
| 11. | Burtonsville | 0.42% | 0.057%(+0.360)#11 | 0.052%(+0.364)#402 |
| 12. | Accokeek | 0.37% | 0.057%(+0.312)#12 | 0.052%(+0.316)#452 |
| 13. | Maugansville | 0.36% | 0.057%(+0.304)#13 | 0.052%(+0.309)#462 |
| 14. | Bladensburg | 0.36% | 0.057%(+0.298)#14 | 0.052%(+0.303)#470 |
| 15. | Layhill | 0.35% | 0.057%(+0.292)#15 | 0.052%(+0.297)#475 |
| 16. | Redland | 0.33% | 0.057%(+0.270)#16 | 0.052%(+0.275)#503 |
| 17. | Chevy Chase Village | 0.32% | 0.057%(+0.261)#17 | 0.052%(+0.266)#515 |
| 18. | Kensington | 0.27% | 0.057%(+0.210)#18 | 0.052%(+0.215)#592 |
| 19. | Camp Springs | 0.26% | 0.057%(+0.205)#19 | 0.052%(+0.210)#602 |
| 20. | Olney | 0.22% | 0.057%(+0.165)#20 | 0.052%(+0.170)#684 |
| 21. | Fort Washington | 0.21% | 0.057%(+0.156)#21 | 0.052%(+0.161)#700 |
| 22. | Naval Academy | 0.20% | 0.057%(+0.141)#22 | 0.052%(+0.146)#744 |
| 23. | Mount Rainier | 0.19% | 0.057%(+0.136)#23 | 0.052%(+0.141)#760 |
| 24. | Reisterstown | 0.19% | 0.057%(+0.135)#24 | 0.052%(+0.140)#768 |
| 25. | Flower Hill | 0.16% | 0.057%(+0.107)#25 | 0.052%(+0.112)#850 |
| 26. | Ilchester | 0.16% | 0.057%(+0.100)#26 | 0.052%(+0.105)#869 |
| 27. | Salisbury | 0.14% | 0.057%(+0.085)#27 | 0.052%(+0.090)#924 |
| 28. | Urbana | 0.14% | 0.057%(+0.085)#28 | 0.052%(+0.090)#928 |
| 29. | Greenbelt | 0.14% | 0.057%(+0.081)#29 | 0.052%(+0.086)#944 |
| 30. | Elkton | 0.13% | 0.057%(+0.075)#30 | 0.052%(+0.080)#959 |
| 31. | Fort Meade | 0.13% | 0.057%(+0.073)#31 | 0.052%(+0.077)#972 |
| 32. | Wheaton | 0.13% | 0.057%(+0.068)#32 | 0.052%(+0.073)#995 |
| 33. | Hyattsville | 0.12% | 0.057%(+0.058)#33 | 0.052%(+0.063)#1,032 |
| 34. | South Kensington | 0.11% | 0.057%(+0.050)#34 | 0.052%(+0.055)#1,073 |
| 35. | Fairwood | 0.091% | 0.057%(+0.034)#35 | 0.052%(+0.039)#1,171 |
| 36. | Mitchellville | 0.091% | 0.057%(+0.034)#36 | 0.052%(+0.039)#1,175 |
| 37. | Montgomery Village | 0.089% | 0.057%(+0.032)#37 | 0.052%(+0.037)#1,187 |
| 38. | Rockville | 0.079% | 0.057%(+0.022)#38 | 0.052%(+0.027)#1,249 |
| 39. | Severna Park | 0.077% | 0.057%(+0.019)#39 | 0.052%(+0.024)#1,267 |
| 40. | Catonsville | 0.075% | 0.057%(+0.018)#40 | 0.052%(+0.022)#1,289 |
| 41. | Towson | 0.069% | 0.057%(+0.012)#41 | 0.052%(+0.017)#1,334 |
| 42. | Lake Shore | 0.069% | 0.057%(+0.012)#42 | 0.052%(+0.017)#1,342 |
| 43. | Potomac | 0.067% | 0.057%(+0.009)#43 | 0.052%(+0.014)#1,353 |
| 44. | Calverton | 0.065% | 0.057%(+0.008)#44 | 0.052%(+0.013)#1,361 |
| 45. | Thurmont | 0.063% | 0.057%(+0.006)#45 | 0.052%(+0.011)#1,378 |
| 46. | Ellicott City | 0.063% | 0.057%(+0.005)#46 | 0.052%(+0.010)#1,385 |
| 47. | Clinton | 0.062% | 0.057%(+0.005)#47 | 0.052%(+0.010)#1,387 |
| 48. | Lutherville | 0.061% | 0.057%(+0.003)#48 | 0.052%(+0.008)#1,400 |
| 49. | Silver Spring | 0.060% | 0.057%(+0.003)#49 | 0.052%(+0.008)#1,407 |
| 50. | Fairland | 0.050% | 0.057%(-0.007)#50 | 0.052%(-0.002)#1,487 |
| 51. | East Riverdale | 0.050% | 0.057%(-0.007)#51 | 0.052%(-0.003)#1,490 |
| 52. | Odenton | 0.049% | 0.057%(-0.008)#52 | 0.052%(-0.004)#1,497 |
| 53. | Bethesda | 0.048% | 0.057%(-0.009)#53 | 0.052%(-0.004)#1,503 |
| 54. | North Kensington | 0.047% | 0.057%(-0.010)#54 | 0.052%(-0.005)#1,513 |
| 55. | Waldorf | 0.037% | 0.057%(-0.020)#55 | 0.052%(-0.015)#1,608 |
| 56. | Bowie | 0.036% | 0.057%(-0.021)#56 | 0.052%(-0.016)#1,618 |
| 57. | Kettering | 0.036% | 0.057%(-0.021)#57 | 0.052%(-0.016)#1,623 |
| 58. | Milford Mill | 0.035% | 0.057%(-0.022)#58 | 0.052%(-0.017)#1,637 |
| 59. | North Potomac | 0.032% | 0.057%(-0.025)#59 | 0.052%(-0.020)#1,665 |
| 60. | Annapolis | 0.027% | 0.057%(-0.030)#60 | 0.052%(-0.025)#1,746 |
| 61. | Arbutus | 0.020% | 0.057%(-0.037)#61 | 0.052%(-0.032)#1,823 |
| 62. | West Ocean City | 0.019% | 0.057%(-0.038)#62 | 0.052%(-0.033)#1,841 |
| 63. | Baltimore | 0.018% | 0.057%(-0.039)#63 | 0.052%(-0.034)#1,856 |
| 64. | Aspen Hill | 0.017% | 0.057%(-0.041)#64 | 0.052%(-0.036)#1,874 |
| 65. | Germantown | 0.014% | 0.057%(-0.043)#65 | 0.052%(-0.038)#1,894 |
| 66. | Columbia | 0.013% | 0.057%(-0.044)#66 | 0.052%(-0.039)#1,909 |
Common Questions
What are the Top 10 Cities with the Highest Percentage of Costa Rican Population in Maryland?
Top 10 Cities with the Highest Percentage of Costa Rican Population in Maryland are:
#1
2.10%
#2
2.10%
#3
2.01%
#4
1.12%
#5
0.86%
#6
0.74%
#7
0.73%
#8
0.67%
#9
0.57%
#10
0.48%
What city has the Highest Percentage of Costa Rican Population in Maryland?
Jessup has the Highest Percentage of Costa Rican Population in Maryland with 2.10%.
What is the Percentage of Costa Rican Population in the State of Maryland?
Percentage of Costa Rican Population in Maryland is 0.057%.
What is the Percentage of Costa Rican Population in the United States?
Percentage of Costa Rican Population in the United States is 0.052%.