Cities with the Highest Percentage of Costa Rican Population in the United States
RELATED REPORTS & OPTIONS
Costa Rican
United States
Compare Cities
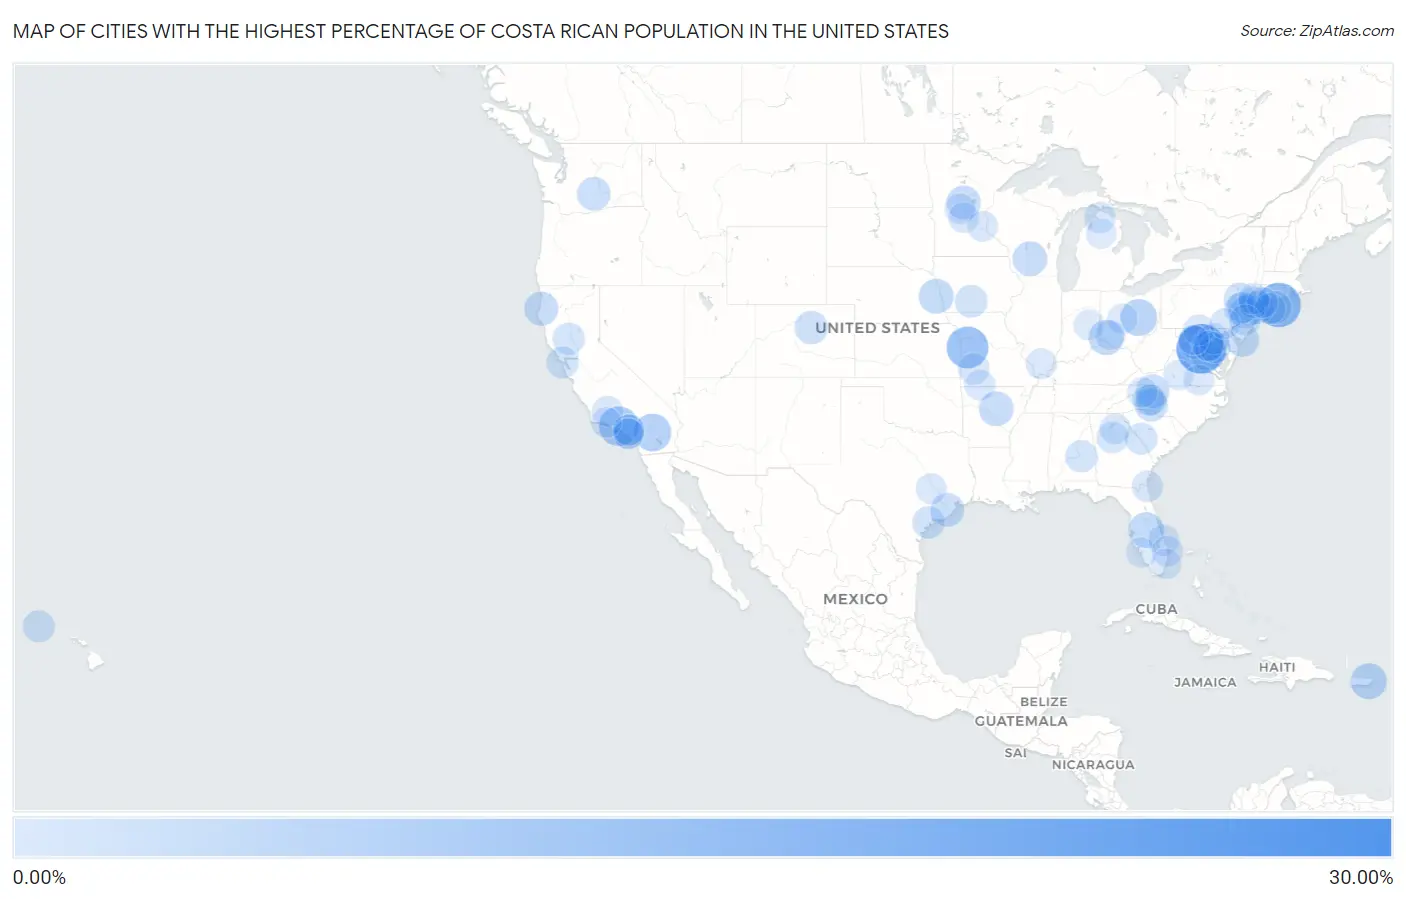
Map of Cities with the Highest Percentage of Costa Rican Population in the United States
0.00%
30.00%
Cities with the Highest Percentage of Costa Rican Population in the United States
| City | Costa Rican | vs State | vs National | |
| 1. | Millstone Borough | 26.88% | 0.25%(+26.6)#1 | 0.052%(+26.8)#1 |
| 2. | Midland | 19.76% | 0.043%(+19.7)#1 | 0.052%(+19.7)#2 |
| 3. | Northwest Harbor | 14.80% | 0.064%(+14.7)#1 | 0.052%(+14.7)#3 |
| 4. | Gunn City | 12.24% | 0.019%(+12.2)#1 | 0.052%(+12.2)#4 |
| 5. | Santa Susana | 10.07% | 0.073%(+10.00)#1 | 0.052%(+10.0)#5 |
| 6. | Bound Brook Borough | 9.80% | 0.25%(+9.55)#2 | 0.052%(+9.75)#6 |
| 7. | Indio Hills | 8.26% | 0.073%(+8.19)#2 | 0.052%(+8.21)#7 |
| 8. | Nellie | 7.41% | 0.019%(+7.39)#1 | 0.052%(+7.36)#8 |
| 9. | Lomas | 6.78% | 0.026%(+6.75)#1 | 0.052%(+6.72)#9 |
| 10. | South Bound Brook Borough | 6.61% | 0.25%(+6.36)#3 | 0.052%(+6.56)#10 |
| 11. | Dundee | 6.22% | 0.12%(+6.09)#1 | 0.052%(+6.16)#11 |
| 12. | Kenwood | 5.85% | 0.019%(+5.83)#2 | 0.052%(+5.80)#12 |
| 13. | Arlington | 5.60% | 0.016%(+5.58)#1 | 0.052%(+5.54)#13 |
| 14. | Mount Vernon | 5.42% | 0.022%(+5.39)#1 | 0.052%(+5.36)#14 |
| 15. | Bluffview | 5.36% | 0.018%(+5.34)#1 | 0.052%(+5.30)#15 |
| 16. | Raritan Borough | 5.10% | 0.25%(+4.84)#4 | 0.052%(+5.04)#16 |
| 17. | Cutten | 4.84% | 0.073%(+4.76)#3 | 0.052%(+4.78)#17 |
| 18. | Fort Ripley | 4.65% | 0.026%(+4.62)#1 | 0.052%(+4.60)#18 |
| 19. | Holiday Lakes | 4.56% | 0.039%(+4.52)#1 | 0.052%(+4.50)#19 |
| 20. | Cape May Court House | 4.53% | 0.25%(+4.28)#5 | 0.052%(+4.48)#20 |
| 21. | Mulberry | 4.49% | 0.053%(+4.44)#1 | 0.052%(+4.44)#21 |
| 22. | Terrace Heights | 4.41% | 0.042%(+4.36)#1 | 0.052%(+4.35)#22 |
| 23. | Applewood | 4.15% | 0.049%(+4.10)#1 | 0.052%(+4.09)#23 |
| 24. | Shenandoah Shores | 4.12% | 0.043%(+4.07)#2 | 0.052%(+4.06)#24 |
| 25. | Hampton Bays | 3.96% | 0.064%(+3.90)#2 | 0.052%(+3.91)#25 |
| 26. | Lincolnton | 3.96% | 0.053%(+3.90)#2 | 0.052%(+3.90)#26 |
| 27. | Sands Point | 3.92% | 0.064%(+3.86)#3 | 0.052%(+3.87)#27 |
| 28. | Deal Borough | 3.57% | 0.25%(+3.31)#6 | 0.052%(+3.51)#28 |
| 29. | Tivoli | 3.50% | 0.039%(+3.46)#2 | 0.052%(+3.45)#29 |
| 30. | Sunrise Lake | 3.46% | 0.035%(+3.42)#1 | 0.052%(+3.41)#30 |
| 31. | Netcong Borough | 3.44% | 0.25%(+3.19)#7 | 0.052%(+3.39)#31 |
| 32. | Truro | 3.44% | 0.012%(+3.43)#1 | 0.052%(+3.39)#32 |
| 33. | Stirling | 3.28% | 0.25%(+3.03)#8 | 0.052%(+3.23)#33 |
| 34. | New Vernon | 3.22% | 0.25%(+2.97)#9 | 0.052%(+3.17)#34 |
| 35. | Lyons | 3.21% | 0.25%(+2.95)#10 | 0.052%(+3.15)#35 |
| 36. | Poipu | 3.13% | 0.017%(+3.12)#1 | 0.052%(+3.08)#36 |
| 37. | Finderne | 3.08% | 0.25%(+2.83)#11 | 0.052%(+3.03)#37 |
| 38. | Bedminster | 3.03% | 0.25%(+2.78)#12 | 0.052%(+2.98)#38 |
| 39. | Williams | 3.01% | 0.073%(+2.94)#4 | 0.052%(+2.96)#39 |
| 40. | Redland | 3.00% | 0.0099%(+2.99)#1 | 0.052%(+2.95)#40 |
| 41. | Summit | 2.99% | 0.25%(+2.74)#13 | 0.052%(+2.94)#41 |
| 42. | Muir Beach | 2.95% | 0.073%(+2.88)#5 | 0.052%(+2.90)#42 |
| 43. | Clearwater | 2.94% | 0.046%(+2.89)#1 | 0.052%(+2.89)#43 |
| 44. | Long View | 2.66% | 0.053%(+2.61)#3 | 0.052%(+2.61)#44 |
| 45. | Oxford | 2.64% | 0.25%(+2.39)#14 | 0.052%(+2.59)#45 |
| 46. | Hackettstown | 2.63% | 0.25%(+2.38)#15 | 0.052%(+2.58)#46 |
| 47. | Industry | 2.56% | 0.073%(+2.49)#6 | 0.052%(+2.51)#47 |
| 48. | Porterdale | 2.56% | 0.053%(+2.51)#1 | 0.052%(+2.51)#48 |
| 49. | Dadeville | 2.42% | 0.019%(+2.40)#2 | 0.052%(+2.36)#49 |
| 50. | Lakes East | 2.40% | 0.11%(+2.29)#1 | 0.052%(+2.35)#50 |
| 51. | Kings Park | 2.32% | 0.043%(+2.28)#3 | 0.052%(+2.27)#51 |
| 52. | Flemington Borough | 2.32% | 0.25%(+2.07)#16 | 0.052%(+2.27)#52 |
| 53. | Alanson | 2.32% | 0.018%(+2.30)#1 | 0.052%(+2.27)#53 |
| 54. | Bardonia | 2.31% | 0.064%(+2.25)#4 | 0.052%(+2.26)#54 |
| 55. | Rossmoor | 2.27% | 0.073%(+2.19)#7 | 0.052%(+2.21)#55 |
| 56. | Passapatanzy | 2.26% | 0.043%(+2.22)#4 | 0.052%(+2.21)#56 |
| 57. | Fernandina Beach | 2.21% | 0.12%(+2.09)#2 | 0.052%(+2.16)#57 |
| 58. | Fort Montgomery | 2.20% | 0.064%(+2.14)#5 | 0.052%(+2.15)#58 |
| 59. | Indian River Estates | 2.20% | 0.12%(+2.07)#3 | 0.052%(+2.14)#59 |
| 60. | Moriches | 2.17% | 0.064%(+2.11)#6 | 0.052%(+2.12)#60 |
| 61. | Conover | 2.13% | 0.053%(+2.08)#4 | 0.052%(+2.08)#61 |
| 62. | Belmar Borough | 2.11% | 0.25%(+1.86)#17 | 0.052%(+2.06)#62 |
| 63. | Yardville | 2.11% | 0.25%(+1.86)#18 | 0.052%(+2.06)#63 |
| 64. | Jessup | 2.10% | 0.057%(+2.05)#1 | 0.052%(+2.05)#64 |
| 65. | Baden | 2.10% | 0.057%(+2.05)#2 | 0.052%(+2.05)#65 |
| 66. | West Puente Valley | 2.07% | 0.073%(+2.00)#8 | 0.052%(+2.02)#66 |
| 67. | Hoschton | 2.03% | 0.053%(+1.98)#2 | 0.052%(+1.98)#67 |
| 68. | Wilson Conococheague | 2.01% | 0.057%(+1.95)#3 | 0.052%(+1.95)#68 |
| 69. | Pine Air | 1.98% | 0.12%(+1.86)#4 | 0.052%(+1.93)#69 |
| 70. | South Taft | 1.98% | 0.073%(+1.91)#9 | 0.052%(+1.93)#70 |
| 71. | Caldwell | 1.97% | 0.039%(+1.93)#3 | 0.052%(+1.91)#71 |
| 72. | Norwalk | 1.93% | 0.11%(+1.82)#2 | 0.052%(+1.88)#72 |
| 73. | Shrewsbury Borough | 1.92% | 0.035%(+1.89)#2 | 0.052%(+1.87)#73 |
| 74. | Hollister | 1.92% | 0.019%(+1.90)#3 | 0.052%(+1.87)#74 |
| 75. | Spillertown | 1.90% | 0.022%(+1.88)#1 | 0.052%(+1.85)#75 |
| 76. | Swanville | 1.89% | 0.026%(+1.86)#2 | 0.052%(+1.83)#76 |
| 77. | Newington | 1.83% | 0.043%(+1.79)#5 | 0.052%(+1.78)#77 |
| 78. | Lake Como Borough | 1.81% | 0.25%(+1.56)#19 | 0.052%(+1.76)#78 |
| 79. | Gap | 1.81% | 0.035%(+1.77)#3 | 0.052%(+1.75)#79 |
| 80. | Stanton | 1.73% | 0.073%(+1.65)#10 | 0.052%(+1.67)#80 |
| 81. | Toro Canyon | 1.71% | 0.073%(+1.64)#11 | 0.052%(+1.66)#81 |
| 82. | Alberta | 1.68% | 0.043%(+1.64)#6 | 0.052%(+1.63)#82 |
| 83. | Cold Spring | 1.67% | 0.026%(+1.65)#3 | 0.052%(+1.62)#83 |
| 84. | Vadnais Heights | 1.63% | 0.026%(+1.61)#4 | 0.052%(+1.58)#84 |
| 85. | Pine Manor | 1.62% | 0.12%(+1.50)#5 | 0.052%(+1.57)#85 |
| 86. | Allendale Borough | 1.60% | 0.25%(+1.35)#20 | 0.052%(+1.55)#86 |
| 87. | Shirley | 1.56% | 0.011%(+1.55)#1 | 0.052%(+1.51)#87 |
| 88. | Manville Borough | 1.55% | 0.25%(+1.30)#21 | 0.052%(+1.50)#88 |
| 89. | Harmony Borough | 1.54% | 0.035%(+1.51)#4 | 0.052%(+1.49)#89 |
| 90. | Altavista | 1.54% | 0.043%(+1.50)#7 | 0.052%(+1.49)#90 |
| 91. | West Kittanning Borough | 1.53% | 0.035%(+1.49)#5 | 0.052%(+1.48)#91 |
| 92. | Stephens City | 1.47% | 0.043%(+1.43)#8 | 0.052%(+1.42)#92 |
| 93. | El Portal | 1.47% | 0.12%(+1.35)#6 | 0.052%(+1.42)#93 |
| 94. | Ostrander | 1.47% | 0.019%(+1.45)#3 | 0.052%(+1.42)#94 |
| 95. | Banner Elk | 1.46% | 0.053%(+1.41)#5 | 0.052%(+1.41)#95 |
| 96. | Morrow | 1.45% | 0.019%(+1.44)#4 | 0.052%(+1.40)#96 |
| 97. | Thunder Mountain | 1.44% | 0.022%(+1.41)#1 | 0.052%(+1.38)#97 |
| 98. | Rainbow Lakes | 1.43% | 0.25%(+1.18)#22 | 0.052%(+1.38)#98 |
| 99. | Grayling | 1.42% | 0.018%(+1.40)#2 | 0.052%(+1.37)#99 |
| 100. | Ringwood Borough | 1.42% | 0.25%(+1.17)#23 | 0.052%(+1.37)#100 |
Common Questions
What are the Top 10 Cities with the Highest Percentage of Costa Rican Population in the United States?
Top 10 Cities with the Highest Percentage of Costa Rican Population in the United States are:
What city has the Highest Percentage of Costa Rican Population in the United States?
Midland has the Highest Percentage of Costa Rican Population in the United States with 19.76%.
What is the Percentage of Costa Rican Population in the United States?
Percentage of Costa Rican Population in the United States is 0.052%.