Cities with the Highest Percentage of Costa Rican Population in New York
RELATED REPORTS & OPTIONS
Costa Rican
New York
Compare Cities
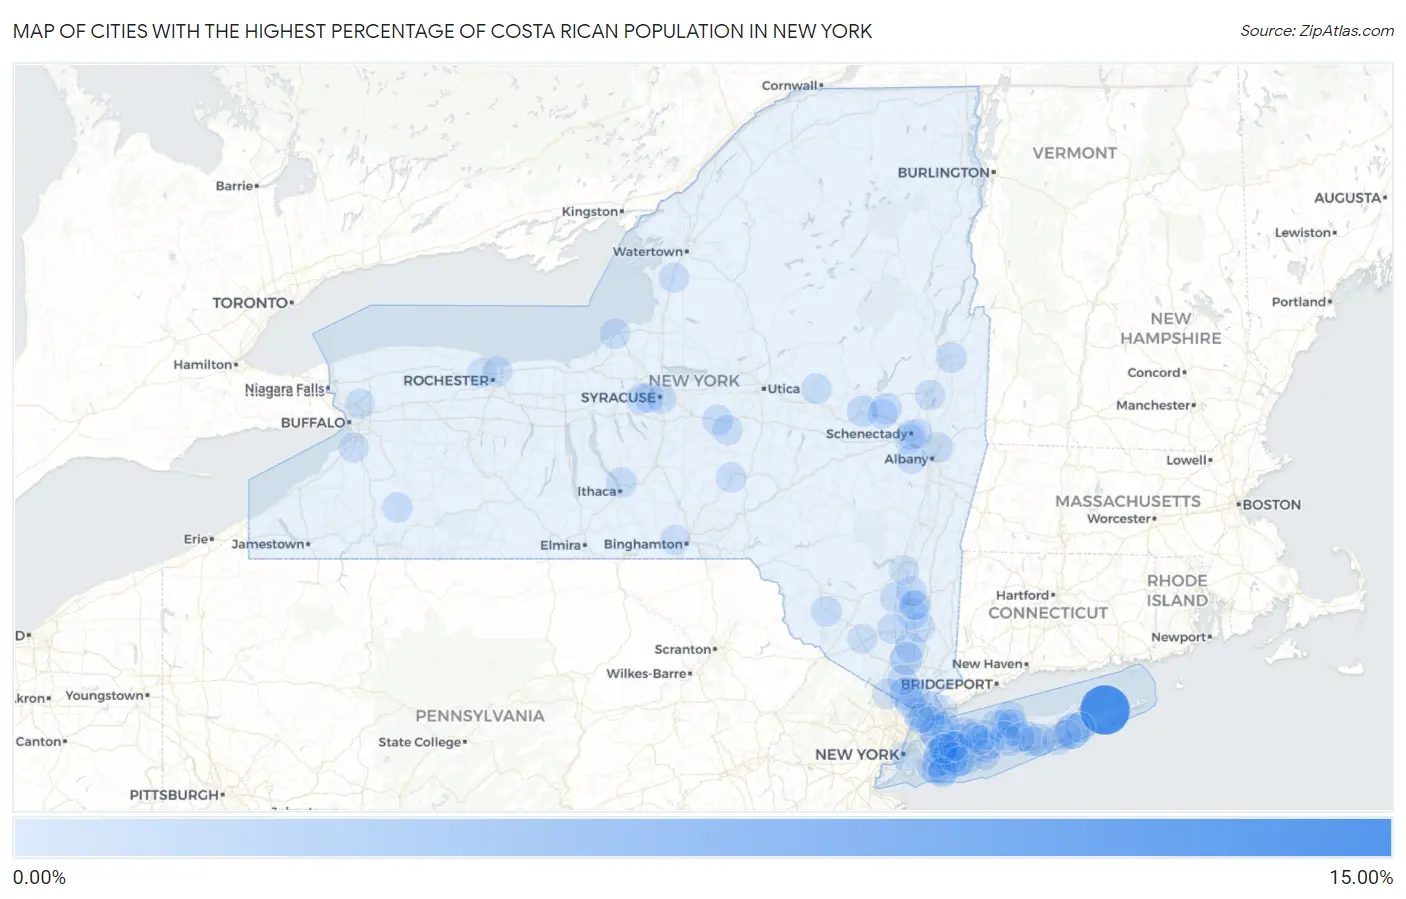
Map of Cities with the Highest Percentage of Costa Rican Population in New York
0.00%
15.00%
Cities with the Highest Percentage of Costa Rican Population in New York
| City | Costa Rican | vs State | vs National | |
| 1. | Northwest Harbor | 14.80% | 0.064%(+14.7)#1 | 0.052%(+14.7)#3 |
| 2. | Hampton Bays | 3.96% | 0.064%(+3.90)#2 | 0.052%(+3.91)#25 |
| 3. | Sands Point | 3.92% | 0.064%(+3.86)#3 | 0.052%(+3.87)#27 |
| 4. | Bardonia | 2.31% | 0.064%(+2.25)#4 | 0.052%(+2.26)#54 |
| 5. | Fort Montgomery | 2.20% | 0.064%(+2.14)#5 | 0.052%(+2.15)#58 |
| 6. | Moriches | 2.17% | 0.064%(+2.11)#6 | 0.052%(+2.12)#60 |
| 7. | Fonda | 1.01% | 0.064%(+0.946)#7 | 0.052%(+0.958)#160 |
| 8. | Selden | 0.84% | 0.064%(+0.777)#8 | 0.052%(+0.789)#192 |
| 9. | East Massapequa | 0.80% | 0.064%(+0.741)#9 | 0.052%(+0.752)#203 |
| 10. | Crown Heights | 0.79% | 0.064%(+0.728)#10 | 0.052%(+0.740)#208 |
| 11. | Nissequogue | 0.79% | 0.064%(+0.724)#11 | 0.052%(+0.736)#211 |
| 12. | Baywood | 0.77% | 0.064%(+0.702)#12 | 0.052%(+0.713)#219 |
| 13. | Hagaman | 0.69% | 0.064%(+0.628)#13 | 0.052%(+0.640)#249 |
| 14. | Camillus | 0.68% | 0.064%(+0.620)#14 | 0.052%(+0.632)#255 |
| 15. | Hudson Falls | 0.66% | 0.064%(+0.596)#15 | 0.052%(+0.607)#261 |
| 16. | Laurel Hollow | 0.63% | 0.064%(+0.570)#16 | 0.052%(+0.582)#273 |
| 17. | Inwood | 0.63% | 0.064%(+0.564)#17 | 0.052%(+0.575)#276 |
| 18. | Shinnecock Hills | 0.61% | 0.064%(+0.545)#18 | 0.052%(+0.557)#286 |
| 19. | Lansing | 0.58% | 0.064%(+0.513)#19 | 0.052%(+0.524)#298 |
| 20. | Orange Lake | 0.58% | 0.064%(+0.513)#20 | 0.052%(+0.524)#299 |
| 21. | Loudonville | 0.56% | 0.064%(+0.496)#21 | 0.052%(+0.507)#311 |
| 22. | Suffern | 0.55% | 0.064%(+0.481)#22 | 0.052%(+0.493)#316 |
| 23. | Monticello | 0.54% | 0.064%(+0.476)#23 | 0.052%(+0.488)#319 |
| 24. | Morrisville | 0.52% | 0.064%(+0.461)#24 | 0.052%(+0.472)#325 |
| 25. | Hastings On Hudson | 0.52% | 0.064%(+0.457)#25 | 0.052%(+0.468)#329 |
| 26. | South Floral Park | 0.52% | 0.064%(+0.455)#26 | 0.052%(+0.466)#331 |
| 27. | Tuckahoe | 0.51% | 0.064%(+0.451)#27 | 0.052%(+0.462)#332 |
| 28. | Westhampton Beach | 0.51% | 0.064%(+0.448)#28 | 0.052%(+0.460)#334 |
| 29. | Albertson | 0.47% | 0.064%(+0.407)#29 | 0.052%(+0.419)#353 |
| 30. | Dolgeville | 0.46% | 0.064%(+0.395)#30 | 0.052%(+0.406)#361 |
| 31. | Bethpage | 0.45% | 0.064%(+0.388)#31 | 0.052%(+0.399)#366 |
| 32. | Yaphank | 0.45% | 0.064%(+0.386)#32 | 0.052%(+0.397)#367 |
| 33. | Orangeburg | 0.44% | 0.064%(+0.379)#33 | 0.052%(+0.390)#369 |
| 34. | Cold Spring | 0.43% | 0.064%(+0.370)#34 | 0.052%(+0.381)#384 |
| 35. | Watervliet | 0.43% | 0.064%(+0.362)#35 | 0.052%(+0.374)#394 |
| 36. | Suny Oswego | 0.42% | 0.064%(+0.356)#36 | 0.052%(+0.367)#400 |
| 37. | Norwich | 0.42% | 0.064%(+0.354)#37 | 0.052%(+0.365)#401 |
| 38. | Brentwood | 0.41% | 0.064%(+0.345)#38 | 0.052%(+0.357)#410 |
| 39. | Saratoga Springs | 0.38% | 0.064%(+0.315)#39 | 0.052%(+0.327)#437 |
| 40. | Upper Nyack | 0.37% | 0.064%(+0.310)#40 | 0.052%(+0.321)#447 |
| 41. | Amsterdam | 0.37% | 0.064%(+0.309)#41 | 0.052%(+0.320)#449 |
| 42. | Belle Terre | 0.37% | 0.064%(+0.306)#42 | 0.052%(+0.318)#451 |
| 43. | Huntington Station | 0.36% | 0.064%(+0.301)#43 | 0.052%(+0.312)#456 |
| 44. | Siena College | 0.35% | 0.064%(+0.285)#44 | 0.052%(+0.297)#476 |
| 45. | New Paltz | 0.34% | 0.064%(+0.273)#45 | 0.052%(+0.284)#486 |
| 46. | Arlington | 0.33% | 0.064%(+0.269)#46 | 0.052%(+0.280)#498 |
| 47. | Brinckerhoff | 0.32% | 0.064%(+0.254)#47 | 0.052%(+0.265)#518 |
| 48. | Stewart Manor | 0.31% | 0.064%(+0.248)#48 | 0.052%(+0.260)#527 |
| 49. | Westbury | 0.31% | 0.064%(+0.247)#49 | 0.052%(+0.258)#530 |
| 50. | Hyde Park | 0.31% | 0.064%(+0.242)#50 | 0.052%(+0.253)#536 |
| 51. | Freeport | 0.30% | 0.064%(+0.239)#51 | 0.052%(+0.251)#541 |
| 52. | Thiells | 0.27% | 0.064%(+0.204)#52 | 0.052%(+0.215)#593 |
| 53. | Hamilton | 0.26% | 0.064%(+0.194)#53 | 0.052%(+0.205)#609 |
| 54. | Franklinville | 0.25% | 0.064%(+0.182)#54 | 0.052%(+0.193)#630 |
| 55. | West Islip | 0.23% | 0.064%(+0.168)#55 | 0.052%(+0.179)#660 |
| 56. | Adams | 0.21% | 0.064%(+0.144)#56 | 0.052%(+0.156)#714 |
| 57. | Syosset | 0.21% | 0.064%(+0.144)#57 | 0.052%(+0.155)#717 |
| 58. | Rockville Centre | 0.21% | 0.064%(+0.142)#58 | 0.052%(+0.153)#723 |
| 59. | Island Park | 0.20% | 0.064%(+0.138)#59 | 0.052%(+0.150)#732 |
| 60. | South Huntington | 0.19% | 0.064%(+0.130)#60 | 0.052%(+0.142)#759 |
| 61. | Fairmount | 0.18% | 0.064%(+0.117)#61 | 0.052%(+0.128)#801 |
| 62. | Holbrook | 0.18% | 0.064%(+0.116)#62 | 0.052%(+0.128)#804 |
| 63. | East Quogue | 0.18% | 0.064%(+0.114)#63 | 0.052%(+0.126)#808 |
| 64. | Hempstead | 0.18% | 0.064%(+0.114)#64 | 0.052%(+0.125)#812 |
| 65. | Lawrence | 0.18% | 0.064%(+0.113)#65 | 0.052%(+0.125)#814 |
| 66. | Hamburg | 0.17% | 0.064%(+0.111)#66 | 0.052%(+0.122)#818 |
| 67. | Rotterdam | 0.17% | 0.064%(+0.108)#67 | 0.052%(+0.120)#825 |
| 68. | South Valley Stream | 0.15% | 0.064%(+0.089)#68 | 0.052%(+0.101)#883 |
| 69. | Port Chester | 0.14% | 0.064%(+0.074)#69 | 0.052%(+0.085)#945 |
| 70. | Commack | 0.14% | 0.064%(+0.073)#70 | 0.052%(+0.085)#946 |
| 71. | Stony Brook University | 0.13% | 0.064%(+0.062)#71 | 0.052%(+0.073)#988 |
| 72. | Bellmore | 0.13% | 0.064%(+0.062)#72 | 0.052%(+0.073)#990 |
| 73. | Voorheesville | 0.11% | 0.064%(+0.042)#73 | 0.052%(+0.053)#1,084 |
| 74. | Hicksville | 0.10% | 0.064%(+0.041)#74 | 0.052%(+0.052)#1,097 |
| 75. | Endwell | 0.10% | 0.064%(+0.038)#75 | 0.052%(+0.049)#1,112 |
| 76. | Terryville | 0.10% | 0.064%(+0.037)#76 | 0.052%(+0.049)#1,114 |
| 77. | University At Buffalo | 0.097% | 0.064%(+0.033)#77 | 0.052%(+0.045)#1,135 |
| 78. | White Plains | 0.096% | 0.064%(+0.032)#78 | 0.052%(+0.044)#1,141 |
| 79. | Mineola | 0.091% | 0.064%(+0.027)#79 | 0.052%(+0.038)#1,176 |
| 80. | Shirley | 0.091% | 0.064%(+0.027)#80 | 0.052%(+0.038)#1,179 |
| 81. | North Merrick | 0.090% | 0.064%(+0.027)#81 | 0.052%(+0.038)#1,180 |
| 82. | Wantagh | 0.089% | 0.064%(+0.025)#82 | 0.052%(+0.037)#1,189 |
| 83. | Scotchtown | 0.087% | 0.064%(+0.023)#83 | 0.052%(+0.035)#1,203 |
| 84. | Greece | 0.083% | 0.064%(+0.020)#84 | 0.052%(+0.031)#1,222 |
| 85. | Schenectady | 0.083% | 0.064%(+0.020)#85 | 0.052%(+0.031)#1,223 |
| 86. | Dix Hills | 0.081% | 0.064%(+0.017)#86 | 0.052%(+0.029)#1,237 |
| 87. | Irondequoit | 0.081% | 0.064%(+0.017)#87 | 0.052%(+0.028)#1,240 |
| 88. | Glen Cove | 0.078% | 0.064%(+0.015)#88 | 0.052%(+0.026)#1,255 |
| 89. | Garden City Park | 0.077% | 0.064%(+0.013)#89 | 0.052%(+0.025)#1,264 |
| 90. | New York | 0.077% | 0.064%(+0.013)#90 | 0.052%(+0.024)#1,266 |
| 91. | Lake Ronkonkoma | 0.076% | 0.064%(+0.013)#91 | 0.052%(+0.024)#1,270 |
| 92. | New Rochelle | 0.072% | 0.064%(+0.008)#92 | 0.052%(+0.019)#1,315 |
| 93. | Yonkers | 0.068% | 0.064%(+0.004)#93 | 0.052%(+0.015)#1,348 |
| 94. | Poughkeepsie | 0.066% | 0.064%(+0.003)#94 | 0.052%(+0.014)#1,356 |
| 95. | New Cassel | 0.066% | 0.064%(+0.002)#95 | 0.052%(+0.014)#1,357 |
| 96. | Long Beach | 0.060% | 0.064%(-0.003)#96 | 0.052%(+0.008)#1,403 |
| 97. | Syracuse | 0.059% | 0.064%(-0.005)#97 | 0.052%(+0.006)#1,413 |
| 98. | Kingston | 0.058% | 0.064%(-0.005)#98 | 0.052%(+0.006)#1,418 |
| 99. | Niskayuna | 0.058% | 0.064%(-0.006)#99 | 0.052%(+0.006)#1,419 |
| 100. | Medford | 0.057% | 0.064%(-0.007)#100 | 0.052%(+0.004)#1,428 |
Common Questions
What are the Top 10 Cities with the Highest Percentage of Costa Rican Population in New York?
Top 10 Cities with the Highest Percentage of Costa Rican Population in New York are:
#1
14.80%
#2
3.96%
#3
3.92%
#4
2.31%
#5
2.20%
#6
2.17%
#7
1.01%
#8
0.84%
#9
0.80%
#10
0.79%
What city has the Highest Percentage of Costa Rican Population in New York?
Northwest Harbor has the Highest Percentage of Costa Rican Population in New York with 14.80%.
What is the Percentage of Costa Rican Population in the State of New York?
Percentage of Costa Rican Population in New York is 0.064%.
What is the Percentage of Costa Rican Population in the United States?
Percentage of Costa Rican Population in the United States is 0.052%.