Cities with the Largest Mexican Community in Virginia
RELATED REPORTS & OPTIONS
Mexican
Virginia
Compare Cities
Map of Cities with the Largest Mexican Community in Virginia
0
15,000
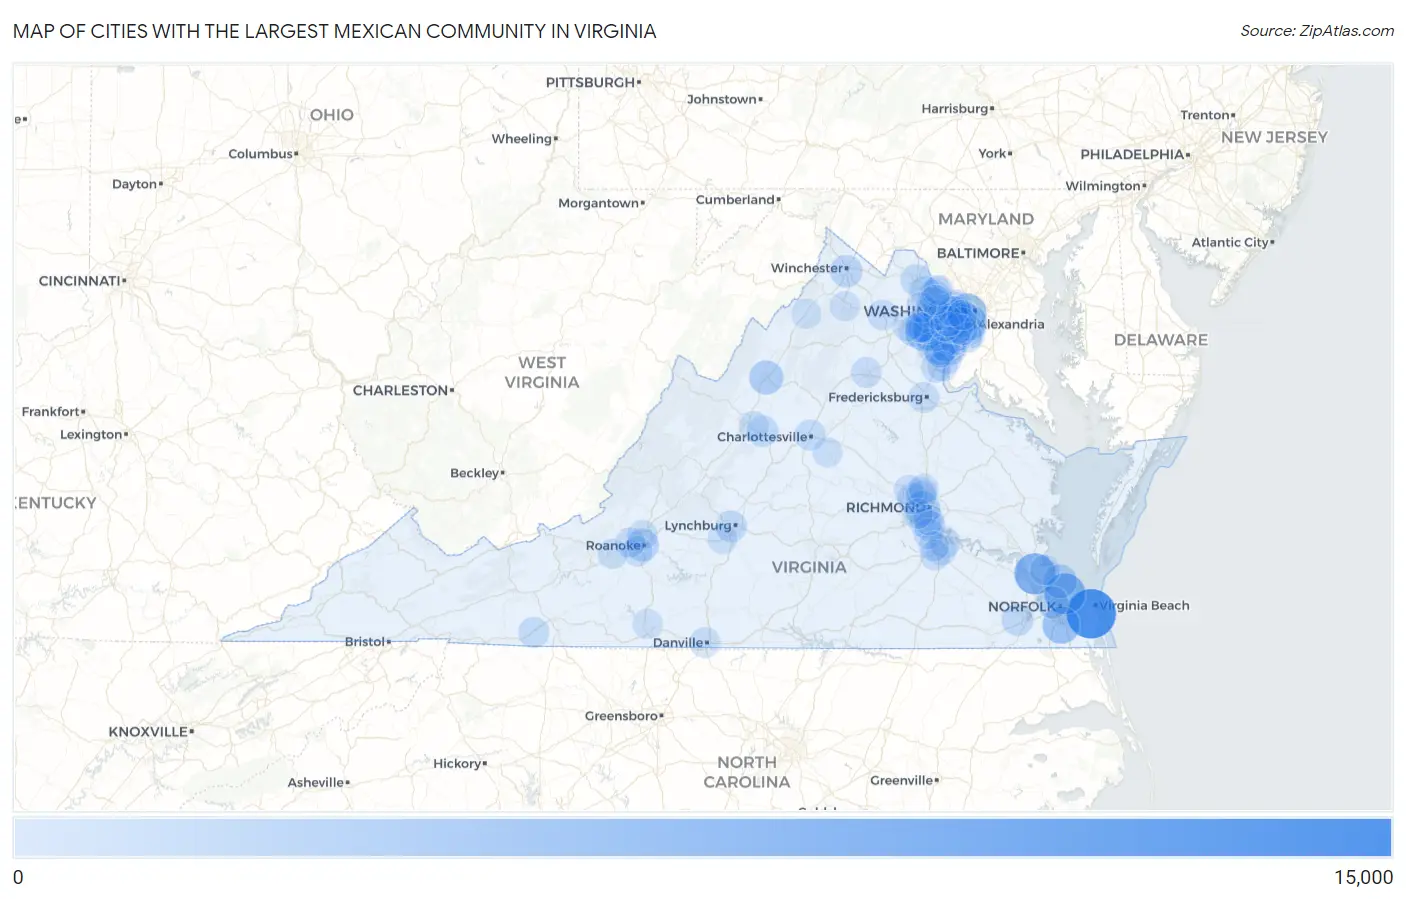
Cities with the Largest Mexican Community in Virginia
| City | Mexican | vs State | vs National | |
| 1. | Virginia Beach | 12,852 | 192,620(6.67%)#1 | 37,145,956(0.03%)#415 |
| 2. | Newport News | 7,263 | 192,620(3.77%)#2 | 37,145,956(0.02%)#698 |
| 3. | Norfolk | 7,208 | 192,620(3.74%)#3 | 37,145,956(0.02%)#703 |
| 4. | Arlington | 5,208 | 192,620(2.70%)#4 | 37,145,956(0.01%)#897 |
| 5. | Chesapeake | 4,941 | 192,620(2.57%)#5 | 37,145,956(0.01%)#934 |
| 6. | Manassas | 4,580 | 192,620(2.38%)#6 | 37,145,956(0.01%)#991 |
| 7. | Alexandria | 4,144 | 192,620(2.15%)#7 | 37,145,956(0.01%)#1,057 |
| 8. | Richmond | 3,463 | 192,620(1.80%)#8 | 37,145,956(0.01%)#1,217 |
| 9. | Dale City | 3,187 | 192,620(1.65%)#9 | 37,145,956(0.01%)#1,313 |
| 10. | Harrisonburg | 2,815 | 192,620(1.46%)#10 | 37,145,956(0.01%)#1,410 |
| 11. | Hampton | 2,681 | 192,620(1.39%)#11 | 37,145,956(0.01%)#1,459 |
| 12. | Roanoke | 1,926 | 192,620(1.00%)#12 | 37,145,956(0.01%)#1,874 |
| 13. | Woodbridge | 1,926 | 192,620(1.00%)#13 | 37,145,956(0.01%)#1,875 |
| 14. | Sudley | 1,821 | 192,620(0.95%)#14 | 37,145,956(0.00%)#1,923 |
| 15. | Winchester | 1,788 | 192,620(0.93%)#15 | 37,145,956(0.00%)#1,949 |
| 16. | Portsmouth | 1,617 | 192,620(0.84%)#16 | 37,145,956(0.00%)#2,079 |
| 17. | Suffolk | 1,372 | 192,620(0.71%)#17 | 37,145,956(0.00%)#2,318 |
| 18. | Leesburg | 1,225 | 192,620(0.64%)#18 | 37,145,956(0.00%)#2,471 |
| 19. | Tysons | 1,223 | 192,620(0.63%)#19 | 37,145,956(0.00%)#2,476 |
| 20. | Waynesboro | 1,191 | 192,620(0.62%)#20 | 37,145,956(0.00%)#2,516 |
| 21. | Annandale | 1,139 | 192,620(0.59%)#21 | 37,145,956(0.00%)#2,599 |
| 22. | Lynchburg | 1,123 | 192,620(0.58%)#22 | 37,145,956(0.00%)#2,618 |
| 23. | Lake Ridge | 1,075 | 192,620(0.56%)#23 | 37,145,956(0.00%)#2,712 |
| 24. | Buckhall | 998 | 192,620(0.52%)#24 | 37,145,956(0.00%)#2,837 |
| 25. | Galax | 961 | 192,620(0.50%)#25 | 37,145,956(0.00%)#2,903 |
| 26. | West Falls Church | 947 | 192,620(0.49%)#26 | 37,145,956(0.00%)#2,926 |
| 27. | Yorkshire | 918 | 192,620(0.48%)#27 | 37,145,956(0.00%)#2,976 |
| 28. | Charlottesville | 887 | 192,620(0.46%)#28 | 37,145,956(0.00%)#3,038 |
| 29. | Hybla Valley | 876 | 192,620(0.45%)#29 | 37,145,956(0.00%)#3,061 |
| 30. | Linton Hall | 875 | 192,620(0.45%)#30 | 37,145,956(0.00%)#3,064 |
| 31. | Meadowbrook | 871 | 192,620(0.45%)#31 | 37,145,956(0.00%)#3,073 |
| 32. | Reston | 823 | 192,620(0.43%)#32 | 37,145,956(0.00%)#3,182 |
| 33. | Fredericksburg | 815 | 192,620(0.42%)#33 | 37,145,956(0.00%)#3,206 |
| 34. | Hopewell | 813 | 192,620(0.42%)#34 | 37,145,956(0.00%)#3,208 |
| 35. | Danville | 795 | 192,620(0.41%)#35 | 37,145,956(0.00%)#3,242 |
| 36. | Sterling | 795 | 192,620(0.41%)#36 | 37,145,956(0.00%)#3,243 |
| 37. | Fort Lee | 766 | 192,620(0.40%)#37 | 37,145,956(0.00%)#3,325 |
| 38. | Mclean | 755 | 192,620(0.39%)#38 | 37,145,956(0.00%)#3,359 |
| 39. | Bellwood | 746 | 192,620(0.39%)#39 | 37,145,956(0.00%)#3,383 |
| 40. | Culpeper | 722 | 192,620(0.37%)#40 | 37,145,956(0.00%)#3,455 |
| 41. | Ashburn | 712 | 192,620(0.37%)#41 | 37,145,956(0.00%)#3,474 |
| 42. | Burke | 712 | 192,620(0.37%)#42 | 37,145,956(0.00%)#3,475 |
| 43. | West Springfield | 700 | 192,620(0.36%)#43 | 37,145,956(0.00%)#3,503 |
| 44. | Centreville | 685 | 192,620(0.36%)#44 | 37,145,956(0.00%)#3,544 |
| 45. | Tuckahoe | 680 | 192,620(0.35%)#45 | 37,145,956(0.00%)#3,563 |
| 46. | Groveton | 672 | 192,620(0.35%)#46 | 37,145,956(0.00%)#3,588 |
| 47. | Independent Hill | 670 | 192,620(0.35%)#47 | 37,145,956(0.00%)#3,602 |
| 48. | Manassas Park | 654 | 192,620(0.34%)#48 | 37,145,956(0.00%)#3,656 |
| 49. | Dumbarton | 641 | 192,620(0.33%)#49 | 37,145,956(0.00%)#3,702 |
| 50. | Bailey S Crossroads | 634 | 192,620(0.33%)#50 | 37,145,956(0.00%)#3,723 |
| 51. | Chantilly | 623 | 192,620(0.32%)#51 | 37,145,956(0.00%)#3,765 |
| 52. | Marshall | 623 | 192,620(0.32%)#52 | 37,145,956(0.00%)#3,766 |
| 53. | Chester | 622 | 192,620(0.32%)#53 | 37,145,956(0.00%)#3,768 |
| 54. | Fairfax | 620 | 192,620(0.32%)#54 | 37,145,956(0.00%)#3,775 |
| 55. | Laurel | 614 | 192,620(0.32%)#55 | 37,145,956(0.00%)#3,798 |
| 56. | Oakton | 577 | 192,620(0.30%)#56 | 37,145,956(0.00%)#3,946 |
| 57. | Cherry Hill | 571 | 192,620(0.30%)#57 | 37,145,956(0.00%)#3,964 |
| 58. | Loch Lomond | 569 | 192,620(0.30%)#58 | 37,145,956(0.00%)#3,971 |
| 59. | Boswell S Corner | 568 | 192,620(0.29%)#59 | 37,145,956(0.00%)#3,978 |
| 60. | Idylwood | 560 | 192,620(0.29%)#60 | 37,145,956(0.00%)#4,011 |
| 61. | Mount Vernon | 553 | 192,620(0.29%)#61 | 37,145,956(0.00%)#4,039 |
| 62. | Bensley | 543 | 192,620(0.28%)#62 | 37,145,956(0.00%)#4,083 |
| 63. | Mcnair | 540 | 192,620(0.28%)#63 | 37,145,956(0.00%)#4,096 |
| 64. | Petersburg | 528 | 192,620(0.27%)#64 | 37,145,956(0.00%)#4,147 |
| 65. | Fair Oaks | 510 | 192,620(0.26%)#65 | 37,145,956(0.00%)#4,220 |
| 66. | Potomac Mills | 504 | 192,620(0.26%)#66 | 37,145,956(0.00%)#4,254 |
| 67. | Lincolnia | 492 | 192,620(0.26%)#67 | 37,145,956(0.00%)#4,306 |
| 68. | Short Pump | 490 | 192,620(0.25%)#68 | 37,145,956(0.00%)#4,312 |
| 69. | Lorton | 490 | 192,620(0.25%)#69 | 37,145,956(0.00%)#4,313 |
| 70. | Rose Hill Cdp Fairfax County | 487 | 192,620(0.25%)#70 | 37,145,956(0.00%)#4,331 |
| 71. | Quantico Base | 486 | 192,620(0.25%)#71 | 37,145,956(0.00%)#4,338 |
| 72. | Hollins | 477 | 192,620(0.25%)#72 | 37,145,956(0.00%)#4,390 |
| 73. | Cave Spring | 463 | 192,620(0.24%)#73 | 37,145,956(0.00%)#4,449 |
| 74. | Bethel Manor | 449 | 192,620(0.23%)#74 | 37,145,956(0.00%)#4,527 |
| 75. | Kingstowne | 442 | 192,620(0.23%)#75 | 37,145,956(0.00%)#4,561 |
| 76. | Fishersville | 435 | 192,620(0.23%)#76 | 37,145,956(0.00%)#4,610 |
| 77. | South Riding | 432 | 192,620(0.22%)#77 | 37,145,956(0.00%)#4,636 |
| 78. | Manchester | 425 | 192,620(0.22%)#78 | 37,145,956(0.00%)#4,677 |
| 79. | Front Royal | 418 | 192,620(0.22%)#79 | 37,145,956(0.00%)#4,730 |
| 80. | Salem | 414 | 192,620(0.21%)#80 | 37,145,956(0.00%)#4,751 |
| 81. | Bull Run | 413 | 192,620(0.21%)#81 | 37,145,956(0.00%)#4,759 |
| 82. | Leesylvania | 410 | 192,620(0.21%)#82 | 37,145,956(0.00%)#4,771 |
| 83. | Timberlake | 408 | 192,620(0.21%)#83 | 37,145,956(0.00%)#4,786 |
| 84. | Sugarland Run | 394 | 192,620(0.20%)#84 | 37,145,956(0.00%)#4,892 |
| 85. | Collinsville | 389 | 192,620(0.20%)#85 | 37,145,956(0.00%)#4,927 |
| 86. | Gainesville | 385 | 192,620(0.20%)#86 | 37,145,956(0.00%)#4,951 |
| 87. | Woodstock | 381 | 192,620(0.20%)#87 | 37,145,956(0.00%)#4,978 |
| 88. | Elliston | 373 | 192,620(0.19%)#88 | 37,145,956(0.00%)#5,041 |
| 89. | Glen Allen | 368 | 192,620(0.19%)#89 | 37,145,956(0.00%)#5,064 |
| 90. | Lake Monticello | 363 | 192,620(0.19%)#90 | 37,145,956(0.00%)#5,095 |
| 91. | Montclair | 357 | 192,620(0.19%)#91 | 37,145,956(0.00%)#5,138 |
| 92. | Colonial Heights | 343 | 192,620(0.18%)#92 | 37,145,956(0.00%)#5,239 |
| 93. | Springfield | 335 | 192,620(0.17%)#93 | 37,145,956(0.00%)#5,294 |
| 94. | Burke Centre | 335 | 192,620(0.17%)#94 | 37,145,956(0.00%)#5,295 |
| 95. | Dunn Loring | 317 | 192,620(0.16%)#95 | 37,145,956(0.00%)#5,444 |
| 96. | Lowes Island | 315 | 192,620(0.16%)#96 | 37,145,956(0.00%)#5,455 |
| 97. | Long Branch | 315 | 192,620(0.16%)#97 | 37,145,956(0.00%)#5,457 |
| 98. | Herndon | 311 | 192,620(0.16%)#98 | 37,145,956(0.00%)#5,490 |
| 99. | Seven Corners | 309 | 192,620(0.16%)#99 | 37,145,956(0.00%)#5,510 |
| 100. | Midlothian | 303 | 192,620(0.16%)#100 | 37,145,956(0.00%)#5,555 |
Common Questions
What are the Top 10 Cities with the Largest Mexican Community in Virginia?
Top 10 Cities with the Largest Mexican Community in Virginia are:
#1
12,852
#2
7,263
#3
7,208
#4
5,208
#5
4,941
#6
4,580
#7
4,144
#8
3,463
#9
3,187
#10
2,815
What city has the Largest Mexican Community in Virginia?
Virginia Beach has the Largest Mexican Community in Virginia with 12,852.
What is the Total Mexican Population in the State of Virginia?
Total Mexican Population in Virginia is 192,620.
What is the Total Mexican Population in the United States?
Total Mexican Population in the United States is 37,145,956.