Cities with the Largest Mexican Community in Ohio
RELATED REPORTS & OPTIONS
Mexican
Ohio
Compare Cities
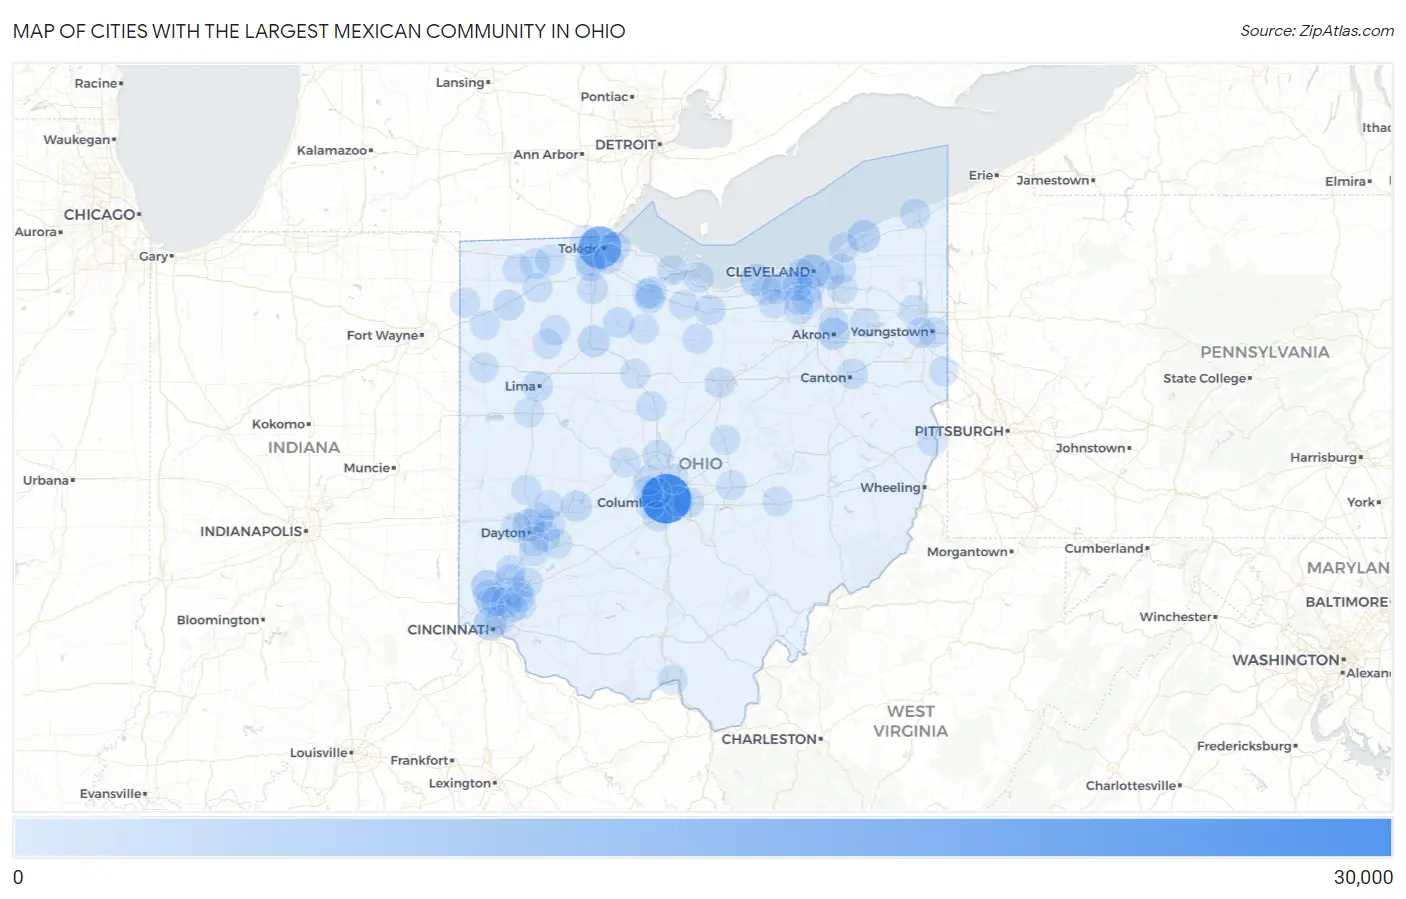
Map of Cities with the Largest Mexican Community in Ohio
0
30,000
Cities with the Largest Mexican Community in Ohio
| City | Mexican | vs State | vs National | |
| 1. | Columbus | 28,283 | 215,287(13.14%)#1 | 37,145,956(0.08%)#190 |
| 2. | Toledo | 17,839 | 215,287(8.29%)#2 | 37,145,956(0.05%)#306 |
| 3. | Cleveland | 5,718 | 215,287(2.66%)#3 | 37,145,956(0.02%)#836 |
| 4. | Painesville | 4,084 | 215,287(1.90%)#4 | 37,145,956(0.01%)#1,066 |
| 5. | Hamilton | 4,012 | 215,287(1.86%)#5 | 37,145,956(0.01%)#1,082 |
| 6. | Cincinnati | 3,898 | 215,287(1.81%)#6 | 37,145,956(0.01%)#1,113 |
| 7. | Akron | 3,314 | 215,287(1.54%)#7 | 37,145,956(0.01%)#1,269 |
| 8. | Lorain | 3,257 | 215,287(1.51%)#8 | 37,145,956(0.01%)#1,287 |
| 9. | Dayton | 3,042 | 215,287(1.41%)#9 | 37,145,956(0.01%)#1,347 |
| 10. | Findlay | 2,830 | 215,287(1.31%)#10 | 37,145,956(0.01%)#1,403 |
| 11. | Springfield | 2,090 | 215,287(0.97%)#11 | 37,145,956(0.01%)#1,763 |
| 12. | Fremont | 2,060 | 215,287(0.96%)#12 | 37,145,956(0.01%)#1,780 |
| 13. | Defiance | 1,771 | 215,287(0.82%)#13 | 37,145,956(0.00%)#1,963 |
| 14. | Fairfield | 1,699 | 215,287(0.79%)#14 | 37,145,956(0.00%)#2,009 |
| 15. | Fostoria | 1,605 | 215,287(0.75%)#15 | 37,145,956(0.00%)#2,084 |
| 16. | Oregon | 1,604 | 215,287(0.75%)#16 | 37,145,956(0.00%)#2,085 |
| 17. | Lima | 1,488 | 215,287(0.69%)#17 | 37,145,956(0.00%)#2,201 |
| 18. | Reynoldsburg | 1,395 | 215,287(0.65%)#18 | 37,145,956(0.00%)#2,297 |
| 19. | Bowling Green | 1,305 | 215,287(0.61%)#19 | 37,145,956(0.00%)#2,383 |
| 20. | Norwalk | 1,126 | 215,287(0.52%)#20 | 37,145,956(0.00%)#2,611 |
| 21. | Canton | 1,073 | 215,287(0.50%)#21 | 37,145,956(0.00%)#2,715 |
| 22. | Whitehall | 1,056 | 215,287(0.49%)#22 | 37,145,956(0.00%)#2,743 |
| 23. | Forest Park | 982 | 215,287(0.46%)#23 | 37,145,956(0.00%)#2,867 |
| 24. | Wauseon | 951 | 215,287(0.44%)#24 | 37,145,956(0.00%)#2,921 |
| 25. | North Olmsted | 930 | 215,287(0.43%)#25 | 37,145,956(0.00%)#2,954 |
| 26. | Fairborn | 905 | 215,287(0.42%)#26 | 37,145,956(0.00%)#2,997 |
| 27. | Sandusky | 864 | 215,287(0.40%)#27 | 37,145,956(0.00%)#3,085 |
| 28. | Willard | 846 | 215,287(0.39%)#28 | 37,145,956(0.00%)#3,129 |
| 29. | Sharonville | 842 | 215,287(0.39%)#29 | 37,145,956(0.00%)#3,135 |
| 30. | Youngstown | 841 | 215,287(0.39%)#30 | 37,145,956(0.00%)#3,138 |
| 31. | Lincoln Village | 838 | 215,287(0.39%)#31 | 37,145,956(0.00%)#3,144 |
| 32. | Parma | 809 | 215,287(0.38%)#32 | 37,145,956(0.00%)#3,214 |
| 33. | Marion | 808 | 215,287(0.38%)#33 | 37,145,956(0.00%)#3,215 |
| 34. | Elyria | 781 | 215,287(0.36%)#34 | 37,145,956(0.00%)#3,286 |
| 35. | Dublin | 763 | 215,287(0.35%)#35 | 37,145,956(0.00%)#3,335 |
| 36. | Leipsic | 753 | 215,287(0.35%)#36 | 37,145,956(0.00%)#3,366 |
| 37. | Ashtabula | 735 | 215,287(0.34%)#37 | 37,145,956(0.00%)#3,414 |
| 38. | Mason | 725 | 215,287(0.34%)#38 | 37,145,956(0.00%)#3,448 |
| 39. | Beavercreek | 681 | 215,287(0.32%)#39 | 37,145,956(0.00%)#3,559 |
| 40. | Perrysburg | 673 | 215,287(0.31%)#40 | 37,145,956(0.00%)#3,580 |
| 41. | Middletown | 672 | 215,287(0.31%)#41 | 37,145,956(0.00%)#3,587 |
| 42. | North Royalton | 656 | 215,287(0.30%)#42 | 37,145,956(0.00%)#3,648 |
| 43. | Delaware | 644 | 215,287(0.30%)#43 | 37,145,956(0.00%)#3,687 |
| 44. | Maumee | 641 | 215,287(0.30%)#44 | 37,145,956(0.00%)#3,700 |
| 45. | Mansfield | 632 | 215,287(0.29%)#45 | 37,145,956(0.00%)#3,727 |
| 46. | Austintown | 625 | 215,287(0.29%)#46 | 37,145,956(0.00%)#3,756 |
| 47. | Huber Heights | 621 | 215,287(0.29%)#47 | 37,145,956(0.00%)#3,771 |
| 48. | Troy | 611 | 215,287(0.28%)#48 | 37,145,956(0.00%)#3,808 |
| 49. | Norwood | 605 | 215,287(0.28%)#49 | 37,145,956(0.00%)#3,829 |
| 50. | Upper Arlington | 592 | 215,287(0.27%)#50 | 37,145,956(0.00%)#3,879 |
| 51. | Lakewood | 580 | 215,287(0.27%)#51 | 37,145,956(0.00%)#3,937 |
| 52. | Hilliard | 566 | 215,287(0.26%)#52 | 37,145,956(0.00%)#3,982 |
| 53. | Marysville | 561 | 215,287(0.26%)#53 | 37,145,956(0.00%)#4,007 |
| 54. | Grove City | 541 | 215,287(0.25%)#54 | 37,145,956(0.00%)#4,091 |
| 55. | Kettering | 530 | 215,287(0.25%)#55 | 37,145,956(0.00%)#4,135 |
| 56. | North Ridgeville | 509 | 215,287(0.24%)#56 | 37,145,956(0.00%)#4,221 |
| 57. | Solon | 496 | 215,287(0.23%)#57 | 37,145,956(0.00%)#4,291 |
| 58. | Van Wert | 485 | 215,287(0.23%)#58 | 37,145,956(0.00%)#4,342 |
| 59. | Archbold | 482 | 215,287(0.22%)#59 | 37,145,956(0.00%)#4,367 |
| 60. | Napoleon | 473 | 215,287(0.22%)#60 | 37,145,956(0.00%)#4,403 |
| 61. | Loveland | 462 | 215,287(0.21%)#61 | 37,145,956(0.00%)#4,455 |
| 62. | Tiffin | 448 | 215,287(0.21%)#62 | 37,145,956(0.00%)#4,530 |
| 63. | Xenia | 445 | 215,287(0.21%)#63 | 37,145,956(0.00%)#4,548 |
| 64. | Bellevue | 440 | 215,287(0.20%)#64 | 37,145,956(0.00%)#4,576 |
| 65. | Port Clinton | 434 | 215,287(0.20%)#65 | 37,145,956(0.00%)#4,622 |
| 66. | Ottawa | 434 | 215,287(0.20%)#66 | 37,145,956(0.00%)#4,623 |
| 67. | Mayfield Heights | 424 | 215,287(0.20%)#67 | 37,145,956(0.00%)#4,684 |
| 68. | Ravenna | 424 | 215,287(0.20%)#68 | 37,145,956(0.00%)#4,685 |
| 69. | Zanesville | 422 | 215,287(0.20%)#69 | 37,145,956(0.00%)#4,698 |
| 70. | Centerville | 417 | 215,287(0.19%)#70 | 37,145,956(0.00%)#4,737 |
| 71. | Delta | 417 | 215,287(0.19%)#71 | 37,145,956(0.00%)#4,741 |
| 72. | Monroe | 414 | 215,287(0.19%)#72 | 37,145,956(0.00%)#4,753 |
| 73. | Walbridge | 410 | 215,287(0.19%)#73 | 37,145,956(0.00%)#4,772 |
| 74. | Landen | 408 | 215,287(0.19%)#74 | 37,145,956(0.00%)#4,789 |
| 75. | Upper Sandusky | 408 | 215,287(0.19%)#75 | 37,145,956(0.00%)#4,790 |
| 76. | Springdale | 404 | 215,287(0.19%)#76 | 37,145,956(0.00%)#4,819 |
| 77. | Steubenville | 402 | 215,287(0.19%)#77 | 37,145,956(0.00%)#4,830 |
| 78. | Mount Vernon | 399 | 215,287(0.19%)#78 | 37,145,956(0.00%)#4,851 |
| 79. | East Palestine | 399 | 215,287(0.19%)#79 | 37,145,956(0.00%)#4,855 |
| 80. | Cuyahoga Falls | 398 | 215,287(0.18%)#80 | 37,145,956(0.00%)#4,863 |
| 81. | Stony Prairie | 398 | 215,287(0.18%)#81 | 37,145,956(0.00%)#4,869 |
| 82. | Grafton | 397 | 215,287(0.18%)#82 | 37,145,956(0.00%)#4,873 |
| 83. | Montgomery | 390 | 215,287(0.18%)#83 | 37,145,956(0.00%)#4,916 |
| 84. | Wapakoneta | 388 | 215,287(0.18%)#84 | 37,145,956(0.00%)#4,935 |
| 85. | Sylvania | 384 | 215,287(0.18%)#85 | 37,145,956(0.00%)#4,957 |
| 86. | Westerville | 383 | 215,287(0.18%)#86 | 37,145,956(0.00%)#4,962 |
| 87. | Paulding | 380 | 215,287(0.18%)#87 | 37,145,956(0.00%)#4,980 |
| 88. | New Carlisle | 378 | 215,287(0.18%)#88 | 37,145,956(0.00%)#4,995 |
| 89. | Lebanon | 375 | 215,287(0.17%)#89 | 37,145,956(0.00%)#5,020 |
| 90. | Shaker Heights | 371 | 215,287(0.17%)#90 | 37,145,956(0.00%)#5,048 |
| 91. | Brunswick | 365 | 215,287(0.17%)#91 | 37,145,956(0.00%)#5,082 |
| 92. | Brook Park | 363 | 215,287(0.17%)#92 | 37,145,956(0.00%)#5,093 |
| 93. | Eastlake | 355 | 215,287(0.16%)#93 | 37,145,956(0.00%)#5,151 |
| 94. | Newark | 353 | 215,287(0.16%)#94 | 37,145,956(0.00%)#5,168 |
| 95. | Portsmouth | 349 | 215,287(0.16%)#95 | 37,145,956(0.00%)#5,189 |
| 96. | Ballville | 345 | 215,287(0.16%)#96 | 37,145,956(0.00%)#5,226 |
| 97. | Strongsville | 336 | 215,287(0.16%)#97 | 37,145,956(0.00%)#5,290 |
| 98. | Hicksville | 332 | 215,287(0.15%)#98 | 37,145,956(0.00%)#5,320 |
| 99. | Trotwood | 329 | 215,287(0.15%)#99 | 37,145,956(0.00%)#5,345 |
| 100. | Warren | 328 | 215,287(0.15%)#100 | 37,145,956(0.00%)#5,355 |
Common Questions
What are the Top 10 Cities with the Largest Mexican Community in Ohio?
Top 10 Cities with the Largest Mexican Community in Ohio are:
#1
28,283
#2
17,839
#3
5,718
#4
4,084
#5
4,012
#6
3,898
#7
3,314
#8
3,257
#9
3,042
#10
2,830
What city has the Largest Mexican Community in Ohio?
Columbus has the Largest Mexican Community in Ohio with 28,283.
What is the Total Mexican Population in the State of Ohio?
Total Mexican Population in Ohio is 215,287.
What is the Total Mexican Population in the United States?
Total Mexican Population in the United States is 37,145,956.