Cities with the Largest Mexican Community in Kentucky
RELATED REPORTS & OPTIONS
Mexican
Kentucky
Compare Cities
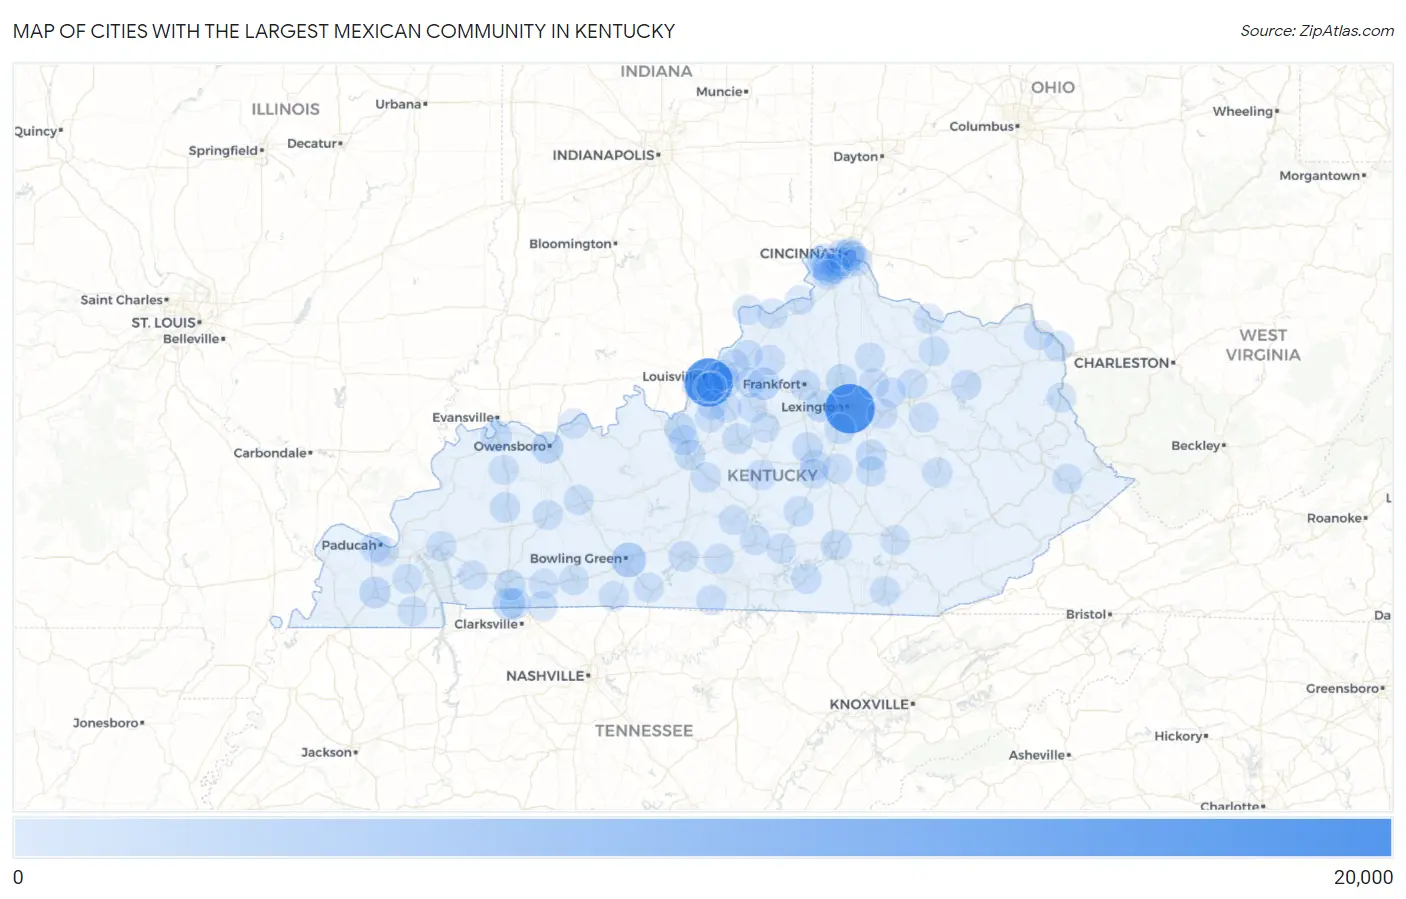
Map of Cities with the Largest Mexican Community in Kentucky
0
20,000
Cities with the Largest Mexican Community in Kentucky
| City | Mexican | vs State | vs National | |
| 1. | Lexington | 15,655 | 93,527(16.74%)#1 | 37,145,956(0.04%)#340 |
| 2. | Louisville | 14,693 | 93,527(15.71%)#2 | 37,145,956(0.04%)#363 |
| 3. | Bowling Green | 3,561 | 93,527(3.81%)#3 | 37,145,956(0.01%)#1,192 |
| 4. | Fort Campbell North | 1,776 | 93,527(1.90%)#4 | 37,145,956(0.00%)#1,959 |
| 5. | Shelbyville | 1,755 | 93,527(1.88%)#5 | 37,145,956(0.00%)#1,975 |
| 6. | Owensboro | 1,520 | 93,527(1.63%)#6 | 37,145,956(0.00%)#2,176 |
| 7. | Versailles | 1,301 | 93,527(1.39%)#7 | 37,145,956(0.00%)#2,386 |
| 8. | Mayfield | 1,284 | 93,527(1.37%)#8 | 37,145,956(0.00%)#2,407 |
| 9. | Florence | 1,208 | 93,527(1.29%)#9 | 37,145,956(0.00%)#2,492 |
| 10. | Fort Knox | 1,167 | 93,527(1.25%)#10 | 37,145,956(0.00%)#2,556 |
| 11. | Georgetown | 1,163 | 93,527(1.24%)#11 | 37,145,956(0.00%)#2,559 |
| 12. | Henderson | 891 | 93,527(0.95%)#12 | 37,145,956(0.00%)#3,028 |
| 13. | Richmond | 758 | 93,527(0.81%)#13 | 37,145,956(0.00%)#3,347 |
| 14. | Oak Grove | 754 | 93,527(0.81%)#14 | 37,145,956(0.00%)#3,363 |
| 15. | Hopkinsville | 745 | 93,527(0.80%)#15 | 37,145,956(0.00%)#3,386 |
| 16. | Elizabethtown | 728 | 93,527(0.78%)#16 | 37,145,956(0.00%)#3,438 |
| 17. | Nicholasville | 705 | 93,527(0.75%)#17 | 37,145,956(0.00%)#3,487 |
| 18. | Covington | 655 | 93,527(0.70%)#18 | 37,145,956(0.00%)#3,650 |
| 19. | Glasgow | 653 | 93,527(0.70%)#19 | 37,145,956(0.00%)#3,659 |
| 20. | Bardstown | 610 | 93,527(0.65%)#20 | 37,145,956(0.00%)#3,812 |
| 21. | Frankfort | 609 | 93,527(0.65%)#21 | 37,145,956(0.00%)#3,815 |
| 22. | Ashland | 547 | 93,527(0.58%)#22 | 37,145,956(0.00%)#4,065 |
| 23. | Jeffersontown | 545 | 93,527(0.58%)#23 | 37,145,956(0.00%)#4,074 |
| 24. | Somerset | 542 | 93,527(0.58%)#24 | 37,145,956(0.00%)#4,087 |
| 25. | Crestwood | 528 | 93,527(0.56%)#25 | 37,145,956(0.00%)#4,149 |
| 26. | Danville | 516 | 93,527(0.55%)#26 | 37,145,956(0.00%)#4,196 |
| 27. | Harrodsburg | 484 | 93,527(0.52%)#27 | 37,145,956(0.00%)#4,351 |
| 28. | Madisonville | 478 | 93,527(0.51%)#28 | 37,145,956(0.00%)#4,386 |
| 29. | Radcliff | 459 | 93,527(0.49%)#29 | 37,145,956(0.00%)#4,476 |
| 30. | Paducah | 450 | 93,527(0.48%)#30 | 37,145,956(0.00%)#4,515 |
| 31. | Carrollton | 450 | 93,527(0.48%)#31 | 37,145,956(0.00%)#4,522 |
| 32. | Hebron | 422 | 93,527(0.45%)#32 | 37,145,956(0.00%)#4,705 |
| 33. | Lyndon | 418 | 93,527(0.45%)#33 | 37,145,956(0.00%)#4,731 |
| 34. | Shively | 416 | 93,527(0.44%)#34 | 37,145,956(0.00%)#4,742 |
| 35. | Burlington | 390 | 93,527(0.42%)#35 | 37,145,956(0.00%)#4,914 |
| 36. | Paris | 375 | 93,527(0.40%)#36 | 37,145,956(0.00%)#5,021 |
| 37. | Monticello | 372 | 93,527(0.40%)#37 | 37,145,956(0.00%)#5,045 |
| 38. | Lebanon | 339 | 93,527(0.36%)#38 | 37,145,956(0.00%)#5,269 |
| 39. | Winchester | 311 | 93,527(0.33%)#39 | 37,145,956(0.00%)#5,491 |
| 40. | Newport | 281 | 93,527(0.30%)#40 | 37,145,956(0.00%)#5,772 |
| 41. | Beaver Dam | 270 | 93,527(0.29%)#41 | 37,145,956(0.00%)#5,877 |
| 42. | Eminence | 260 | 93,527(0.28%)#42 | 37,145,956(0.00%)#5,981 |
| 43. | Hodgenville | 258 | 93,527(0.28%)#43 | 37,145,956(0.00%)#5,997 |
| 44. | Morehead | 255 | 93,527(0.27%)#44 | 37,145,956(0.00%)#6,031 |
| 45. | La Grange | 253 | 93,527(0.27%)#45 | 37,145,956(0.00%)#6,056 |
| 46. | Columbia | 251 | 93,527(0.27%)#46 | 37,145,956(0.00%)#6,083 |
| 47. | Fort Mitchell | 246 | 93,527(0.26%)#47 | 37,145,956(0.00%)#6,137 |
| 48. | Mount Washington | 243 | 93,527(0.26%)#48 | 37,145,956(0.00%)#6,173 |
| 49. | Erlanger | 235 | 93,527(0.25%)#49 | 37,145,956(0.00%)#6,267 |
| 50. | Simpsonville | 230 | 93,527(0.25%)#50 | 37,145,956(0.00%)#6,338 |
| 51. | St Matthews | 228 | 93,527(0.24%)#51 | 37,145,956(0.00%)#6,357 |
| 52. | Liberty | 224 | 93,527(0.24%)#52 | 37,145,956(0.00%)#6,421 |
| 53. | Berea | 214 | 93,527(0.23%)#53 | 37,145,956(0.00%)#6,556 |
| 54. | Flemingsburg | 213 | 93,527(0.23%)#54 | 37,145,956(0.00%)#6,588 |
| 55. | Ludlow | 207 | 93,527(0.22%)#55 | 37,145,956(0.00%)#6,677 |
| 56. | Russellville | 204 | 93,527(0.22%)#56 | 37,145,956(0.00%)#6,715 |
| 57. | Franklin | 187 | 93,527(0.20%)#57 | 37,145,956(0.00%)#6,969 |
| 58. | Murray | 177 | 93,527(0.19%)#58 | 37,145,956(0.00%)#7,134 |
| 59. | Shepherdsville | 170 | 93,527(0.18%)#59 | 37,145,956(0.00%)#7,251 |
| 60. | Hillview | 159 | 93,527(0.17%)#60 | 37,145,956(0.00%)#7,452 |
| 61. | Bellevue | 152 | 93,527(0.16%)#61 | 37,145,956(0.00%)#7,574 |
| 62. | Louisa | 147 | 93,527(0.16%)#62 | 37,145,956(0.00%)#7,693 |
| 63. | Fort Thomas | 145 | 93,527(0.16%)#63 | 37,145,956(0.00%)#7,717 |
| 64. | Elkton | 141 | 93,527(0.15%)#64 | 37,145,956(0.00%)#7,829 |
| 65. | Central City | 140 | 93,527(0.15%)#65 | 37,145,956(0.00%)#7,843 |
| 66. | Lancaster | 140 | 93,527(0.15%)#66 | 37,145,956(0.00%)#7,844 |
| 67. | Williamsburg | 138 | 93,527(0.15%)#67 | 37,145,956(0.00%)#7,881 |
| 68. | Tompkinsville | 135 | 93,527(0.14%)#68 | 37,145,956(0.00%)#7,959 |
| 69. | Guthrie | 129 | 93,527(0.14%)#69 | 37,145,956(0.00%)#8,105 |
| 70. | Coal Run Village | 125 | 93,527(0.13%)#70 | 37,145,956(0.00%)#8,215 |
| 71. | Warsaw | 123 | 93,527(0.13%)#71 | 37,145,956(0.00%)#8,265 |
| 72. | Junction City | 123 | 93,527(0.13%)#72 | 37,145,956(0.00%)#8,266 |
| 73. | Poplar Hills | 123 | 93,527(0.13%)#73 | 37,145,956(0.00%)#8,271 |
| 74. | Sharpsburg | 123 | 93,527(0.13%)#74 | 37,145,956(0.00%)#8,273 |
| 75. | Elsmere | 119 | 93,527(0.13%)#75 | 37,145,956(0.00%)#8,373 |
| 76. | Eddyville | 115 | 93,527(0.12%)#76 | 37,145,956(0.00%)#8,502 |
| 77. | Watterson Park | 113 | 93,527(0.12%)#77 | 37,145,956(0.00%)#8,561 |
| 78. | Oakbrook | 109 | 93,527(0.12%)#78 | 37,145,956(0.00%)#8,672 |
| 79. | Scottsville | 109 | 93,527(0.12%)#79 | 37,145,956(0.00%)#8,682 |
| 80. | Beattyville | 109 | 93,527(0.12%)#80 | 37,145,956(0.00%)#8,690 |
| 81. | Maysville | 108 | 93,527(0.12%)#81 | 37,145,956(0.00%)#8,718 |
| 82. | Cynthiana | 108 | 93,527(0.12%)#82 | 37,145,956(0.00%)#8,721 |
| 83. | Cadiz | 107 | 93,527(0.11%)#83 | 37,145,956(0.00%)#8,758 |
| 84. | Farley | 105 | 93,527(0.11%)#84 | 37,145,956(0.00%)#8,798 |
| 85. | Greensburg | 100 | 93,527(0.11%)#85 | 37,145,956(0.00%)#8,940 |
| 86. | Edmonton | 99 | 93,527(0.11%)#86 | 37,145,956(0.00%)#8,980 |
| 87. | North Middletown | 98 | 93,527(0.10%)#87 | 37,145,956(0.00%)#9,013 |
| 88. | Benton | 93 | 93,527(0.10%)#88 | 37,145,956(0.00%)#9,170 |
| 89. | Union | 90 | 93,527(0.10%)#89 | 37,145,956(0.00%)#9,267 |
| 90. | Jeffersonville | 90 | 93,527(0.10%)#90 | 37,145,956(0.00%)#9,284 |
| 91. | Sebree | 89 | 93,527(0.10%)#91 | 37,145,956(0.00%)#9,321 |
| 92. | Lewisport | 86 | 93,527(0.09%)#92 | 37,145,956(0.00%)#9,437 |
| 93. | Russell Springs | 84 | 93,527(0.09%)#93 | 37,145,956(0.00%)#9,523 |
| 94. | Greenup | 81 | 93,527(0.09%)#94 | 37,145,956(0.00%)#9,649 |
| 95. | Lynnview | 80 | 93,527(0.09%)#95 | 37,145,956(0.00%)#9,696 |
| 96. | Milton | 80 | 93,527(0.09%)#96 | 37,145,956(0.00%)#9,697 |
| 97. | Taylorsville | 79 | 93,527(0.08%)#97 | 37,145,956(0.00%)#9,725 |
| 98. | Silver Grove | 77 | 93,527(0.08%)#98 | 37,145,956(0.00%)#9,827 |
| 99. | London | 76 | 93,527(0.08%)#99 | 37,145,956(0.00%)#9,849 |
| 100. | Chaplin | 72 | 93,527(0.08%)#100 | 37,145,956(0.00%)#10,069 |
Common Questions
What are the Top 10 Cities with the Largest Mexican Community in Kentucky?
Top 10 Cities with the Largest Mexican Community in Kentucky are:
#1
15,655
#2
14,693
#3
3,561
#4
1,776
#5
1,755
#6
1,520
#7
1,301
#8
1,284
#9
1,208
#10
1,167
What city has the Largest Mexican Community in Kentucky?
Lexington has the Largest Mexican Community in Kentucky with 15,655.
What is the Total Mexican Population in the State of Kentucky?
Total Mexican Population in Kentucky is 93,527.
What is the Total Mexican Population in the United States?
Total Mexican Population in the United States is 37,145,956.