Cities with the Largest Mexican Community in Maryland
RELATED REPORTS & OPTIONS
Mexican
Maryland
Compare Cities
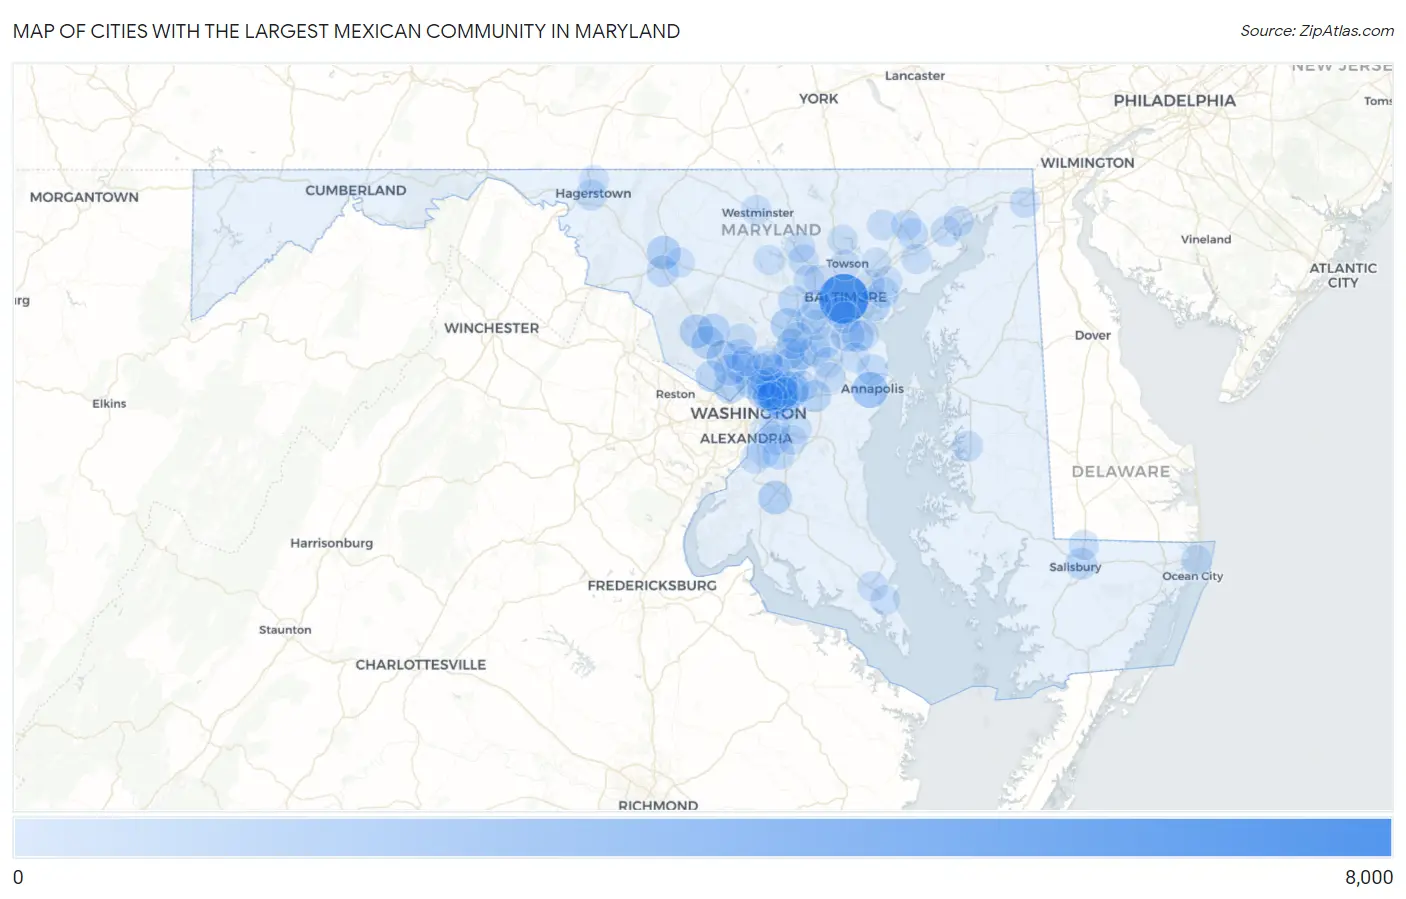
Map of Cities with the Largest Mexican Community in Maryland
0
8,000
Cities with the Largest Mexican Community in Maryland
| City | Mexican | vs State | vs National | |
| 1. | Baltimore | 7,559 | 107,230(7.05%)#1 | 37,145,956(0.02%)#674 |
| 2. | East Riverdale | 3,902 | 107,230(3.64%)#2 | 37,145,956(0.01%)#1,111 |
| 3. | Annapolis | 2,351 | 107,230(2.19%)#3 | 37,145,956(0.01%)#1,601 |
| 4. | Bladensburg | 1,701 | 107,230(1.59%)#4 | 37,145,956(0.00%)#2,007 |
| 5. | Silver Spring | 1,620 | 107,230(1.51%)#5 | 37,145,956(0.00%)#2,076 |
| 6. | Seabrook | 1,590 | 107,230(1.48%)#6 | 37,145,956(0.00%)#2,104 |
| 7. | Frederick | 1,559 | 107,230(1.45%)#7 | 37,145,956(0.00%)#2,132 |
| 8. | Columbia | 1,550 | 107,230(1.45%)#8 | 37,145,956(0.00%)#2,140 |
| 9. | Waldorf | 1,526 | 107,230(1.42%)#9 | 37,145,956(0.00%)#2,170 |
| 10. | Germantown | 1,487 | 107,230(1.39%)#10 | 37,145,956(0.00%)#2,202 |
| 11. | Riverdale Park | 1,484 | 107,230(1.38%)#11 | 37,145,956(0.00%)#2,205 |
| 12. | Landover | 1,460 | 107,230(1.36%)#12 | 37,145,956(0.00%)#2,222 |
| 13. | Glen Burnie | 1,350 | 107,230(1.26%)#13 | 37,145,956(0.00%)#2,338 |
| 14. | Gaithersburg | 1,324 | 107,230(1.23%)#14 | 37,145,956(0.00%)#2,363 |
| 15. | Wheaton | 1,311 | 107,230(1.22%)#15 | 37,145,956(0.00%)#2,376 |
| 16. | Dundalk | 1,308 | 107,230(1.22%)#16 | 37,145,956(0.00%)#2,378 |
| 17. | South Laurel | 1,141 | 107,230(1.06%)#17 | 37,145,956(0.00%)#2,595 |
| 18. | Bethesda | 1,128 | 107,230(1.05%)#18 | 37,145,956(0.00%)#2,609 |
| 19. | Montgomery Village | 1,097 | 107,230(1.02%)#19 | 37,145,956(0.00%)#2,661 |
| 20. | Woodlawn Cdp Baltimore County | 1,057 | 107,230(0.99%)#20 | 37,145,956(0.00%)#2,740 |
| 21. | Chillum | 1,039 | 107,230(0.97%)#21 | 37,145,956(0.00%)#2,775 |
| 22. | Maryland City | 990 | 107,230(0.92%)#22 | 37,145,956(0.00%)#2,855 |
| 23. | Rockville | 963 | 107,230(0.90%)#23 | 37,145,956(0.00%)#2,897 |
| 24. | Bowie | 935 | 107,230(0.87%)#24 | 37,145,956(0.00%)#2,945 |
| 25. | Woodlawn Cdp Prince George S County | 902 | 107,230(0.84%)#25 | 37,145,956(0.00%)#3,004 |
| 26. | Brooklyn Park | 899 | 107,230(0.84%)#26 | 37,145,956(0.00%)#3,014 |
| 27. | Salisbury | 886 | 107,230(0.83%)#27 | 37,145,956(0.00%)#3,041 |
| 28. | Clinton | 882 | 107,230(0.82%)#28 | 37,145,956(0.00%)#3,051 |
| 29. | North Bethesda | 864 | 107,230(0.81%)#29 | 37,145,956(0.00%)#3,084 |
| 30. | Laurel | 858 | 107,230(0.80%)#30 | 37,145,956(0.00%)#3,098 |
| 31. | Pasadena | 850 | 107,230(0.79%)#31 | 37,145,956(0.00%)#3,120 |
| 32. | Ballenger Creek | 838 | 107,230(0.78%)#32 | 37,145,956(0.00%)#3,142 |
| 33. | Aspen Hill | 837 | 107,230(0.78%)#33 | 37,145,956(0.00%)#3,149 |
| 34. | Potomac | 780 | 107,230(0.73%)#34 | 37,145,956(0.00%)#3,288 |
| 35. | Arnold | 756 | 107,230(0.71%)#35 | 37,145,956(0.00%)#3,355 |
| 36. | Fort Meade | 752 | 107,230(0.70%)#36 | 37,145,956(0.00%)#3,369 |
| 37. | Ellicott City | 725 | 107,230(0.68%)#37 | 37,145,956(0.00%)#3,446 |
| 38. | Lanham | 716 | 107,230(0.67%)#38 | 37,145,956(0.00%)#3,471 |
| 39. | Hagerstown | 670 | 107,230(0.62%)#39 | 37,145,956(0.00%)#3,599 |
| 40. | Glenn Dale | 659 | 107,230(0.61%)#40 | 37,145,956(0.00%)#3,638 |
| 41. | Severn | 646 | 107,230(0.60%)#41 | 37,145,956(0.00%)#3,677 |
| 42. | Ilchester | 646 | 107,230(0.60%)#42 | 37,145,956(0.00%)#3,678 |
| 43. | Bel Air South | 623 | 107,230(0.58%)#43 | 37,145,956(0.00%)#3,764 |
| 44. | Hyattsville | 588 | 107,230(0.55%)#44 | 37,145,956(0.00%)#3,899 |
| 45. | Beltsville | 567 | 107,230(0.53%)#45 | 37,145,956(0.00%)#3,980 |
| 46. | Flower Hill | 564 | 107,230(0.53%)#46 | 37,145,956(0.00%)#3,993 |
| 47. | Essex | 560 | 107,230(0.52%)#47 | 37,145,956(0.00%)#4,010 |
| 48. | Aberdeen | 551 | 107,230(0.51%)#48 | 37,145,956(0.00%)#4,045 |
| 49. | North Laurel | 543 | 107,230(0.51%)#49 | 37,145,956(0.00%)#4,081 |
| 50. | Adelphi | 543 | 107,230(0.51%)#50 | 37,145,956(0.00%)#4,082 |
| 51. | Elkton | 542 | 107,230(0.51%)#51 | 37,145,956(0.00%)#4,086 |
| 52. | Elkridge | 528 | 107,230(0.49%)#52 | 37,145,956(0.00%)#4,148 |
| 53. | Easton | 507 | 107,230(0.47%)#53 | 37,145,956(0.00%)#4,235 |
| 54. | Greenbelt | 506 | 107,230(0.47%)#54 | 37,145,956(0.00%)#4,239 |
| 55. | Owings Mills | 498 | 107,230(0.46%)#55 | 37,145,956(0.00%)#4,278 |
| 56. | Towson | 497 | 107,230(0.46%)#56 | 37,145,956(0.00%)#4,284 |
| 57. | Odenton | 495 | 107,230(0.46%)#57 | 37,145,956(0.00%)#4,292 |
| 58. | Camp Springs | 494 | 107,230(0.46%)#58 | 37,145,956(0.00%)#4,295 |
| 59. | Riviera Beach | 490 | 107,230(0.46%)#59 | 37,145,956(0.00%)#4,315 |
| 60. | Savage | 475 | 107,230(0.44%)#60 | 37,145,956(0.00%)#4,397 |
| 61. | Wildewood | 475 | 107,230(0.44%)#61 | 37,145,956(0.00%)#4,398 |
| 62. | Crofton | 468 | 107,230(0.44%)#62 | 37,145,956(0.00%)#4,427 |
| 63. | College Park | 465 | 107,230(0.43%)#63 | 37,145,956(0.00%)#4,437 |
| 64. | Fallston | 465 | 107,230(0.43%)#64 | 37,145,956(0.00%)#4,440 |
| 65. | Olney | 460 | 107,230(0.43%)#65 | 37,145,956(0.00%)#4,470 |
| 66. | Edgewood | 449 | 107,230(0.42%)#66 | 37,145,956(0.00%)#4,524 |
| 67. | White Oak | 447 | 107,230(0.42%)#67 | 37,145,956(0.00%)#4,537 |
| 68. | Reisterstown | 445 | 107,230(0.41%)#68 | 37,145,956(0.00%)#4,547 |
| 69. | Milford Mill | 429 | 107,230(0.40%)#69 | 37,145,956(0.00%)#4,652 |
| 70. | Bel Air | 429 | 107,230(0.40%)#70 | 37,145,956(0.00%)#4,654 |
| 71. | Baltimore Highlands | 426 | 107,230(0.40%)#71 | 37,145,956(0.00%)#4,671 |
| 72. | Calverton | 409 | 107,230(0.38%)#72 | 37,145,956(0.00%)#4,776 |
| 73. | California | 399 | 107,230(0.37%)#73 | 37,145,956(0.00%)#4,853 |
| 74. | Friendly | 392 | 107,230(0.37%)#74 | 37,145,956(0.00%)#4,901 |
| 75. | New Carrollton | 382 | 107,230(0.36%)#75 | 37,145,956(0.00%)#4,970 |
| 76. | Fort Washington | 378 | 107,230(0.35%)#76 | 37,145,956(0.00%)#4,991 |
| 77. | Havre De Grace | 377 | 107,230(0.35%)#77 | 37,145,956(0.00%)#5,003 |
| 78. | Langley Park | 375 | 107,230(0.35%)#78 | 37,145,956(0.00%)#5,019 |
| 79. | Ocean City | 351 | 107,230(0.33%)#79 | 37,145,956(0.00%)#5,180 |
| 80. | Cockeysville | 343 | 107,230(0.32%)#80 | 37,145,956(0.00%)#5,238 |
| 81. | Westphalia | 334 | 107,230(0.31%)#81 | 37,145,956(0.00%)#5,304 |
| 82. | Eldersburg | 325 | 107,230(0.30%)#82 | 37,145,956(0.00%)#5,381 |
| 83. | Westminster | 323 | 107,230(0.30%)#83 | 37,145,956(0.00%)#5,397 |
| 84. | Catonsville | 321 | 107,230(0.30%)#84 | 37,145,956(0.00%)#5,410 |
| 85. | Delmar | 319 | 107,230(0.30%)#85 | 37,145,956(0.00%)#5,428 |
| 86. | Spring Ridge | 311 | 107,230(0.29%)#86 | 37,145,956(0.00%)#5,495 |
| 87. | Lochearn | 310 | 107,230(0.29%)#87 | 37,145,956(0.00%)#5,501 |
| 88. | Fairland | 308 | 107,230(0.29%)#88 | 37,145,956(0.00%)#5,520 |
| 89. | Middle River | 303 | 107,230(0.28%)#89 | 37,145,956(0.00%)#5,554 |
| 90. | Rosedale | 301 | 107,230(0.28%)#90 | 37,145,956(0.00%)#5,576 |
| 91. | Lexington Park | 300 | 107,230(0.28%)#91 | 37,145,956(0.00%)#5,586 |
| 92. | Fountainhead Orchard Hills | 297 | 107,230(0.28%)#92 | 37,145,956(0.00%)#5,615 |
| 93. | Edmonston | 296 | 107,230(0.28%)#93 | 37,145,956(0.00%)#5,623 |
| 94. | Suitland | 295 | 107,230(0.28%)#94 | 37,145,956(0.00%)#5,629 |
| 95. | Brentwood | 288 | 107,230(0.27%)#95 | 37,145,956(0.00%)#5,705 |
| 96. | Melwood | 288 | 107,230(0.27%)#96 | 37,145,956(0.00%)#5,706 |
| 97. | Glenmont | 284 | 107,230(0.26%)#97 | 37,145,956(0.00%)#5,743 |
| 98. | Hillcrest Heights | 277 | 107,230(0.26%)#98 | 37,145,956(0.00%)#5,806 |
| 99. | Perry Hall | 272 | 107,230(0.25%)#99 | 37,145,956(0.00%)#5,846 |
| 100. | Severna Park | 255 | 107,230(0.24%)#100 | 37,145,956(0.00%)#6,029 |
Common Questions
What are the Top 10 Cities with the Largest Mexican Community in Maryland?
Top 10 Cities with the Largest Mexican Community in Maryland are:
#1
7,559
#2
3,902
#3
2,351
#4
1,701
#5
1,620
#6
1,590
#7
1,559
#8
1,550
#9
1,526
#10
1,487
What city has the Largest Mexican Community in Maryland?
Baltimore has the Largest Mexican Community in Maryland with 7,559.
What is the Total Mexican Population in the State of Maryland?
Total Mexican Population in Maryland is 107,230.
What is the Total Mexican Population in the United States?
Total Mexican Population in the United States is 37,145,956.