Cities with the Largest Mexican Community in New York
RELATED REPORTS & OPTIONS
Mexican
New York
Compare Cities
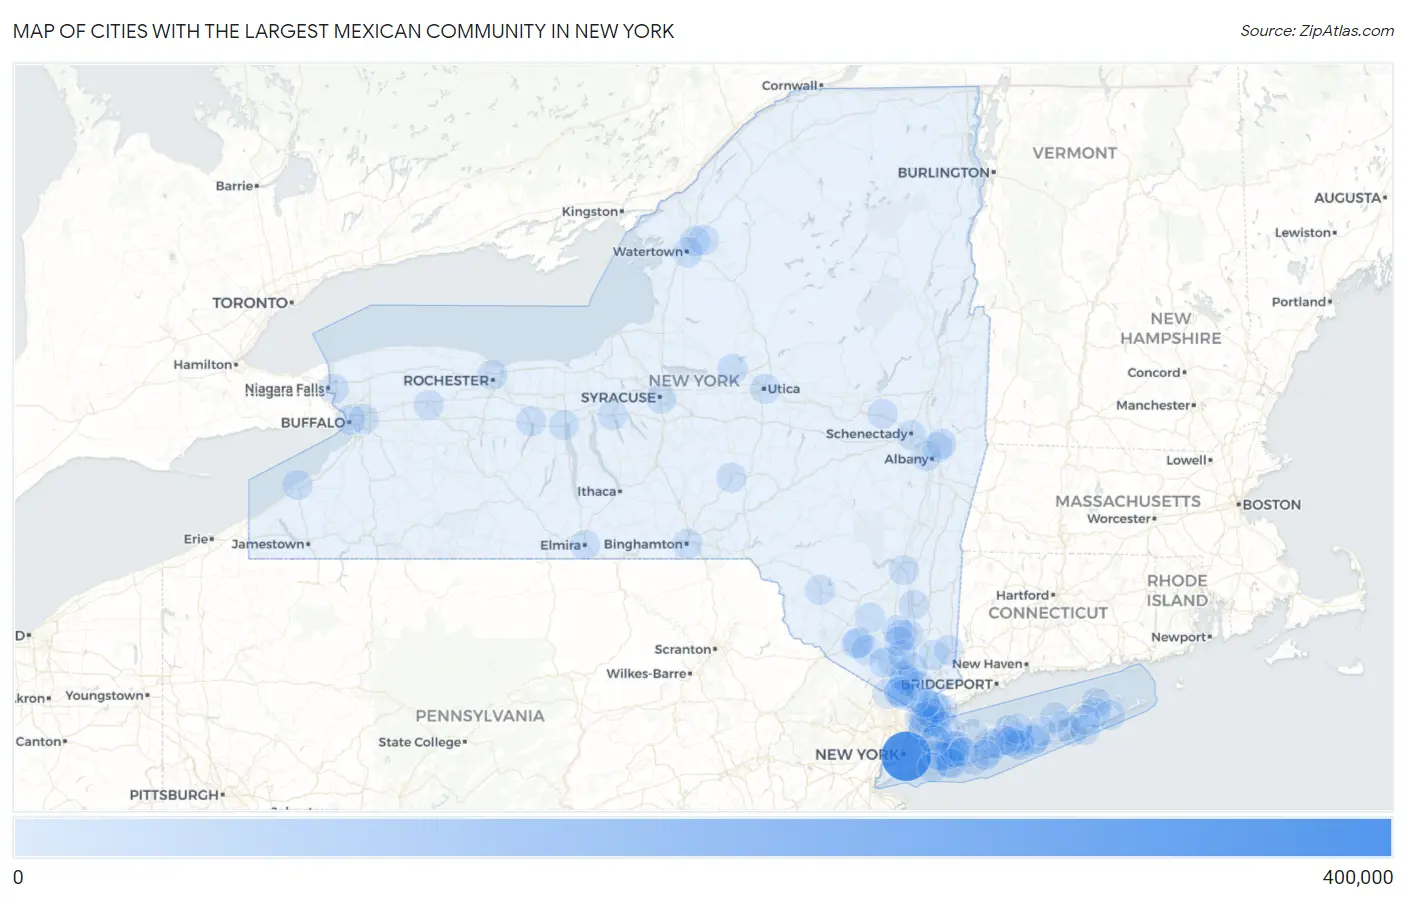
Map of Cities with the Largest Mexican Community in New York
0
400,000
Cities with the Largest Mexican Community in New York
| City | Mexican | vs State | vs National | |
| 1. | New York | 338,119 | 491,492(68.79%)#1 | 37,145,956(0.91%)#9 |
| 2. | Yonkers | 14,000 | 491,492(2.85%)#2 | 37,145,956(0.04%)#380 |
| 3. | New Rochelle | 10,457 | 491,492(2.13%)#3 | 37,145,956(0.03%)#505 |
| 4. | Newburgh | 6,379 | 491,492(1.30%)#4 | 37,145,956(0.02%)#767 |
| 5. | White Plains | 4,332 | 491,492(0.88%)#5 | 37,145,956(0.01%)#1,030 |
| 6. | Port Chester | 4,067 | 491,492(0.83%)#6 | 37,145,956(0.01%)#1,071 |
| 7. | Middletown | 4,039 | 491,492(0.82%)#7 | 37,145,956(0.01%)#1,077 |
| 8. | Buffalo | 2,624 | 491,492(0.53%)#8 | 37,145,956(0.01%)#1,479 |
| 9. | Poughkeepsie | 2,597 | 491,492(0.53%)#9 | 37,145,956(0.01%)#1,488 |
| 10. | Rochester | 1,769 | 491,492(0.36%)#10 | 37,145,956(0.00%)#1,966 |
| 11. | Mount Vernon | 1,463 | 491,492(0.30%)#11 | 37,145,956(0.00%)#2,220 |
| 12. | Kingston | 1,433 | 491,492(0.29%)#12 | 37,145,956(0.00%)#2,253 |
| 13. | New Cassel | 1,403 | 491,492(0.29%)#13 | 37,145,956(0.00%)#2,283 |
| 14. | Fort Drum | 1,293 | 491,492(0.26%)#14 | 37,145,956(0.00%)#2,398 |
| 15. | Brentwood | 1,229 | 491,492(0.25%)#15 | 37,145,956(0.00%)#2,466 |
| 16. | Westbury | 1,087 | 491,492(0.22%)#16 | 37,145,956(0.00%)#2,683 |
| 17. | Mamaroneck | 1,044 | 491,492(0.21%)#17 | 37,145,956(0.00%)#2,766 |
| 18. | Hempstead | 1,041 | 491,492(0.21%)#18 | 37,145,956(0.00%)#2,770 |
| 19. | Copiague | 977 | 491,492(0.20%)#19 | 37,145,956(0.00%)#2,872 |
| 20. | Hampton Bays | 976 | 491,492(0.20%)#20 | 37,145,956(0.00%)#2,874 |
| 21. | Shirley | 901 | 491,492(0.18%)#21 | 37,145,956(0.00%)#3,008 |
| 22. | Suffern | 899 | 491,492(0.18%)#22 | 37,145,956(0.00%)#3,015 |
| 23. | Syracuse | 826 | 491,492(0.17%)#23 | 37,145,956(0.00%)#3,177 |
| 24. | Flanders | 821 | 491,492(0.17%)#24 | 37,145,956(0.00%)#3,189 |
| 25. | Albany | 757 | 491,492(0.15%)#25 | 37,145,956(0.00%)#3,350 |
| 26. | Binghamton | 756 | 491,492(0.15%)#26 | 37,145,956(0.00%)#3,354 |
| 27. | Woodbury | 731 | 491,492(0.15%)#27 | 37,145,956(0.00%)#3,426 |
| 28. | Schenectady | 730 | 491,492(0.15%)#28 | 37,145,956(0.00%)#3,430 |
| 29. | Riverhead | 687 | 491,492(0.14%)#29 | 37,145,956(0.00%)#3,537 |
| 30. | Huntington Station | 686 | 491,492(0.14%)#30 | 37,145,956(0.00%)#3,539 |
| 31. | Beacon | 670 | 491,492(0.14%)#31 | 37,145,956(0.00%)#3,601 |
| 32. | Mechanicstown | 640 | 491,492(0.13%)#32 | 37,145,956(0.00%)#3,704 |
| 33. | Uniondale | 639 | 491,492(0.13%)#33 | 37,145,956(0.00%)#3,707 |
| 34. | Tuckahoe | 639 | 491,492(0.13%)#34 | 37,145,956(0.00%)#3,709 |
| 35. | Manorhaven | 613 | 491,492(0.12%)#35 | 37,145,956(0.00%)#3,802 |
| 36. | Mahopac | 597 | 491,492(0.12%)#36 | 37,145,956(0.00%)#3,862 |
| 37. | Medford | 587 | 491,492(0.12%)#37 | 37,145,956(0.00%)#3,902 |
| 38. | Goshen | 570 | 491,492(0.12%)#38 | 37,145,956(0.00%)#3,968 |
| 39. | Watervliet | 538 | 491,492(0.11%)#39 | 37,145,956(0.00%)#4,104 |
| 40. | Shelter Island | 505 | 491,492(0.10%)#40 | 37,145,956(0.00%)#4,246 |
| 41. | Utica | 496 | 491,492(0.10%)#41 | 37,145,956(0.00%)#4,289 |
| 42. | Noyack | 494 | 491,492(0.10%)#42 | 37,145,956(0.00%)#4,297 |
| 43. | Watertown | 479 | 491,492(0.10%)#43 | 37,145,956(0.00%)#4,377 |
| 44. | Elmira | 470 | 491,492(0.10%)#44 | 37,145,956(0.00%)#4,417 |
| 45. | Calcium | 463 | 491,492(0.09%)#45 | 37,145,956(0.00%)#4,450 |
| 46. | Harrison | 460 | 491,492(0.09%)#46 | 37,145,956(0.00%)#4,471 |
| 47. | Baldwin | 443 | 491,492(0.09%)#47 | 37,145,956(0.00%)#4,555 |
| 48. | Niagara Falls | 442 | 491,492(0.09%)#48 | 37,145,956(0.00%)#4,560 |
| 49. | East Hampton North | 440 | 491,492(0.09%)#49 | 37,145,956(0.00%)#4,579 |
| 50. | Hicksville | 436 | 491,492(0.09%)#50 | 37,145,956(0.00%)#4,599 |
| 51. | Elmont | 436 | 491,492(0.09%)#51 | 37,145,956(0.00%)#4,600 |
| 52. | Rome | 436 | 491,492(0.09%)#52 | 37,145,956(0.00%)#4,601 |
| 53. | Gardnertown | 431 | 491,492(0.09%)#53 | 37,145,956(0.00%)#4,643 |
| 54. | Franklin Square | 420 | 491,492(0.09%)#54 | 37,145,956(0.00%)#4,711 |
| 55. | West Haverstraw | 407 | 491,492(0.08%)#55 | 37,145,956(0.00%)#4,794 |
| 56. | Mastic | 405 | 491,492(0.08%)#56 | 37,145,956(0.00%)#4,805 |
| 57. | Central Islip | 396 | 491,492(0.08%)#57 | 37,145,956(0.00%)#4,878 |
| 58. | Liberty | 396 | 491,492(0.08%)#58 | 37,145,956(0.00%)#4,882 |
| 59. | Glen Cove | 395 | 491,492(0.08%)#59 | 37,145,956(0.00%)#4,885 |
| 60. | Amsterdam | 395 | 491,492(0.08%)#60 | 37,145,956(0.00%)#4,886 |
| 61. | Monroe | 395 | 491,492(0.08%)#61 | 37,145,956(0.00%)#4,887 |
| 62. | Haverstraw | 391 | 491,492(0.08%)#62 | 37,145,956(0.00%)#4,909 |
| 63. | Centereach | 387 | 491,492(0.08%)#63 | 37,145,956(0.00%)#4,941 |
| 64. | Fairview Cdp Dutchess County | 384 | 491,492(0.08%)#64 | 37,145,956(0.00%)#4,960 |
| 65. | Freeport | 382 | 491,492(0.08%)#65 | 37,145,956(0.00%)#4,968 |
| 66. | Troy | 375 | 491,492(0.08%)#66 | 37,145,956(0.00%)#5,016 |
| 67. | Manorville | 374 | 491,492(0.08%)#67 | 37,145,956(0.00%)#5,030 |
| 68. | Stony Point | 367 | 491,492(0.07%)#68 | 37,145,956(0.00%)#5,067 |
| 69. | North Patchogue | 356 | 491,492(0.07%)#69 | 37,145,956(0.00%)#5,149 |
| 70. | Dunkirk | 339 | 491,492(0.07%)#70 | 37,145,956(0.00%)#5,267 |
| 71. | Geneva | 338 | 491,492(0.07%)#71 | 37,145,956(0.00%)#5,275 |
| 72. | North Sea | 338 | 491,492(0.07%)#72 | 37,145,956(0.00%)#5,278 |
| 73. | Nyack | 337 | 491,492(0.07%)#73 | 37,145,956(0.00%)#5,285 |
| 74. | Ossining | 332 | 491,492(0.07%)#74 | 37,145,956(0.00%)#5,317 |
| 75. | East Meadow | 327 | 491,492(0.07%)#75 | 37,145,956(0.00%)#5,365 |
| 76. | Auburn | 326 | 491,492(0.07%)#76 | 37,145,956(0.00%)#5,370 |
| 77. | Southampton | 322 | 491,492(0.07%)#77 | 37,145,956(0.00%)#5,407 |
| 78. | Spring Valley | 320 | 491,492(0.07%)#78 | 37,145,956(0.00%)#5,422 |
| 79. | Norwich | 318 | 491,492(0.06%)#79 | 37,145,956(0.00%)#5,433 |
| 80. | Peekskill | 312 | 491,492(0.06%)#80 | 37,145,956(0.00%)#5,477 |
| 81. | Pine Bush | 302 | 491,492(0.06%)#81 | 37,145,956(0.00%)#5,569 |
| 82. | Bay Shore | 299 | 491,492(0.06%)#82 | 37,145,956(0.00%)#5,599 |
| 83. | Cheektowaga | 297 | 491,492(0.06%)#83 | 37,145,956(0.00%)#5,610 |
| 84. | East Patchogue | 293 | 491,492(0.06%)#84 | 37,145,956(0.00%)#5,648 |
| 85. | Scarsdale | 292 | 491,492(0.06%)#85 | 37,145,956(0.00%)#5,657 |
| 86. | Great Neck | 286 | 491,492(0.06%)#86 | 37,145,956(0.00%)#5,721 |
| 87. | Elmsford | 285 | 491,492(0.06%)#87 | 37,145,956(0.00%)#5,735 |
| 88. | Inwood | 279 | 491,492(0.06%)#88 | 37,145,956(0.00%)#5,792 |
| 89. | Canandaigua | 275 | 491,492(0.06%)#89 | 37,145,956(0.00%)#5,827 |
| 90. | Brewster | 272 | 491,492(0.06%)#90 | 37,145,956(0.00%)#5,853 |
| 91. | Coram | 268 | 491,492(0.05%)#91 | 37,145,956(0.00%)#5,890 |
| 92. | Hillcrest | 264 | 491,492(0.05%)#92 | 37,145,956(0.00%)#5,941 |
| 93. | Holbrook | 258 | 491,492(0.05%)#93 | 37,145,956(0.00%)#5,993 |
| 94. | Batavia | 258 | 491,492(0.05%)#94 | 37,145,956(0.00%)#5,994 |
| 95. | Nanuet | 256 | 491,492(0.05%)#95 | 37,145,956(0.00%)#6,017 |
| 96. | Plainedge | 254 | 491,492(0.05%)#96 | 37,145,956(0.00%)#6,045 |
| 97. | West Point | 250 | 491,492(0.05%)#97 | 37,145,956(0.00%)#6,090 |
| 98. | Ronkonkoma | 247 | 491,492(0.05%)#98 | 37,145,956(0.00%)#6,119 |
| 99. | Vails Gate | 245 | 491,492(0.05%)#99 | 37,145,956(0.00%)#6,153 |
| 100. | West Islip | 241 | 491,492(0.05%)#100 | 37,145,956(0.00%)#6,193 |
Common Questions
What are the Top 10 Cities with the Largest Mexican Community in New York?
Top 10 Cities with the Largest Mexican Community in New York are:
#1
338,119
#2
14,000
#3
10,457
#4
6,379
#5
4,332
#6
4,067
#7
4,039
#8
2,624
#9
2,597
#10
1,769
What city has the Largest Mexican Community in New York?
New York has the Largest Mexican Community in New York with 338,119.
What is the Total Mexican Population in the State of New York?
Total Mexican Population in New York is 491,492.
What is the Total Mexican Population in the United States?
Total Mexican Population in the United States is 37,145,956.