Cities with the Largest Mexican Community in Texas
RELATED REPORTS & OPTIONS
Mexican
Texas
Compare Cities
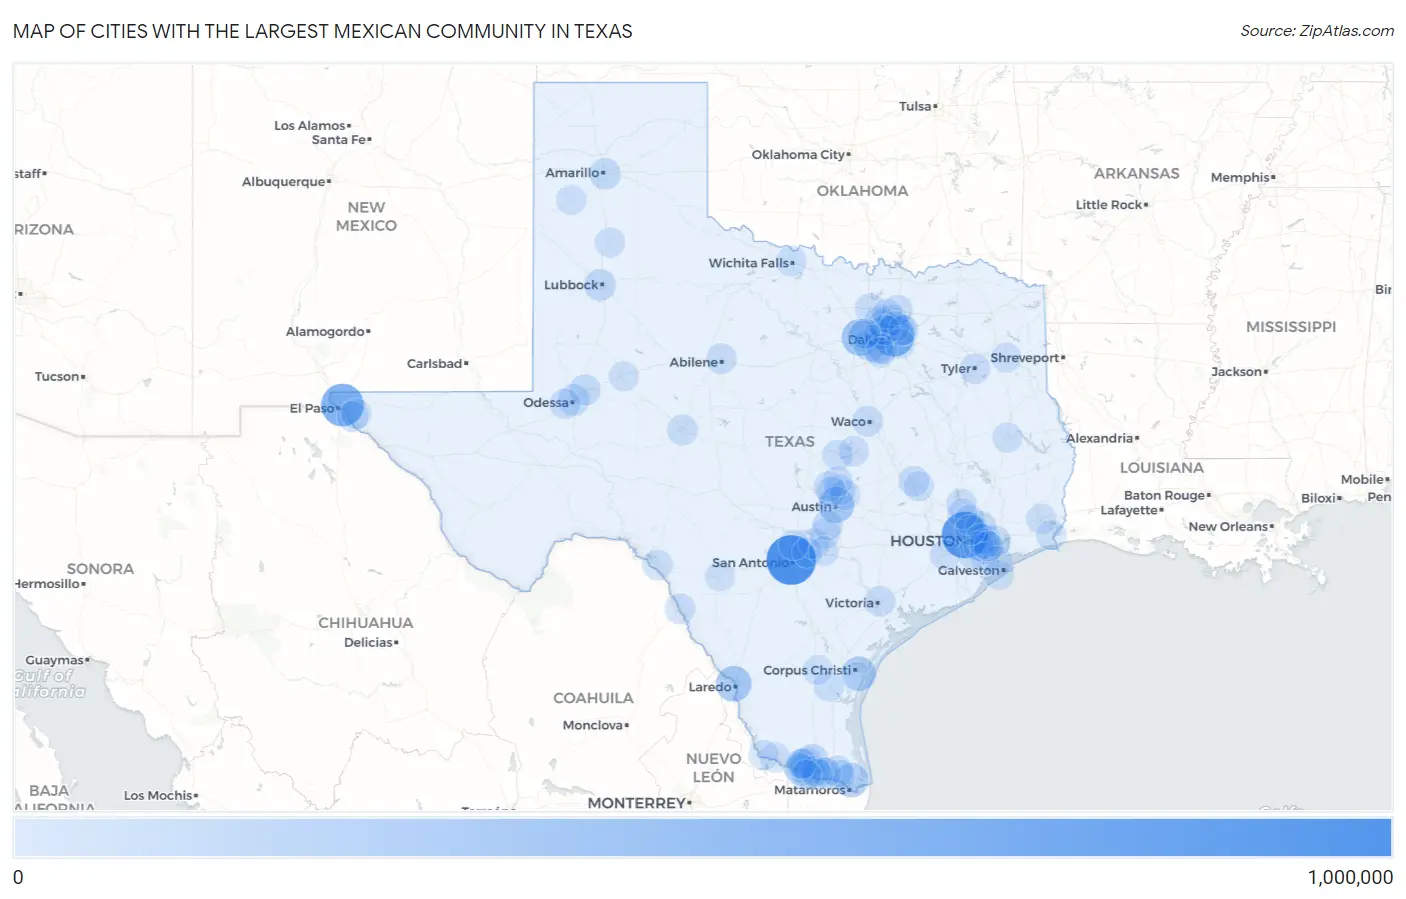
Map of Cities with the Largest Mexican Community in Texas
0
1,000,000
Cities with the Largest Mexican Community in Texas
| City | Mexican | vs State | vs National | |
| 1. | San Antonio | 808,918 | 9,638,268(8.39%)#1 | 37,145,956(2.18%)#2 |
| 2. | Houston | 686,373 | 9,638,268(7.12%)#2 | 37,145,956(1.85%)#3 |
| 3. | El Paso | 519,100 | 9,638,268(5.39%)#3 | 37,145,956(1.40%)#6 |
| 4. | Dallas | 449,290 | 9,638,268(4.66%)#4 | 37,145,956(1.21%)#7 |
| 5. | Fort Worth | 271,493 | 9,638,268(2.82%)#5 | 37,145,956(0.73%)#10 |
| 6. | Austin | 233,961 | 9,638,268(2.43%)#6 | 37,145,956(0.63%)#13 |
| 7. | Laredo | 230,180 | 9,638,268(2.39%)#7 | 37,145,956(0.62%)#14 |
| 8. | Corpus Christi | 186,652 | 9,638,268(1.94%)#8 | 37,145,956(0.50%)#18 |
| 9. | Brownsville | 167,910 | 9,638,268(1.74%)#9 | 37,145,956(0.45%)#19 |
| 10. | Mcallen | 116,648 | 9,638,268(1.21%)#10 | 37,145,956(0.31%)#33 |
| 11. | Pasadena | 91,406 | 9,638,268(0.95%)#11 | 37,145,956(0.25%)#40 |
| 12. | Arlington | 91,036 | 9,638,268(0.94%)#12 | 37,145,956(0.25%)#41 |
| 13. | Garland | 87,336 | 9,638,268(0.91%)#13 | 37,145,956(0.24%)#44 |
| 14. | Edinburg | 82,402 | 9,638,268(0.85%)#14 | 37,145,956(0.22%)#48 |
| 15. | Lubbock | 78,826 | 9,638,268(0.82%)#15 | 37,145,956(0.21%)#50 |
| 16. | Grand Prairie | 77,835 | 9,638,268(0.81%)#16 | 37,145,956(0.21%)#52 |
| 17. | Pharr | 72,899 | 9,638,268(0.76%)#17 | 37,145,956(0.20%)#56 |
| 18. | Mission | 71,396 | 9,638,268(0.74%)#18 | 37,145,956(0.19%)#57 |
| 19. | Irving | 71,217 | 9,638,268(0.74%)#19 | 37,145,956(0.19%)#58 |
| 20. | Odessa | 65,217 | 9,638,268(0.68%)#20 | 37,145,956(0.18%)#69 |
| 21. | Amarillo | 60,259 | 9,638,268(0.63%)#21 | 37,145,956(0.16%)#72 |
| 22. | Midland | 54,639 | 9,638,268(0.57%)#22 | 37,145,956(0.15%)#88 |
| 23. | Harlingen | 53,907 | 9,638,268(0.56%)#23 | 37,145,956(0.15%)#89 |
| 24. | San Angelo | 39,572 | 9,638,268(0.41%)#24 | 37,145,956(0.11%)#125 |
| 25. | Baytown | 39,386 | 9,638,268(0.41%)#25 | 37,145,956(0.11%)#128 |
| 26. | Waco | 38,090 | 9,638,268(0.40%)#26 | 37,145,956(0.10%)#134 |
| 27. | Weslaco | 33,751 | 9,638,268(0.35%)#27 | 37,145,956(0.09%)#151 |
| 28. | Socorro | 33,062 | 9,638,268(0.34%)#28 | 37,145,956(0.09%)#155 |
| 29. | Victoria | 32,603 | 9,638,268(0.34%)#29 | 37,145,956(0.09%)#160 |
| 30. | Carrollton | 31,788 | 9,638,268(0.33%)#30 | 37,145,956(0.09%)#164 |
| 31. | Bryan | 30,699 | 9,638,268(0.32%)#31 | 37,145,956(0.08%)#168 |
| 32. | Abilene | 30,141 | 9,638,268(0.31%)#32 | 37,145,956(0.08%)#173 |
| 33. | New Braunfels | 29,340 | 9,638,268(0.30%)#33 | 37,145,956(0.08%)#179 |
| 34. | Plano | 28,725 | 9,638,268(0.30%)#34 | 37,145,956(0.08%)#186 |
| 35. | Channelview | 28,691 | 9,638,268(0.30%)#35 | 37,145,956(0.08%)#187 |
| 36. | Del Rio | 27,451 | 9,638,268(0.28%)#36 | 37,145,956(0.07%)#195 |
| 37. | Lewisville | 27,207 | 9,638,268(0.28%)#37 | 37,145,956(0.07%)#199 |
| 38. | Denton | 26,827 | 9,638,268(0.28%)#38 | 37,145,956(0.07%)#203 |
| 39. | Round Rock | 26,520 | 9,638,268(0.28%)#39 | 37,145,956(0.07%)#205 |
| 40. | Eagle Pass | 26,087 | 9,638,268(0.27%)#40 | 37,145,956(0.07%)#211 |
| 41. | Pearland | 25,089 | 9,638,268(0.26%)#41 | 37,145,956(0.07%)#216 |
| 42. | Mckinney | 24,601 | 9,638,268(0.26%)#42 | 37,145,956(0.07%)#220 |
| 43. | San Marcos | 23,399 | 9,638,268(0.24%)#43 | 37,145,956(0.06%)#235 |
| 44. | Kyle | 22,182 | 9,638,268(0.23%)#44 | 37,145,956(0.06%)#250 |
| 45. | San Benito | 21,851 | 9,638,268(0.23%)#45 | 37,145,956(0.06%)#254 |
| 46. | Killeen | 21,503 | 9,638,268(0.22%)#46 | 37,145,956(0.06%)#258 |
| 47. | Atascocita | 20,875 | 9,638,268(0.22%)#47 | 37,145,956(0.06%)#265 |
| 48. | Tyler | 20,808 | 9,638,268(0.22%)#48 | 37,145,956(0.06%)#267 |
| 49. | Temple | 20,668 | 9,638,268(0.21%)#49 | 37,145,956(0.06%)#268 |
| 50. | Wichita Falls | 20,148 | 9,638,268(0.21%)#50 | 37,145,956(0.05%)#271 |
| 51. | Beaumont | 19,417 | 9,638,268(0.20%)#51 | 37,145,956(0.05%)#278 |
| 52. | West Odessa | 19,187 | 9,638,268(0.20%)#52 | 37,145,956(0.05%)#283 |
| 53. | Horizon City | 19,038 | 9,638,268(0.20%)#53 | 37,145,956(0.05%)#288 |
| 54. | Haltom City | 18,098 | 9,638,268(0.19%)#54 | 37,145,956(0.05%)#299 |
| 55. | Alton | 18,084 | 9,638,268(0.19%)#55 | 37,145,956(0.05%)#300 |
| 56. | Kingsville | 17,872 | 9,638,268(0.19%)#56 | 37,145,956(0.05%)#305 |
| 57. | Rosenberg | 17,724 | 9,638,268(0.18%)#57 | 37,145,956(0.05%)#308 |
| 58. | Conroe | 17,562 | 9,638,268(0.18%)#58 | 37,145,956(0.05%)#310 |
| 59. | Spring | 17,158 | 9,638,268(0.18%)#59 | 37,145,956(0.05%)#319 |
| 60. | Alamo | 16,744 | 9,638,268(0.17%)#60 | 37,145,956(0.05%)#324 |
| 61. | Pflugerville | 16,431 | 9,638,268(0.17%)#61 | 37,145,956(0.04%)#328 |
| 62. | Cloverleaf | 15,925 | 9,638,268(0.17%)#62 | 37,145,956(0.04%)#334 |
| 63. | League City | 15,708 | 9,638,268(0.16%)#63 | 37,145,956(0.04%)#338 |
| 64. | College Station | 15,556 | 9,638,268(0.16%)#64 | 37,145,956(0.04%)#343 |
| 65. | Frisco | 15,543 | 9,638,268(0.16%)#65 | 37,145,956(0.04%)#344 |
| 66. | Port Arthur | 15,309 | 9,638,268(0.16%)#66 | 37,145,956(0.04%)#351 |
| 67. | Seguin | 15,131 | 9,638,268(0.16%)#67 | 37,145,956(0.04%)#355 |
| 68. | Richardson | 14,937 | 9,638,268(0.15%)#68 | 37,145,956(0.04%)#360 |
| 69. | Donna | 14,786 | 9,638,268(0.15%)#69 | 37,145,956(0.04%)#361 |
| 70. | Longview | 14,557 | 9,638,268(0.15%)#70 | 37,145,956(0.04%)#364 |
| 71. | Alice | 14,455 | 9,638,268(0.15%)#71 | 37,145,956(0.04%)#367 |
| 72. | Texas City | 14,347 | 9,638,268(0.15%)#72 | 37,145,956(0.04%)#369 |
| 73. | Mercedes | 14,314 | 9,638,268(0.15%)#73 | 37,145,956(0.04%)#371 |
| 74. | Duncanville | 13,869 | 9,638,268(0.14%)#74 | 37,145,956(0.04%)#383 |
| 75. | The Woodlands | 13,697 | 9,638,268(0.14%)#75 | 37,145,956(0.04%)#390 |
| 76. | Rio Grande City | 13,625 | 9,638,268(0.14%)#76 | 37,145,956(0.04%)#391 |
| 77. | South Houston | 13,600 | 9,638,268(0.14%)#77 | 37,145,956(0.04%)#392 |
| 78. | Palmview | 13,337 | 9,638,268(0.14%)#78 | 37,145,956(0.04%)#401 |
| 79. | Hidalgo | 13,271 | 9,638,268(0.14%)#79 | 37,145,956(0.04%)#403 |
| 80. | Georgetown | 12,951 | 9,638,268(0.13%)#80 | 37,145,956(0.03%)#412 |
| 81. | Balch Springs | 12,832 | 9,638,268(0.13%)#81 | 37,145,956(0.03%)#418 |
| 82. | Schertz | 12,537 | 9,638,268(0.13%)#82 | 37,145,956(0.03%)#431 |
| 83. | Deer Park | 12,442 | 9,638,268(0.13%)#83 | 37,145,956(0.03%)#437 |
| 84. | La Porte | 12,411 | 9,638,268(0.13%)#84 | 37,145,956(0.03%)#439 |
| 85. | Leander | 12,390 | 9,638,268(0.13%)#85 | 37,145,956(0.03%)#440 |
| 86. | Plainview | 11,448 | 9,638,268(0.12%)#86 | 37,145,956(0.03%)#466 |
| 87. | Aldine | 11,287 | 9,638,268(0.12%)#87 | 37,145,956(0.03%)#473 |
| 88. | Farmers Branch | 11,272 | 9,638,268(0.12%)#88 | 37,145,956(0.03%)#474 |
| 89. | Uvalde | 11,253 | 9,638,268(0.12%)#89 | 37,145,956(0.03%)#475 |
| 90. | Cedar Park | 11,239 | 9,638,268(0.12%)#90 | 37,145,956(0.03%)#476 |
| 91. | Rowlett | 11,176 | 9,638,268(0.12%)#91 | 37,145,956(0.03%)#478 |
| 92. | Hereford | 11,086 | 9,638,268(0.12%)#92 | 37,145,956(0.03%)#482 |
| 93. | Cedar Hill | 11,068 | 9,638,268(0.11%)#93 | 37,145,956(0.03%)#484 |
| 94. | Galveston | 10,839 | 9,638,268(0.11%)#94 | 37,145,956(0.03%)#492 |
| 95. | Roma | 10,745 | 9,638,268(0.11%)#95 | 37,145,956(0.03%)#494 |
| 96. | Big Spring | 10,485 | 9,638,268(0.11%)#96 | 37,145,956(0.03%)#504 |
| 97. | North Richland Hills | 10,323 | 9,638,268(0.11%)#97 | 37,145,956(0.03%)#507 |
| 98. | La Homa | 10,318 | 9,638,268(0.11%)#98 | 37,145,956(0.03%)#508 |
| 99. | Lufkin | 10,316 | 9,638,268(0.11%)#99 | 37,145,956(0.03%)#509 |
| 100. | Timberwood Park | 9,880 | 9,638,268(0.10%)#100 | 37,145,956(0.03%)#528 |
Common Questions
What are the Top 10 Cities with the Largest Mexican Community in Texas?
Top 10 Cities with the Largest Mexican Community in Texas are:
#1
808,918
#2
686,373
#3
519,100
#4
449,290
#5
271,493
#6
233,961
#7
230,180
#8
186,652
#9
167,910
#10
116,648
What city has the Largest Mexican Community in Texas?
San Antonio has the Largest Mexican Community in Texas with 808,918.
What is the Total Mexican Population in the State of Texas?
Total Mexican Population in Texas is 9,638,268.
What is the Total Mexican Population in the United States?
Total Mexican Population in the United States is 37,145,956.