Cities with the Largest Mexican Community in Missouri
RELATED REPORTS & OPTIONS
Mexican
Missouri
Compare Cities
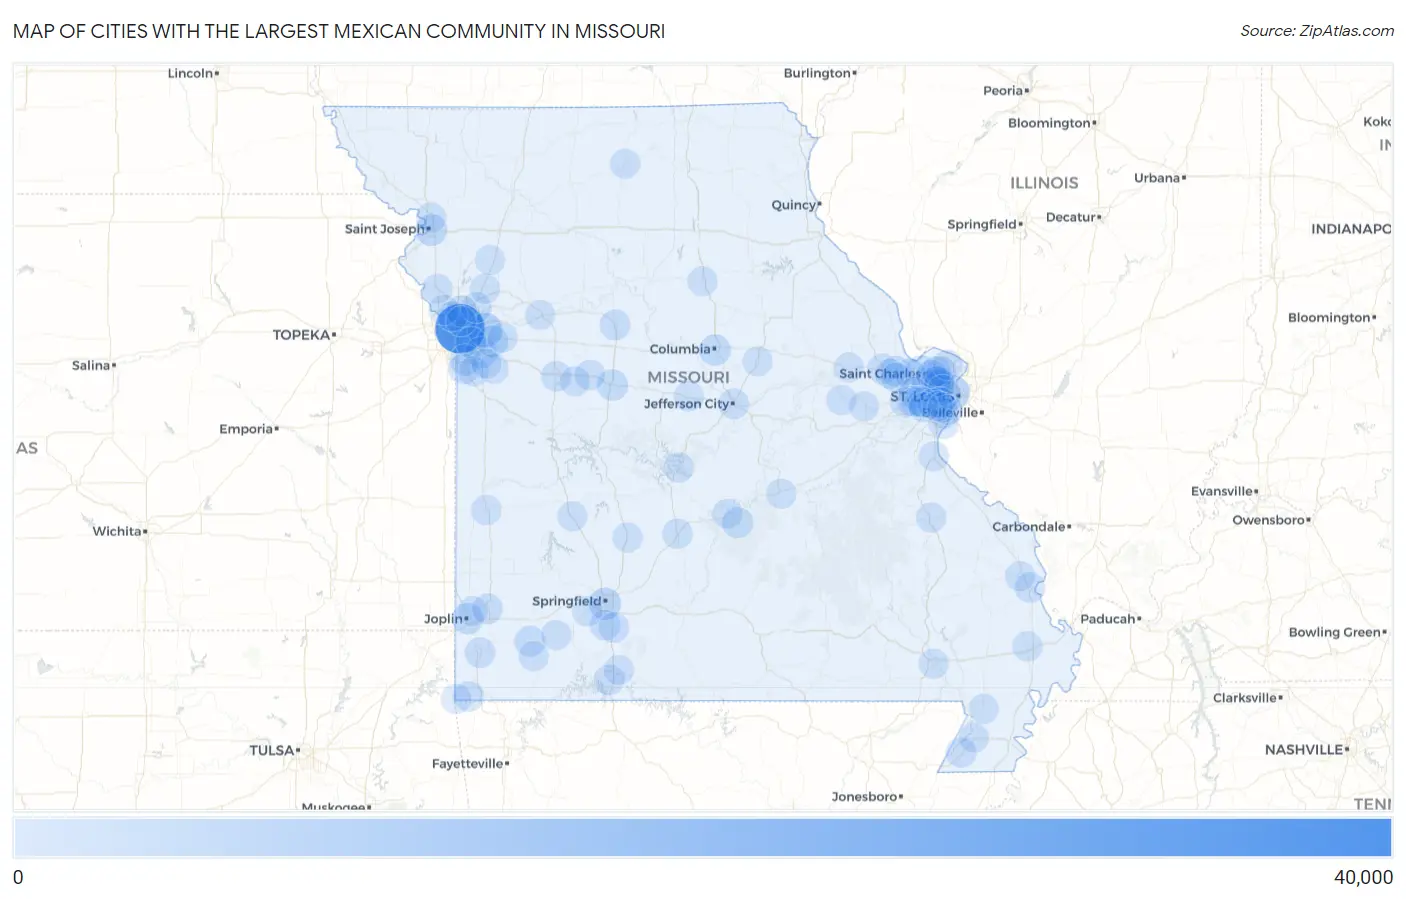
Map of Cities with the Largest Mexican Community in Missouri
0
40,000
Cities with the Largest Mexican Community in Missouri
| City | Mexican | vs State | vs National | |
| 1. | Kansas City | 38,611 | 178,976(21.57%)#1 | 37,145,956(0.10%)#132 |
| 2. | St Louis | 8,279 | 178,976(4.63%)#2 | 37,145,956(0.02%)#617 |
| 3. | Independence | 8,212 | 178,976(4.59%)#3 | 37,145,956(0.02%)#622 |
| 4. | Springfield | 4,079 | 178,976(2.28%)#4 | 37,145,956(0.01%)#1,068 |
| 5. | Lee S Summit | 3,596 | 178,976(2.01%)#5 | 37,145,956(0.01%)#1,182 |
| 6. | St Joseph | 3,242 | 178,976(1.81%)#6 | 37,145,956(0.01%)#1,297 |
| 7. | Blue Springs | 2,925 | 178,976(1.63%)#7 | 37,145,956(0.01%)#1,377 |
| 8. | Columbia | 2,759 | 178,976(1.54%)#8 | 37,145,956(0.01%)#1,426 |
| 9. | St Charles | 2,621 | 178,976(1.46%)#9 | 37,145,956(0.01%)#1,480 |
| 10. | Sedalia | 2,426 | 178,976(1.36%)#10 | 37,145,956(0.01%)#1,572 |
| 11. | Grandview | 2,368 | 178,976(1.32%)#11 | 37,145,956(0.01%)#1,593 |
| 12. | Joplin | 2,298 | 178,976(1.28%)#12 | 37,145,956(0.01%)#1,638 |
| 13. | Monett | 1,984 | 178,976(1.11%)#13 | 37,145,956(0.01%)#1,834 |
| 14. | O Fallon | 1,928 | 178,976(1.08%)#14 | 37,145,956(0.01%)#1,870 |
| 15. | Fort Leonard Wood | 1,909 | 178,976(1.07%)#15 | 37,145,956(0.01%)#1,884 |
| 16. | Raytown | 1,853 | 178,976(1.04%)#16 | 37,145,956(0.00%)#1,903 |
| 17. | Gladstone | 1,586 | 178,976(0.89%)#17 | 37,145,956(0.00%)#2,106 |
| 18. | Overland | 1,497 | 178,976(0.84%)#18 | 37,145,956(0.00%)#2,191 |
| 19. | Belton | 1,447 | 178,976(0.81%)#19 | 37,145,956(0.00%)#2,241 |
| 20. | Marshall | 1,296 | 178,976(0.72%)#20 | 37,145,956(0.00%)#2,392 |
| 21. | Carthage | 1,210 | 178,976(0.68%)#21 | 37,145,956(0.00%)#2,490 |
| 22. | Liberty | 1,107 | 178,976(0.62%)#22 | 37,145,956(0.00%)#2,643 |
| 23. | Jefferson City | 1,089 | 178,976(0.61%)#23 | 37,145,956(0.00%)#2,676 |
| 24. | Cape Girardeau | 1,049 | 178,976(0.59%)#24 | 37,145,956(0.00%)#2,755 |
| 25. | Nixa | 920 | 178,976(0.51%)#25 | 37,145,956(0.00%)#2,971 |
| 26. | St Peters | 901 | 178,976(0.50%)#26 | 37,145,956(0.00%)#3,007 |
| 27. | Neosho | 900 | 178,976(0.50%)#27 | 37,145,956(0.00%)#3,011 |
| 28. | Chesterfield | 863 | 178,976(0.48%)#28 | 37,145,956(0.00%)#3,087 |
| 29. | Branson | 855 | 178,976(0.48%)#29 | 37,145,956(0.00%)#3,108 |
| 30. | Ballwin | 821 | 178,976(0.46%)#30 | 37,145,956(0.00%)#3,187 |
| 31. | Breckenridge Hills | 798 | 178,976(0.45%)#31 | 37,145,956(0.00%)#3,235 |
| 32. | Noel | 774 | 178,976(0.43%)#32 | 37,145,956(0.00%)#3,306 |
| 33. | Wentzville | 764 | 178,976(0.43%)#33 | 37,145,956(0.00%)#3,333 |
| 34. | Senath | 736 | 178,976(0.41%)#34 | 37,145,956(0.00%)#3,413 |
| 35. | Maryland Heights | 716 | 178,976(0.40%)#35 | 37,145,956(0.00%)#3,470 |
| 36. | Warrensburg | 709 | 178,976(0.40%)#36 | 37,145,956(0.00%)#3,483 |
| 37. | Woodson Terrace | 678 | 178,976(0.38%)#37 | 37,145,956(0.00%)#3,567 |
| 38. | Ozark | 675 | 178,976(0.38%)#38 | 37,145,956(0.00%)#3,572 |
| 39. | Bridgeton | 648 | 178,976(0.36%)#39 | 37,145,956(0.00%)#3,672 |
| 40. | St John | 645 | 178,976(0.36%)#40 | 37,145,956(0.00%)#3,686 |
| 41. | St Ann | 619 | 178,976(0.35%)#41 | 37,145,956(0.00%)#3,778 |
| 42. | Ellisville | 617 | 178,976(0.34%)#42 | 37,145,956(0.00%)#3,788 |
| 43. | Lebanon | 556 | 178,976(0.31%)#43 | 37,145,956(0.00%)#4,029 |
| 44. | La Monte | 536 | 178,976(0.30%)#44 | 37,145,956(0.00%)#4,115 |
| 45. | Florissant | 520 | 178,976(0.29%)#45 | 37,145,956(0.00%)#4,177 |
| 46. | Grain Valley | 498 | 178,976(0.28%)#46 | 37,145,956(0.00%)#4,280 |
| 47. | Wildwood | 490 | 178,976(0.27%)#47 | 37,145,956(0.00%)#4,311 |
| 48. | Winchester | 487 | 178,976(0.27%)#48 | 37,145,956(0.00%)#4,335 |
| 49. | Lexington | 483 | 178,976(0.27%)#49 | 37,145,956(0.00%)#4,363 |
| 50. | Mehlville | 478 | 178,976(0.27%)#50 | 37,145,956(0.00%)#4,384 |
| 51. | Republic | 477 | 178,976(0.27%)#51 | 37,145,956(0.00%)#4,389 |
| 52. | Southwest City | 476 | 178,976(0.27%)#52 | 37,145,956(0.00%)#4,392 |
| 53. | Old Jamestown | 473 | 178,976(0.26%)#53 | 37,145,956(0.00%)#4,402 |
| 54. | Hazelwood | 472 | 178,976(0.26%)#54 | 37,145,956(0.00%)#4,406 |
| 55. | California | 462 | 178,976(0.26%)#55 | 37,145,956(0.00%)#4,458 |
| 56. | Parkville | 457 | 178,976(0.26%)#56 | 37,145,956(0.00%)#4,489 |
| 57. | Oakville | 445 | 178,976(0.25%)#57 | 37,145,956(0.00%)#4,546 |
| 58. | Webster Groves | 438 | 178,976(0.24%)#58 | 37,145,956(0.00%)#4,586 |
| 59. | Raymore | 435 | 178,976(0.24%)#59 | 37,145,956(0.00%)#4,607 |
| 60. | Milan | 402 | 178,976(0.22%)#60 | 37,145,956(0.00%)#4,837 |
| 61. | Festus | 394 | 178,976(0.22%)#61 | 37,145,956(0.00%)#4,893 |
| 62. | Whiteman Afb | 390 | 178,976(0.22%)#62 | 37,145,956(0.00%)#4,918 |
| 63. | Sikeston | 370 | 178,976(0.21%)#63 | 37,145,956(0.00%)#5,051 |
| 64. | Aurora | 366 | 178,976(0.20%)#64 | 37,145,956(0.00%)#5,078 |
| 65. | Osage Beach | 360 | 178,976(0.20%)#65 | 37,145,956(0.00%)#5,120 |
| 66. | University City | 353 | 178,976(0.20%)#66 | 37,145,956(0.00%)#5,169 |
| 67. | Kennett | 345 | 178,976(0.19%)#67 | 37,145,956(0.00%)#5,221 |
| 68. | Jackson | 336 | 178,976(0.19%)#68 | 37,145,956(0.00%)#5,291 |
| 69. | Purdy | 333 | 178,976(0.19%)#69 | 37,145,956(0.00%)#5,316 |
| 70. | Farmington | 330 | 178,976(0.18%)#70 | 37,145,956(0.00%)#5,337 |
| 71. | Kearney | 327 | 178,976(0.18%)#71 | 37,145,956(0.00%)#5,366 |
| 72. | Manchester | 317 | 178,976(0.18%)#72 | 37,145,956(0.00%)#5,439 |
| 73. | Kirkwood | 314 | 178,976(0.18%)#73 | 37,145,956(0.00%)#5,463 |
| 74. | Pleasant Hill | 295 | 178,976(0.16%)#74 | 37,145,956(0.00%)#5,632 |
| 75. | Fulton | 290 | 178,976(0.16%)#75 | 37,145,956(0.00%)#5,676 |
| 76. | Webb City | 285 | 178,976(0.16%)#76 | 37,145,956(0.00%)#5,732 |
| 77. | Riverside | 285 | 178,976(0.16%)#77 | 37,145,956(0.00%)#5,739 |
| 78. | Lemay | 281 | 178,976(0.16%)#78 | 37,145,956(0.00%)#5,771 |
| 79. | Crestwood | 277 | 178,976(0.15%)#79 | 37,145,956(0.00%)#5,807 |
| 80. | Lathrop | 269 | 178,976(0.15%)#80 | 37,145,956(0.00%)#5,887 |
| 81. | Moberly | 268 | 178,976(0.15%)#81 | 37,145,956(0.00%)#5,894 |
| 82. | Nevada | 268 | 178,976(0.15%)#82 | 37,145,956(0.00%)#5,896 |
| 83. | New Haven | 266 | 178,976(0.15%)#83 | 37,145,956(0.00%)#5,921 |
| 84. | Dardenne Prairie | 264 | 178,976(0.15%)#84 | 37,145,956(0.00%)#5,937 |
| 85. | Rolla | 259 | 178,976(0.14%)#85 | 37,145,956(0.00%)#5,986 |
| 86. | Valley Park | 255 | 178,976(0.14%)#86 | 37,145,956(0.00%)#6,032 |
| 87. | Waynesville | 253 | 178,976(0.14%)#87 | 37,145,956(0.00%)#6,058 |
| 88. | Affton | 250 | 178,976(0.14%)#88 | 37,145,956(0.00%)#6,087 |
| 89. | Country Club | 247 | 178,976(0.14%)#89 | 37,145,956(0.00%)#6,125 |
| 90. | Washington | 245 | 178,976(0.14%)#90 | 37,145,956(0.00%)#6,145 |
| 91. | Greenwood | 245 | 178,976(0.14%)#91 | 37,145,956(0.00%)#6,150 |
| 92. | Lake St Louis | 241 | 178,976(0.13%)#92 | 37,145,956(0.00%)#6,194 |
| 93. | Poplar Bluff | 239 | 178,976(0.13%)#93 | 37,145,956(0.00%)#6,226 |
| 94. | Merriam Woods | 234 | 178,976(0.13%)#94 | 37,145,956(0.00%)#6,286 |
| 95. | Buffalo | 229 | 178,976(0.13%)#95 | 37,145,956(0.00%)#6,354 |
| 96. | Platte City | 228 | 178,976(0.13%)#96 | 37,145,956(0.00%)#6,363 |
| 97. | Humansville | 228 | 178,976(0.13%)#97 | 37,145,956(0.00%)#6,368 |
| 98. | Clarkton | 215 | 178,976(0.12%)#98 | 37,145,956(0.00%)#6,550 |
| 99. | Warrenton | 214 | 178,976(0.12%)#99 | 37,145,956(0.00%)#6,561 |
| 100. | North Kansas City | 214 | 178,976(0.12%)#100 | 37,145,956(0.00%)#6,562 |
Common Questions
What are the Top 10 Cities with the Largest Mexican Community in Missouri?
Top 10 Cities with the Largest Mexican Community in Missouri are:
#1
38,611
#2
8,279
#3
8,212
#4
4,079
#5
3,596
#6
3,242
#7
2,925
#8
2,759
#9
2,621
#10
2,426
What city has the Largest Mexican Community in Missouri?
Kansas City has the Largest Mexican Community in Missouri with 38,611.
What is the Total Mexican Population in the State of Missouri?
Total Mexican Population in Missouri is 178,976.
What is the Total Mexican Population in the United States?
Total Mexican Population in the United States is 37,145,956.