Cities with the Largest Mexican Community in South Carolina
RELATED REPORTS & OPTIONS
Mexican
South Carolina
Compare Cities
Map of Cities with the Largest Mexican Community in South Carolina
0
8,000
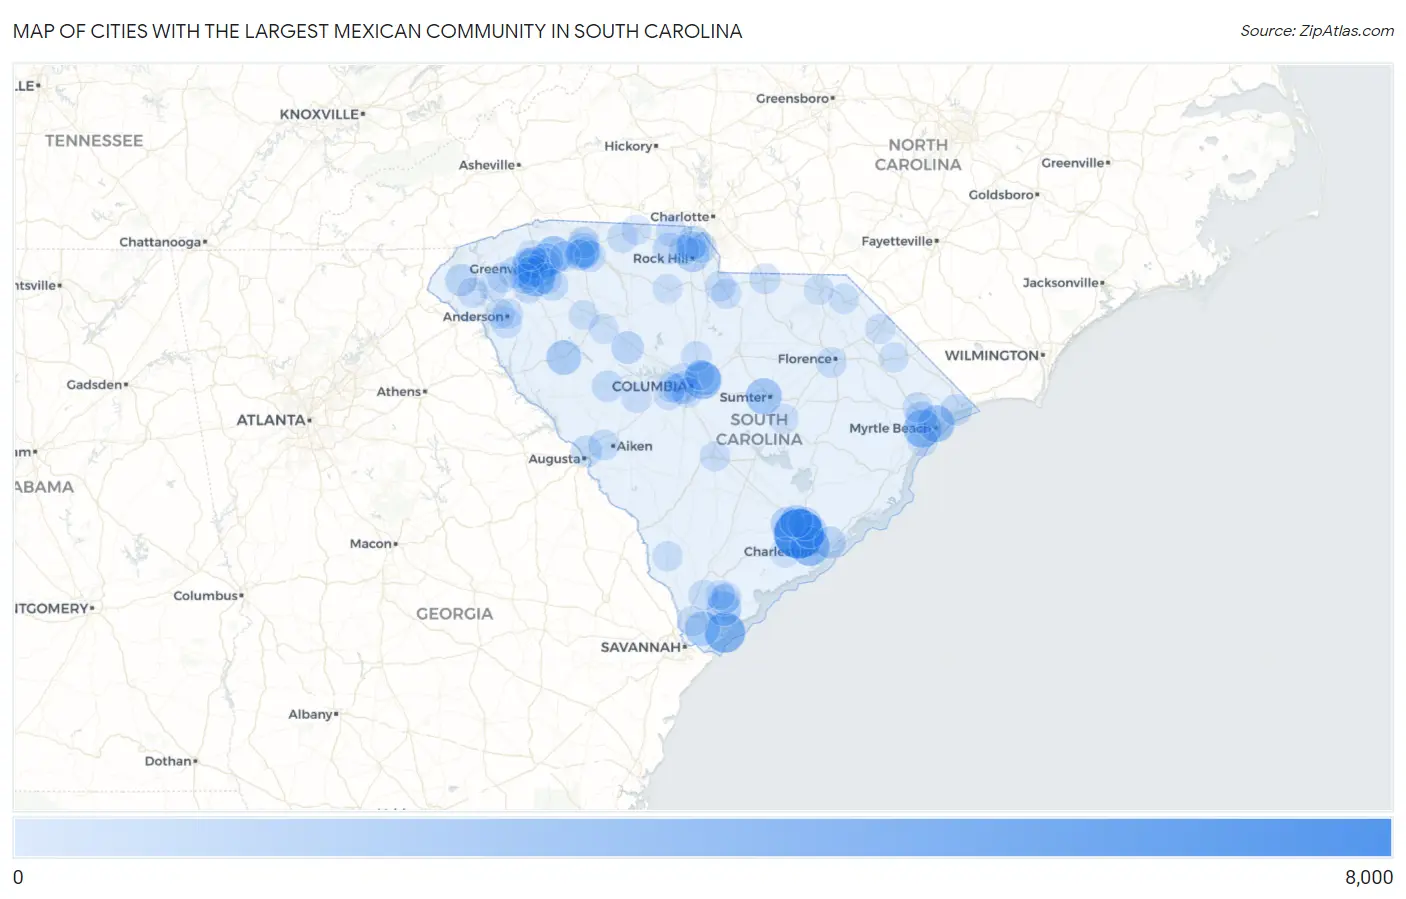
Cities with the Largest Mexican Community in South Carolina
| City | Mexican | vs State | vs National | |
| 1. | North Charleston | 6,655 | 157,028(4.24%)#1 | 37,145,956(0.02%)#746 |
| 2. | Hilton Head Island | 3,548 | 157,028(2.26%)#2 | 37,145,956(0.01%)#1,197 |
| 3. | Charleston | 3,129 | 157,028(1.99%)#3 | 37,145,956(0.01%)#1,329 |
| 4. | Columbia | 2,784 | 157,028(1.77%)#4 | 37,145,956(0.01%)#1,420 |
| 5. | Gantt | 2,676 | 157,028(1.70%)#5 | 37,145,956(0.01%)#1,460 |
| 6. | Socastee | 2,620 | 157,028(1.67%)#6 | 37,145,956(0.01%)#1,481 |
| 7. | Greer | 2,584 | 157,028(1.65%)#7 | 37,145,956(0.01%)#1,490 |
| 8. | Myrtle Beach | 2,330 | 157,028(1.48%)#8 | 37,145,956(0.01%)#1,617 |
| 9. | Sumter | 2,054 | 157,028(1.31%)#9 | 37,145,956(0.01%)#1,784 |
| 10. | Bluffton | 1,681 | 157,028(1.07%)#10 | 37,145,956(0.00%)#2,029 |
| 11. | Greenwood | 1,666 | 157,028(1.06%)#11 | 37,145,956(0.00%)#2,040 |
| 12. | Port Royal | 1,660 | 157,028(1.06%)#12 | 37,145,956(0.00%)#2,046 |
| 13. | Parker | 1,511 | 157,028(0.96%)#13 | 37,145,956(0.00%)#2,183 |
| 14. | Rock Hill | 1,470 | 157,028(0.94%)#14 | 37,145,956(0.00%)#2,214 |
| 15. | Hanahan | 1,400 | 157,028(0.89%)#15 | 37,145,956(0.00%)#2,290 |
| 16. | Southern Shops | 1,374 | 157,028(0.88%)#16 | 37,145,956(0.00%)#2,315 |
| 17. | Taylors | 1,330 | 157,028(0.85%)#17 | 37,145,956(0.00%)#2,353 |
| 18. | Summerville | 1,280 | 157,028(0.82%)#18 | 37,145,956(0.00%)#2,410 |
| 19. | Berea | 1,278 | 157,028(0.81%)#19 | 37,145,956(0.00%)#2,412 |
| 20. | Woodfield | 1,222 | 157,028(0.78%)#20 | 37,145,956(0.00%)#2,477 |
| 21. | Tega Cay | 1,197 | 157,028(0.76%)#21 | 37,145,956(0.00%)#2,508 |
| 22. | Goose Creek | 1,191 | 157,028(0.76%)#22 | 37,145,956(0.00%)#2,515 |
| 23. | Greenville | 1,180 | 157,028(0.75%)#23 | 37,145,956(0.00%)#2,534 |
| 24. | Wade Hampton | 967 | 157,028(0.62%)#24 | 37,145,956(0.00%)#2,893 |
| 25. | Ladson | 967 | 157,028(0.62%)#25 | 37,145,956(0.00%)#2,894 |
| 26. | Newberry | 955 | 157,028(0.61%)#26 | 37,145,956(0.00%)#2,913 |
| 27. | Welcome | 932 | 157,028(0.59%)#27 | 37,145,956(0.00%)#2,950 |
| 28. | West Columbia | 871 | 157,028(0.55%)#28 | 37,145,956(0.00%)#3,074 |
| 29. | Red Hill | 858 | 157,028(0.55%)#29 | 37,145,956(0.00%)#3,099 |
| 30. | Walhalla | 842 | 157,028(0.54%)#30 | 37,145,956(0.00%)#3,136 |
| 31. | Mount Pleasant | 781 | 157,028(0.50%)#31 | 37,145,956(0.00%)#3,285 |
| 32. | Easley | 724 | 157,028(0.46%)#32 | 37,145,956(0.00%)#3,450 |
| 33. | York | 687 | 157,028(0.44%)#33 | 37,145,956(0.00%)#3,538 |
| 34. | Carolina Forest | 686 | 157,028(0.44%)#34 | 37,145,956(0.00%)#3,541 |
| 35. | Sans Souci | 685 | 157,028(0.44%)#35 | 37,145,956(0.00%)#3,546 |
| 36. | Arcadia | 672 | 157,028(0.43%)#36 | 37,145,956(0.00%)#3,594 |
| 37. | Saxon | 670 | 157,028(0.43%)#37 | 37,145,956(0.00%)#3,603 |
| 38. | Boiling Springs | 641 | 157,028(0.41%)#38 | 37,145,956(0.00%)#3,701 |
| 39. | North Myrtle Beach | 638 | 157,028(0.41%)#39 | 37,145,956(0.00%)#3,712 |
| 40. | Judson | 624 | 157,028(0.40%)#40 | 37,145,956(0.00%)#3,762 |
| 41. | Simpsonville | 616 | 157,028(0.39%)#41 | 37,145,956(0.00%)#3,791 |
| 42. | Spartanburg | 602 | 157,028(0.38%)#42 | 37,145,956(0.00%)#3,841 |
| 43. | North Augusta | 599 | 157,028(0.38%)#43 | 37,145,956(0.00%)#3,851 |
| 44. | Piedmont | 590 | 157,028(0.38%)#44 | 37,145,956(0.00%)#3,889 |
| 45. | Saluda | 590 | 157,028(0.38%)#45 | 37,145,956(0.00%)#3,891 |
| 46. | Mauldin | 526 | 157,028(0.33%)#46 | 37,145,956(0.00%)#4,156 |
| 47. | Fort Mill | 516 | 157,028(0.33%)#47 | 37,145,956(0.00%)#4,195 |
| 48. | Arkwright | 492 | 157,028(0.31%)#48 | 37,145,956(0.00%)#4,309 |
| 49. | Burton | 473 | 157,028(0.30%)#49 | 37,145,956(0.00%)#4,404 |
| 50. | Homeland Park | 470 | 157,028(0.30%)#50 | 37,145,956(0.00%)#4,419 |
| 51. | St Andrews | 457 | 157,028(0.29%)#51 | 37,145,956(0.00%)#4,487 |
| 52. | Fairforest | 447 | 157,028(0.28%)#52 | 37,145,956(0.00%)#4,540 |
| 53. | East Camden | 435 | 157,028(0.28%)#53 | 37,145,956(0.00%)#4,613 |
| 54. | Graniteville | 424 | 157,028(0.27%)#54 | 37,145,956(0.00%)#4,689 |
| 55. | Clover | 414 | 157,028(0.26%)#55 | 37,145,956(0.00%)#4,755 |
| 56. | Pageland | 397 | 157,028(0.25%)#56 | 37,145,956(0.00%)#4,874 |
| 57. | Gaffney | 383 | 157,028(0.24%)#57 | 37,145,956(0.00%)#4,963 |
| 58. | Lancaster | 382 | 157,028(0.24%)#58 | 37,145,956(0.00%)#4,972 |
| 59. | Oak Grove | 377 | 157,028(0.24%)#59 | 37,145,956(0.00%)#5,005 |
| 60. | Ridgeland | 329 | 157,028(0.21%)#60 | 37,145,956(0.00%)#5,350 |
| 61. | Florence | 317 | 157,028(0.20%)#61 | 37,145,956(0.00%)#5,437 |
| 62. | Newport | 313 | 157,028(0.20%)#62 | 37,145,956(0.00%)#5,471 |
| 63. | Seneca | 302 | 157,028(0.19%)#63 | 37,145,956(0.00%)#5,565 |
| 64. | Litchfield Beach | 297 | 157,028(0.19%)#64 | 37,145,956(0.00%)#5,614 |
| 65. | Batesburg Leesville | 296 | 157,028(0.19%)#65 | 37,145,956(0.00%)#5,620 |
| 66. | Cayce | 269 | 157,028(0.17%)#66 | 37,145,956(0.00%)#5,883 |
| 67. | Duncan | 269 | 157,028(0.17%)#67 | 37,145,956(0.00%)#5,886 |
| 68. | Garden City | 266 | 157,028(0.17%)#68 | 37,145,956(0.00%)#5,917 |
| 69. | Beaufort | 265 | 157,028(0.17%)#69 | 37,145,956(0.00%)#5,925 |
| 70. | Red Bank | 261 | 157,028(0.17%)#70 | 37,145,956(0.00%)#5,968 |
| 71. | Elgin | 261 | 157,028(0.17%)#71 | 37,145,956(0.00%)#5,975 |
| 72. | Anderson | 259 | 157,028(0.16%)#72 | 37,145,956(0.00%)#5,985 |
| 73. | Blythewood | 259 | 157,028(0.16%)#73 | 37,145,956(0.00%)#5,987 |
| 74. | Powdersville | 258 | 157,028(0.16%)#74 | 37,145,956(0.00%)#5,995 |
| 75. | Lexington | 240 | 157,028(0.15%)#75 | 37,145,956(0.00%)#6,211 |
| 76. | Dentsville | 234 | 157,028(0.15%)#76 | 37,145,956(0.00%)#6,279 |
| 77. | Conway | 225 | 157,028(0.14%)#77 | 37,145,956(0.00%)#6,395 |
| 78. | Liberty | 223 | 157,028(0.14%)#78 | 37,145,956(0.00%)#6,429 |
| 79. | Wilkinson Heights | 220 | 157,028(0.14%)#79 | 37,145,956(0.00%)#6,469 |
| 80. | Hardeeville | 218 | 157,028(0.14%)#80 | 37,145,956(0.00%)#6,491 |
| 81. | Bennettsville | 217 | 157,028(0.14%)#81 | 37,145,956(0.00%)#6,506 |
| 82. | Estill | 214 | 157,028(0.14%)#82 | 37,145,956(0.00%)#6,568 |
| 83. | Watts Mills | 214 | 157,028(0.14%)#83 | 37,145,956(0.00%)#6,569 |
| 84. | Conestee | 203 | 157,028(0.13%)#84 | 37,145,956(0.00%)#6,734 |
| 85. | Unity | 198 | 157,028(0.13%)#85 | 37,145,956(0.00%)#6,802 |
| 86. | Hilltop | 194 | 157,028(0.12%)#86 | 37,145,956(0.00%)#6,858 |
| 87. | Central | 191 | 157,028(0.12%)#87 | 37,145,956(0.00%)#6,902 |
| 88. | Alcolu | 189 | 157,028(0.12%)#88 | 37,145,956(0.00%)#6,947 |
| 89. | Blacksburg | 188 | 157,028(0.12%)#89 | 37,145,956(0.00%)#6,962 |
| 90. | Ravenel | 180 | 157,028(0.11%)#90 | 37,145,956(0.00%)#7,092 |
| 91. | Whitney | 176 | 157,028(0.11%)#91 | 37,145,956(0.00%)#7,159 |
| 92. | Centerville | 169 | 157,028(0.11%)#92 | 37,145,956(0.00%)#7,265 |
| 93. | India Hook | 167 | 157,028(0.11%)#93 | 37,145,956(0.00%)#7,308 |
| 94. | Cheraw | 163 | 157,028(0.10%)#94 | 37,145,956(0.00%)#7,386 |
| 95. | Travelers Rest | 159 | 157,028(0.10%)#95 | 37,145,956(0.00%)#7,454 |
| 96. | Laurel Bay | 158 | 157,028(0.10%)#96 | 37,145,956(0.00%)#7,471 |
| 97. | Mullins | 156 | 157,028(0.10%)#97 | 37,145,956(0.00%)#7,514 |
| 98. | Gayle Mill | 149 | 157,028(0.09%)#98 | 37,145,956(0.00%)#7,649 |
| 99. | Dillon | 146 | 157,028(0.09%)#99 | 37,145,956(0.00%)#7,704 |
| 100. | Joanna | 146 | 157,028(0.09%)#100 | 37,145,956(0.00%)#7,712 |
Common Questions
What are the Top 10 Cities with the Largest Mexican Community in South Carolina?
Top 10 Cities with the Largest Mexican Community in South Carolina are:
#1
6,655
#2
3,548
#3
3,129
#4
2,784
#5
2,676
#6
2,620
#7
2,584
#8
2,330
#9
2,054
#10
1,681
What city has the Largest Mexican Community in South Carolina?
North Charleston has the Largest Mexican Community in South Carolina with 6,655.
What is the Total Mexican Population in the State of South Carolina?
Total Mexican Population in South Carolina is 157,028.
What is the Total Mexican Population in the United States?
Total Mexican Population in the United States is 37,145,956.