Cities with the Highest Poverty Level in Kansas
RELATED REPORTS & OPTIONS
Highest Poverty
Kansas
Compare Cities
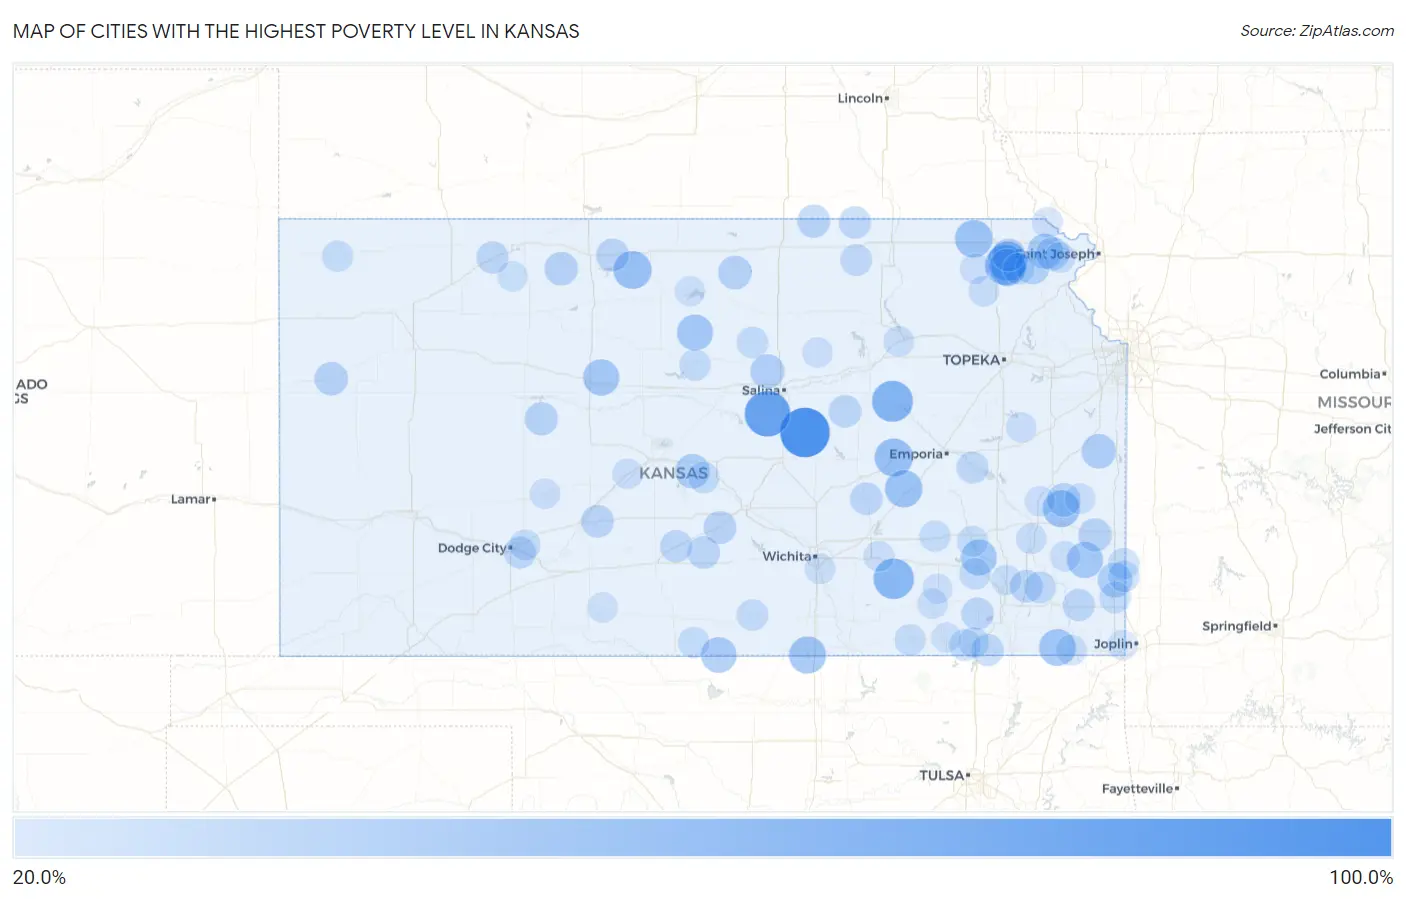
Map of Cities with the Highest Poverty Level in Kansas
0.0%
100.0%
Cities with the Highest Poverty Level in Kansas
| City | Poverty | vs State | vs National | |
| 1. | Shallow Water | 100.0% | 11.6%(+88.4)#1 | 12.5%(+87.5)#42 |
| 2. | Silverdale | 100.0% | 11.6%(+88.4)#2 | 12.5%(+87.5)#59 |
| 3. | Beaver | 100.0% | 11.6%(+88.4)#3 | 12.5%(+87.5)#89 |
| 4. | Roxbury | 100.0% | 11.6%(+88.4)#4 | 12.5%(+87.5)#108 |
| 5. | Falun | 83.8% | 11.6%(+72.2)#5 | 12.5%(+71.3)#173 |
| 6. | Parkerville | 65.5% | 11.6%(+53.9)#6 | 12.5%(+52.9)#384 |
| 7. | Latham | 63.5% | 11.6%(+52.0)#7 | 12.5%(+51.0)#430 |
| 8. | Kickapoo Site 7 | 61.3% | 11.6%(+49.7)#8 | 12.5%(+48.8)#481 |
| 9. | Kickapoo Site 1 | 59.6% | 11.6%(+48.0)#9 | 12.5%(+47.0)#533 |
| 10. | Elmdale | 54.0% | 11.6%(+42.4)#10 | 12.5%(+41.5)#703 |
| 11. | Murdock | 53.8% | 11.6%(+42.3)#11 | 12.5%(+41.3)#713 |
| 12. | Cedar | 53.8% | 11.6%(+42.3)#12 | 12.5%(+41.3)#715 |
| 13. | Oneida | 52.2% | 11.6%(+40.6)#13 | 12.5%(+39.7)#784 |
| 14. | Matfield Green | 51.8% | 11.6%(+40.2)#14 | 12.5%(+39.3)#810 |
| 15. | Kickapoo Tribal Center | 50.8% | 11.6%(+39.2)#15 | 12.5%(+38.2)#867 |
| 16. | Hunnewell | 50.0% | 11.6%(+38.4)#16 | 12.5%(+37.5)#908 |
| 17. | Mildred | 50.0% | 11.6%(+38.4)#17 | 12.5%(+37.5)#914 |
| 18. | Bartlett | 49.3% | 11.6%(+37.7)#18 | 12.5%(+36.7)#956 |
| 19. | Farlington | 48.4% | 11.6%(+36.9)#19 | 12.5%(+35.9)#1,007 |
| 20. | Catharine | 47.0% | 11.6%(+35.4)#20 | 12.5%(+34.4)#1,099 |
| 21. | Hepler | 46.8% | 11.6%(+35.3)#21 | 12.5%(+34.3)#1,105 |
| 22. | Hunter | 46.3% | 11.6%(+34.7)#22 | 12.5%(+33.8)#1,158 |
| 23. | Coyville | 46.0% | 11.6%(+34.4)#23 | 12.5%(+33.5)#1,182 |
| 24. | Waldron | 44.4% | 11.6%(+32.9)#24 | 12.5%(+31.9)#1,292 |
| 25. | Leona | 42.9% | 11.6%(+31.3)#25 | 12.5%(+30.3)#1,431 |
| 26. | Franklin | 40.7% | 11.6%(+29.1)#26 | 12.5%(+28.2)#1,613 |
| 27. | Fontana | 40.4% | 11.6%(+28.8)#27 | 12.5%(+27.8)#1,641 |
| 28. | Raymond | 40.4% | 11.6%(+28.8)#28 | 12.5%(+27.8)#1,642 |
| 29. | Culver | 38.9% | 11.6%(+27.3)#29 | 12.5%(+26.4)#1,802 |
| 30. | Kincaid | 37.3% | 11.6%(+25.8)#30 | 12.5%(+24.8)#2,003 |
| 31. | Everest | 37.3% | 11.6%(+25.7)#31 | 12.5%(+24.8)#2,004 |
| 32. | Randall | 37.0% | 11.6%(+25.4)#32 | 12.5%(+24.5)#2,066 |
| 33. | Logan | 36.5% | 11.6%(+24.9)#33 | 12.5%(+24.0)#2,136 |
| 34. | Wallace | 36.0% | 11.6%(+24.4)#34 | 12.5%(+23.5)#2,197 |
| 35. | Severance | 36.0% | 11.6%(+24.4)#35 | 12.5%(+23.5)#2,199 |
| 36. | Redfield | 35.9% | 11.6%(+24.3)#36 | 12.5%(+23.3)#2,219 |
| 37. | Brownell | 35.3% | 11.6%(+23.7)#37 | 12.5%(+22.8)#2,318 |
| 38. | Mahaska | 34.7% | 11.6%(+23.1)#38 | 12.5%(+22.2)#2,403 |
| 39. | Powhattan | 34.6% | 11.6%(+23.0)#39 | 12.5%(+22.0)#2,423 |
| 40. | Neal | 34.5% | 11.6%(+22.9)#40 | 12.5%(+21.9)#2,436 |
| 41. | Centropolis | 34.3% | 11.6%(+22.7)#41 | 12.5%(+21.8)#2,476 |
| 42. | Arlington | 34.1% | 11.6%(+22.5)#42 | 12.5%(+21.6)#2,512 |
| 43. | Agra | 33.7% | 11.6%(+22.1)#43 | 12.5%(+21.1)#2,593 |
| 44. | Navarre | 33.6% | 11.6%(+22.0)#44 | 12.5%(+21.0)#2,615 |
| 45. | Lewis | 33.5% | 11.6%(+21.9)#45 | 12.5%(+21.0)#2,632 |
| 46. | Thayer | 33.5% | 11.6%(+21.9)#46 | 12.5%(+20.9)#2,633 |
| 47. | Penalosa | 33.3% | 11.6%(+21.8)#47 | 12.5%(+20.8)#2,679 |
| 48. | Burns | 32.7% | 11.6%(+21.1)#48 | 12.5%(+20.1)#2,797 |
| 49. | Hope | 32.6% | 11.6%(+21.0)#49 | 12.5%(+20.1)#2,805 |
| 50. | Elk City | 32.2% | 11.6%(+20.6)#50 | 12.5%(+19.6)#2,916 |
| 51. | Tyro | 32.0% | 11.6%(+20.4)#51 | 12.5%(+19.5)#2,945 |
| 52. | Clayton | 32.0% | 11.6%(+20.4)#52 | 12.5%(+19.5)#2,954 |
| 53. | Preston | 32.0% | 11.6%(+20.4)#53 | 12.5%(+19.4)#2,970 |
| 54. | Mccune | 31.8% | 11.6%(+20.3)#54 | 12.5%(+19.3)#2,991 |
| 55. | Hollenberg | 31.6% | 11.6%(+20.0)#55 | 12.5%(+19.0)#3,066 |
| 56. | Wilroads Gardens | 31.2% | 11.6%(+19.7)#56 | 12.5%(+18.7)#3,129 |
| 57. | Hartford | 30.7% | 11.6%(+19.1)#57 | 12.5%(+18.2)#3,248 |
| 58. | Niotaze | 30.2% | 11.6%(+18.6)#58 | 12.5%(+17.7)#3,363 |
| 59. | Galesburg | 30.1% | 11.6%(+18.5)#59 | 12.5%(+17.6)#3,380 |
| 60. | Greenleaf | 29.7% | 11.6%(+18.1)#60 | 12.5%(+17.1)#3,478 |
| 61. | Ada | 29.4% | 11.6%(+17.8)#61 | 12.5%(+16.9)#3,555 |
| 62. | Pittsburg | 29.4% | 11.6%(+17.8)#62 | 12.5%(+16.9)#3,562 |
| 63. | Horton | 29.2% | 11.6%(+17.6)#63 | 12.5%(+16.6)#3,618 |
| 64. | Danville | 29.2% | 11.6%(+17.6)#64 | 12.5%(+16.6)#3,627 |
| 65. | Arcadia | 29.1% | 11.6%(+17.6)#65 | 12.5%(+16.6)#3,636 |
| 66. | Mulberry | 28.8% | 11.6%(+17.2)#66 | 12.5%(+16.2)#3,735 |
| 67. | Sylvan Grove | 28.7% | 11.6%(+17.1)#67 | 12.5%(+16.2)#3,753 |
| 68. | New Albany | 28.6% | 11.6%(+17.0)#68 | 12.5%(+16.0)#3,810 |
| 69. | Cedar Vale | 28.5% | 11.6%(+16.9)#69 | 12.5%(+16.0)#3,836 |
| 70. | Alden | 28.5% | 11.6%(+16.9)#70 | 12.5%(+15.9)#3,849 |
| 71. | Hazelton | 28.1% | 11.6%(+16.5)#71 | 12.5%(+15.6)#3,950 |
| 72. | Bird City | 27.9% | 11.6%(+16.4)#72 | 12.5%(+15.4)#3,995 |
| 73. | Eureka | 27.9% | 11.6%(+16.3)#73 | 12.5%(+15.3)#4,013 |
| 74. | Toronto | 27.5% | 11.6%(+15.9)#74 | 12.5%(+14.9)#4,170 |
| 75. | Havana | 27.3% | 11.6%(+15.7)#75 | 12.5%(+14.7)#4,218 |
| 76. | Wright | 27.1% | 11.6%(+15.5)#76 | 12.5%(+14.5)#4,294 |
| 77. | Manhattan | 26.4% | 11.6%(+14.9)#77 | 12.5%(+13.9)#4,504 |
| 78. | Chetopa | 26.1% | 11.6%(+14.5)#78 | 12.5%(+13.5)#4,638 |
| 79. | Circleville | 26.0% | 11.6%(+14.4)#79 | 12.5%(+13.5)#4,660 |
| 80. | Bendena | 26.0% | 11.6%(+14.4)#80 | 12.5%(+13.4)#4,691 |
| 81. | Humboldt | 25.8% | 11.6%(+14.2)#81 | 12.5%(+13.3)#4,730 |
| 82. | Leon | 25.8% | 11.6%(+14.2)#82 | 12.5%(+13.2)#4,747 |
| 83. | Hanston | 25.7% | 11.6%(+14.1)#83 | 12.5%(+13.1)#4,794 |
| 84. | White Cloud | 25.5% | 11.6%(+13.9)#84 | 12.5%(+12.9)#4,861 |
| 85. | Oaklawn Sunview | 25.3% | 11.6%(+13.7)#85 | 12.5%(+12.8)#4,928 |
| 86. | Blue Mound | 25.2% | 11.6%(+13.6)#86 | 12.5%(+12.7)#4,968 |
| 87. | Pawnee Rock | 25.2% | 11.6%(+13.6)#87 | 12.5%(+12.6)#4,978 |
| 88. | Moline | 25.1% | 11.6%(+13.6)#88 | 12.5%(+12.6)#4,986 |
| 89. | Stark | 25.0% | 11.6%(+13.4)#89 | 12.5%(+12.5)#5,065 |
| 90. | Manchester | 25.0% | 11.6%(+13.4)#90 | 12.5%(+12.5)#5,066 |
| 91. | Goff | 25.0% | 11.6%(+13.4)#91 | 12.5%(+12.5)#5,068 |
| 92. | Lenora | 24.9% | 11.6%(+13.3)#92 | 12.5%(+12.3)#5,108 |
| 93. | Colony | 24.9% | 11.6%(+13.3)#93 | 12.5%(+12.3)#5,114 |
| 94. | Altoona | 24.8% | 11.6%(+13.2)#94 | 12.5%(+12.3)#5,147 |
| 95. | Quenemo | 24.8% | 11.6%(+13.2)#95 | 12.5%(+12.3)#5,151 |
| 96. | Sedan | 24.4% | 11.6%(+12.9)#96 | 12.5%(+11.9)#5,295 |
| 97. | Wilmore | 24.2% | 11.6%(+12.7)#97 | 12.5%(+11.7)#5,377 |
| 98. | Cawker City | 24.0% | 11.6%(+12.4)#98 | 12.5%(+11.5)#5,462 |
| 99. | Galena | 24.0% | 11.6%(+12.4)#99 | 12.5%(+11.5)#5,469 |
| 100. | Howard | 23.9% | 11.6%(+12.3)#100 | 12.5%(+11.3)#5,523 |
Common Questions
What are the Top 10 Cities with the Highest Poverty Level in Kansas?
Top 10 Cities with the Highest Poverty Level in Kansas are:
#1
100.0%
#2
83.8%
#3
65.5%
#4
63.5%
#5
61.3%
#6
59.6%
#7
54.0%
#8
53.8%
#9
52.2%
#10
51.8%
What city has the Highest Poverty Level in Kansas?
Roxbury has the Highest Poverty Level in Kansas with 100.0%.
What is the Poverty Level in the State of Kansas?
Poverty Level in Kansas is 11.6%.
What is the Poverty Level in the United States?
Poverty Level in the United States is 12.5%.