Cities with the Highest Poverty Level in Connecticut
RELATED REPORTS & OPTIONS
Highest Poverty
Connecticut
Compare Cities
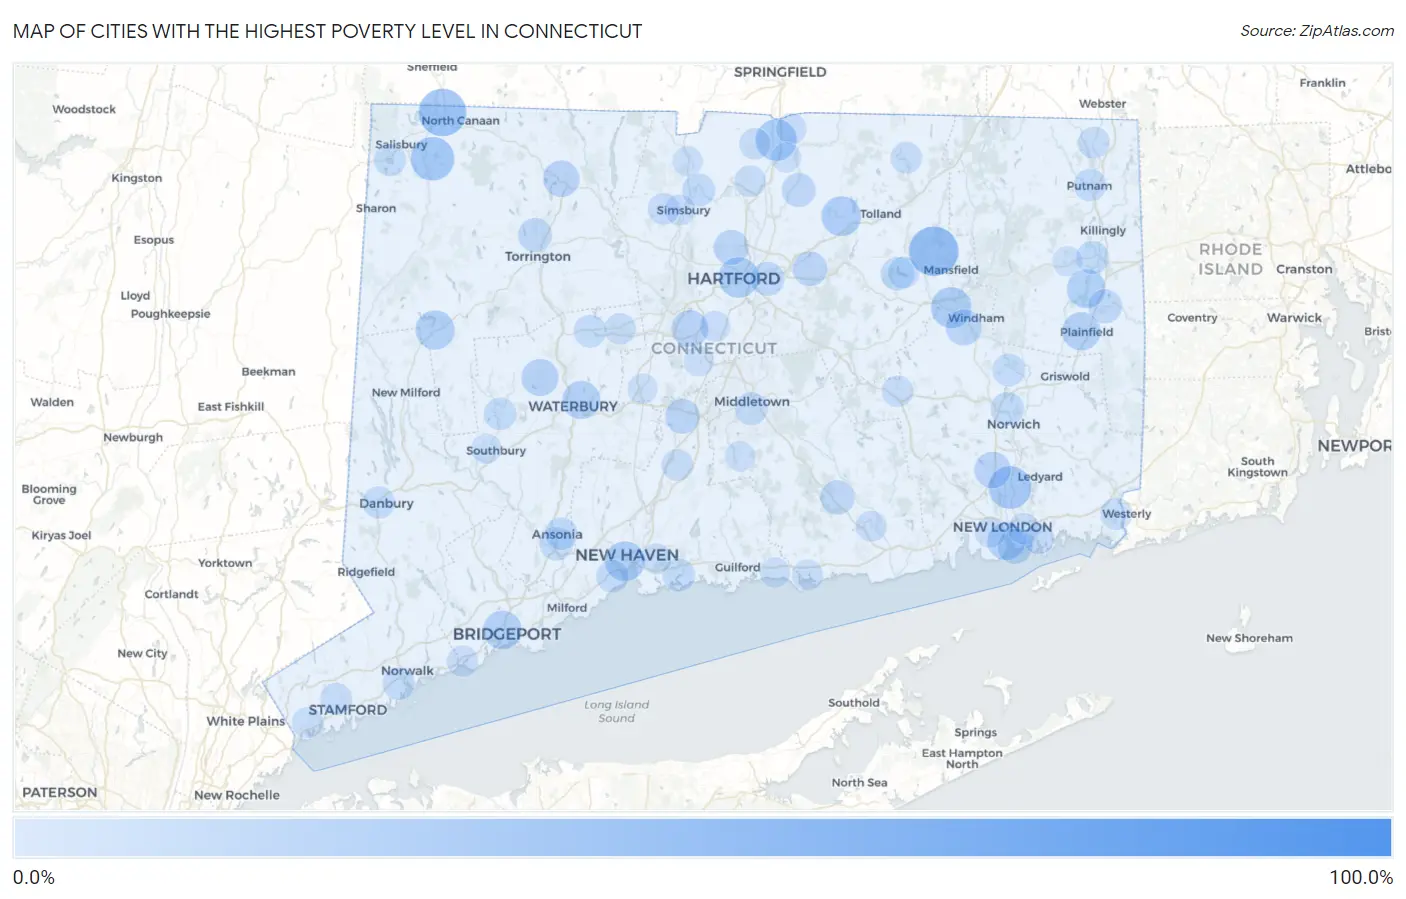
Map of Cities with the Highest Poverty Level in Connecticut
0.0%
100.0%
Cities with the Highest Poverty Level in Connecticut
| City | Poverty | vs State | vs National | |
| 1. | Fairfield University | 100.0% | 10.1%(+89.9)#1 | 12.5%(+87.5)#2 |
| 2. | Storrs | 44.7% | 10.1%(+34.6)#2 | 12.5%(+32.2)#1,271 |
| 3. | Canaan | 40.5% | 10.1%(+30.4)#3 | 12.5%(+28.0)#1,630 |
| 4. | West Cornwall | 37.0% | 10.1%(+26.9)#4 | 12.5%(+24.5)#2,057 |
| 5. | Taylor Corners | 35.5% | 10.1%(+25.4)#5 | 12.5%(+23.0)#2,281 |
| 6. | Pleasant Valley | 34.9% | 10.1%(+24.7)#6 | 12.5%(+22.3)#2,379 |
| 7. | Falls Village | 33.0% | 10.1%(+22.8)#7 | 12.5%(+20.4)#2,737 |
| 8. | Gales Ferry | 31.4% | 10.1%(+21.2)#8 | 12.5%(+18.8)#3,107 |
| 9. | Thompsonville | 28.7% | 10.1%(+18.6)#9 | 12.5%(+16.2)#3,756 |
| 10. | Cornwall Bridge | 27.9% | 10.1%(+17.8)#10 | 12.5%(+15.4)#3,991 |
| 11. | Willimantic | 27.3% | 10.1%(+17.1)#11 | 12.5%(+14.7)#4,225 |
| 12. | Hartford | 26.9% | 10.1%(+16.7)#12 | 12.5%(+14.3)#4,360 |
| 13. | New Haven | 25.3% | 10.1%(+15.1)#13 | 12.5%(+12.7)#4,939 |
| 14. | Rockville | 25.2% | 10.1%(+15.1)#14 | 12.5%(+12.7)#4,962 |
| 15. | Cornwall | 24.1% | 10.1%(+14.0)#15 | 12.5%(+11.6)#5,426 |
| 16. | New Preston | 24.1% | 10.1%(+13.9)#16 | 12.5%(+11.5)#5,435 |
| 17. | Wauregan | 23.2% | 10.1%(+13.1)#17 | 12.5%(+10.7)#5,844 |
| 18. | Bridgeport | 22.9% | 10.1%(+12.8)#18 | 12.5%(+10.4)#6,004 |
| 19. | Plainfield Village | 22.5% | 10.1%(+12.3)#19 | 12.5%(+9.95)#6,197 |
| 20. | Waterbury | 21.9% | 10.1%(+11.8)#20 | 12.5%(+9.38)#6,506 |
| 21. | Danielson Borough | 21.9% | 10.1%(+11.7)#21 | 12.5%(+9.34)#6,546 |
| 22. | New London | 21.5% | 10.1%(+11.4)#22 | 12.5%(+8.98)#6,758 |
| 23. | Watertown | 20.0% | 10.1%(+9.89)#23 | 12.5%(+7.49)#7,614 |
| 24. | New Britain | 19.7% | 10.1%(+9.56)#24 | 12.5%(+7.16)#7,835 |
| 25. | Winsted | 18.8% | 10.1%(+8.70)#25 | 12.5%(+6.31)#8,380 |
| 26. | Oxoboxo River | 18.8% | 10.1%(+8.64)#26 | 12.5%(+6.25)#8,423 |
| 27. | South Windham | 18.1% | 10.1%(+8.00)#27 | 12.5%(+5.61)#8,886 |
| 28. | Blue Hills | 16.4% | 10.1%(+6.27)#28 | 12.5%(+3.88)#10,283 |
| 29. | Topstone | 16.3% | 10.1%(+6.15)#29 | 12.5%(+3.76)#10,399 |
| 30. | Groton | 16.1% | 10.1%(+6.00)#30 | 12.5%(+3.61)#10,509 |
| 31. | Meriden | 15.7% | 10.1%(+5.54)#31 | 12.5%(+3.14)#10,901 |
| 32. | Manchester | 15.2% | 10.1%(+5.04)#32 | 12.5%(+2.65)#11,366 |
| 33. | Chester Center | 14.9% | 10.1%(+4.78)#33 | 12.5%(+2.39)#11,634 |
| 34. | Torrington | 14.6% | 10.1%(+4.47)#34 | 12.5%(+2.07)#11,934 |
| 35. | Moosup | 14.2% | 10.1%(+4.03)#35 | 12.5%(+1.64)#12,349 |
| 36. | Broad Brook | 14.0% | 10.1%(+3.85)#36 | 12.5%(+1.46)#12,514 |
| 37. | East Hartford | 13.7% | 10.1%(+3.57)#37 | 12.5%(+1.17)#12,772 |
| 38. | Derby | 13.4% | 10.1%(+3.27)#38 | 12.5%(+0.878)#13,068 |
| 39. | Coventry Lake | 13.1% | 10.1%(+3.01)#39 | 12.5%(+0.615)#13,349 |
| 40. | Norwich | 13.1% | 10.1%(+2.92)#40 | 12.5%(+0.531)#13,421 |
| 41. | Candlewood Shores | 12.4% | 10.1%(+2.26)#41 | 12.5%(-0.134)#14,136 |
| 42. | Jewett City Borough | 12.2% | 10.1%(+2.10)#42 | 12.5%(-0.295)#14,305 |
| 43. | Tariffville | 12.2% | 10.1%(+2.04)#43 | 12.5%(-0.351)#14,346 |
| 44. | East Brooklyn | 12.0% | 10.1%(+1.90)#44 | 12.5%(-0.491)#14,505 |
| 45. | Middletown | 11.9% | 10.1%(+1.79)#45 | 12.5%(-0.608)#14,638 |
| 46. | Baltic | 11.9% | 10.1%(+1.73)#46 | 12.5%(-0.663)#14,702 |
| 47. | Branford Center | 11.9% | 10.1%(+1.71)#47 | 12.5%(-0.680)#14,737 |
| 48. | Ansonia | 11.4% | 10.1%(+1.22)#48 | 12.5%(-1.17)#15,332 |
| 49. | Woodbury Center | 11.3% | 10.1%(+1.21)#49 | 12.5%(-1.19)#15,360 |
| 50. | Terryville | 11.3% | 10.1%(+1.20)#50 | 12.5%(-1.20)#15,378 |
| 51. | West Haven | 11.3% | 10.1%(+1.12)#51 | 12.5%(-1.27)#15,461 |
| 52. | Norwalk | 10.9% | 10.1%(+0.727)#52 | 12.5%(-1.67)#15,971 |
| 53. | Groton Long Point Borough | 10.8% | 10.1%(+0.691)#53 | 12.5%(-1.70)#16,022 |
| 54. | Putnam | 10.7% | 10.1%(+0.580)#54 | 12.5%(-1.81)#16,164 |
| 55. | Noroton Heights | 10.7% | 10.1%(+0.538)#55 | 12.5%(-1.86)#16,212 |
| 56. | Danbury | 10.6% | 10.1%(+0.421)#56 | 12.5%(-1.97)#16,363 |
| 57. | Lakeville | 10.5% | 10.1%(+0.356)#57 | 12.5%(-2.04)#16,443 |
| 58. | Pawcatuck | 10.5% | 10.1%(+0.326)#58 | 12.5%(-2.07)#16,481 |
| 59. | Redding Center | 10.5% | 10.1%(+0.324)#59 | 12.5%(-2.07)#16,485 |
| 60. | Dayville | 10.3% | 10.1%(+0.204)#60 | 12.5%(-2.19)#16,629 |
| 61. | Stamford | 10.1% | 10.1%(-0.020)#61 | 12.5%(-2.41)#16,917 |
| 62. | Wallingford Center | 9.8% | 10.1%(-0.371)#62 | 12.5%(-2.76)#17,376 |
| 63. | North Grosvenor Dale | 9.7% | 10.1%(-0.461)#63 | 12.5%(-2.85)#17,494 |
| 64. | South Coventry | 9.4% | 10.1%(-0.740)#64 | 12.5%(-3.13)#17,858 |
| 65. | Bristol | 9.4% | 10.1%(-0.747)#65 | 12.5%(-3.14)#17,870 |
| 66. | Suffield Depot | 9.3% | 10.1%(-0.809)#66 | 12.5%(-3.20)#17,945 |
| 67. | West Simsbury | 9.3% | 10.1%(-0.838)#67 | 12.5%(-3.23)#17,986 |
| 68. | Stafford Springs | 9.1% | 10.1%(-1.06)#68 | 12.5%(-3.45)#18,286 |
| 69. | Colchester | 9.0% | 10.1%(-1.10)#69 | 12.5%(-3.49)#18,315 |
| 70. | Long Hill | 9.0% | 10.1%(-1.13)#70 | 12.5%(-3.52)#18,360 |
| 71. | Windsor Locks | 9.0% | 10.1%(-1.13)#71 | 12.5%(-3.53)#18,373 |
| 72. | West Mountain | 9.0% | 10.1%(-1.16)#72 | 12.5%(-3.55)#18,410 |
| 73. | Southport | 8.8% | 10.1%(-1.36)#73 | 12.5%(-3.76)#18,692 |
| 74. | Oronoque | 8.1% | 10.1%(-2.08)#74 | 12.5%(-4.48)#19,678 |
| 75. | Bantam Borough | 8.0% | 10.1%(-2.11)#75 | 12.5%(-4.50)#19,702 |
| 76. | Greenwich | 8.0% | 10.1%(-2.14)#76 | 12.5%(-4.54)#19,747 |
| 77. | Clinton | 7.9% | 10.1%(-2.20)#77 | 12.5%(-4.59)#19,802 |
| 78. | Essex Village | 7.9% | 10.1%(-2.25)#78 | 12.5%(-4.64)#19,880 |
| 79. | Compo | 7.8% | 10.1%(-2.36)#79 | 12.5%(-4.76)#20,047 |
| 80. | Lordship | 7.7% | 10.1%(-2.40)#80 | 12.5%(-4.79)#20,105 |
| 81. | Simsbury Center | 7.7% | 10.1%(-2.43)#81 | 12.5%(-4.83)#20,152 |
| 82. | Newington | 7.7% | 10.1%(-2.46)#82 | 12.5%(-4.85)#20,191 |
| 83. | Tokeneke | 7.6% | 10.1%(-2.53)#83 | 12.5%(-4.92)#20,272 |
| 84. | Waterford | 7.6% | 10.1%(-2.54)#84 | 12.5%(-4.93)#20,283 |
| 85. | Poquonock Bridge | 7.5% | 10.1%(-2.60)#85 | 12.5%(-4.99)#20,373 |
| 86. | Sherwood Manor | 7.4% | 10.1%(-2.77)#86 | 12.5%(-5.16)#20,613 |
| 87. | Durham | 7.3% | 10.1%(-2.82)#87 | 12.5%(-5.21)#20,682 |
| 88. | East Haven | 7.3% | 10.1%(-2.85)#88 | 12.5%(-5.25)#20,731 |
| 89. | Salmon Brook | 7.0% | 10.1%(-3.11)#89 | 12.5%(-5.50)#21,083 |
| 90. | Kensington | 7.0% | 10.1%(-3.13)#90 | 12.5%(-5.52)#21,117 |
| 91. | Plantsville | 6.9% | 10.1%(-3.28)#91 | 12.5%(-5.67)#21,355 |
| 92. | Madison Center | 6.8% | 10.1%(-3.34)#92 | 12.5%(-5.74)#21,445 |
| 93. | Brooklyn | 6.7% | 10.1%(-3.40)#93 | 12.5%(-5.80)#21,526 |
| 94. | Heritage Village | 6.7% | 10.1%(-3.46)#94 | 12.5%(-5.86)#21,597 |
| 95. | Indian Field | 6.7% | 10.1%(-3.49)#95 | 12.5%(-5.88)#21,649 |
| 96. | Staples | 6.6% | 10.1%(-3.50)#96 | 12.5%(-5.89)#21,664 |
| 97. | Stratford Downtown | 6.6% | 10.1%(-3.51)#97 | 12.5%(-5.90)#21,678 |
| 98. | Ball Pond | 6.6% | 10.1%(-3.53)#98 | 12.5%(-5.92)#21,705 |
| 99. | Southwood Acres | 6.6% | 10.1%(-3.53)#99 | 12.5%(-5.93)#21,714 |
| 100. | Stonington Borough | 6.6% | 10.1%(-3.56)#100 | 12.5%(-5.95)#21,745 |
1
2Common Questions
What are the Top 10 Cities with the Highest Poverty Level in Connecticut?
Top 10 Cities with the Highest Poverty Level in Connecticut are:
#1
44.7%
#2
40.5%
#3
33.0%
#4
31.4%
#5
28.7%
#6
27.3%
#7
26.9%
#8
25.3%
#9
25.2%
#10
24.1%
What city has the Highest Poverty Level in Connecticut?
Storrs has the Highest Poverty Level in Connecticut with 44.7%.
What is the Poverty Level in the State of Connecticut?
Poverty Level in Connecticut is 10.1%.
What is the Poverty Level in the United States?
Poverty Level in the United States is 12.5%.