Cities with the Highest Poverty Level in Montana
RELATED REPORTS & OPTIONS
Highest Poverty
Montana
Compare Cities
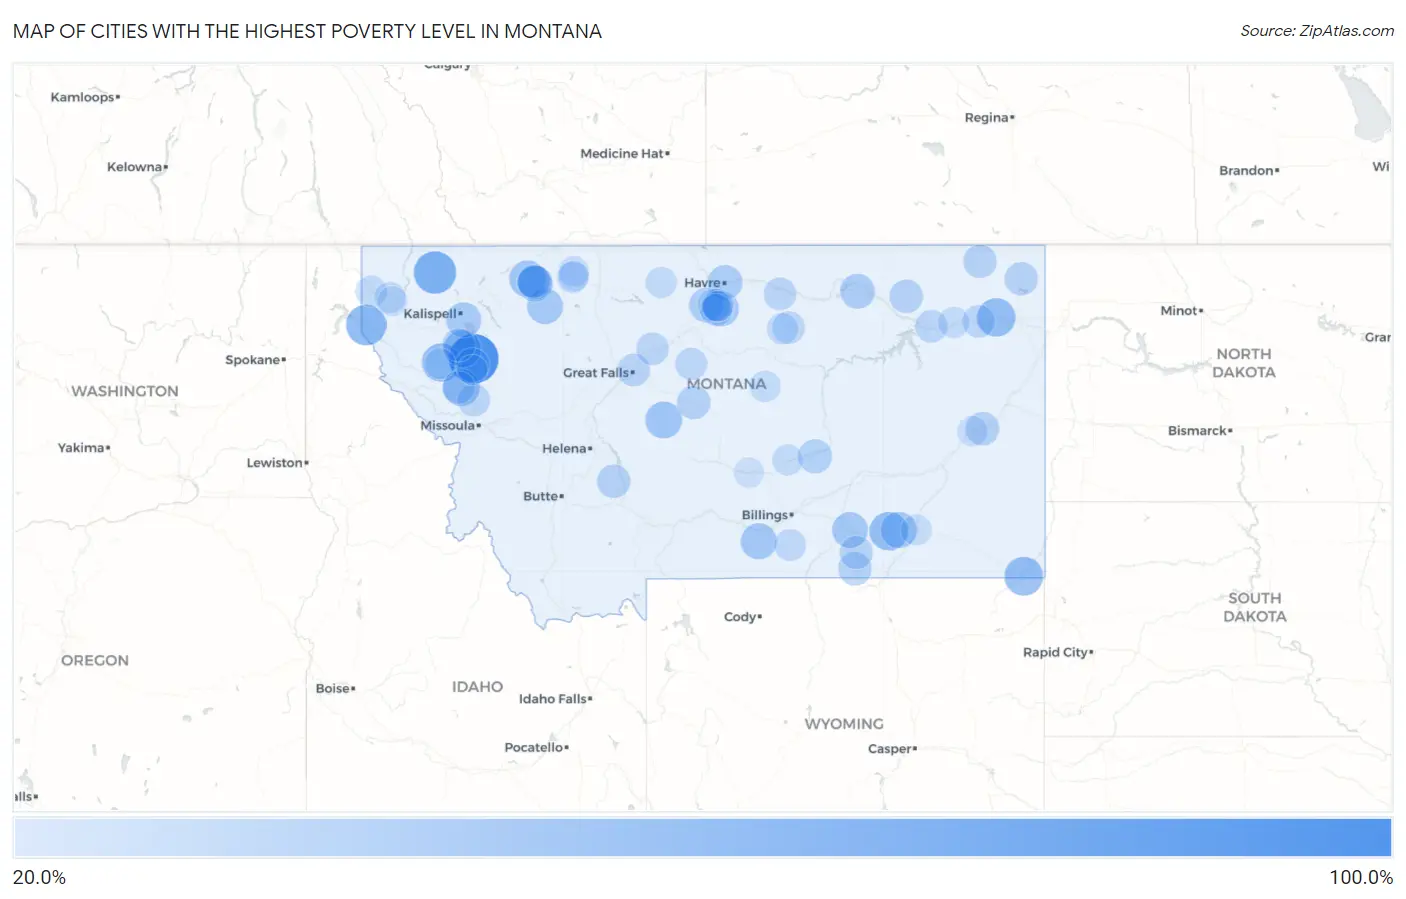
Map of Cities with the Highest Poverty Level in Montana
0.0%
100.0%
Cities with the Highest Poverty Level in Montana
| City | Poverty | vs State | vs National | |
| 1. | Turtle Lake | 100.0% | 12.4%(+87.6)#1 | 12.5%(+87.5)#21 |
| 2. | Argenta | 100.0% | 12.4%(+87.6)#2 | 12.5%(+87.5)#29 |
| 3. | Eagle Creek Colony | 100.0% | 12.4%(+87.6)#3 | 12.5%(+87.5)#43 |
| 4. | Pleasant Valley Colony | 100.0% | 12.4%(+87.6)#4 | 12.5%(+87.5)#52 |
| 5. | Midway Colony | 100.0% | 12.4%(+87.6)#5 | 12.5%(+87.5)#64 |
| 6. | Sage Creek Colony | 100.0% | 12.4%(+87.6)#6 | 12.5%(+87.5)#75 |
| 7. | Cascade Colony | 100.0% | 12.4%(+87.6)#7 | 12.5%(+87.5)#76 |
| 8. | Martinsdale Colony | 100.0% | 12.4%(+87.6)#8 | 12.5%(+87.5)#82 |
| 9. | Warm Spring Creek | 100.0% | 12.4%(+87.6)#9 | 12.5%(+87.5)#94 |
| 10. | Loring Colony | 100.0% | 12.4%(+87.6)#10 | 12.5%(+87.5)#95 |
| 11. | Surprise Creek Colony | 100.0% | 12.4%(+87.6)#11 | 12.5%(+87.5)#100 |
| 12. | Kingsbury Colony | 100.0% | 12.4%(+87.6)#12 | 12.5%(+87.5)#103 |
| 13. | Riverview Colony | 90.6% | 12.4%(+78.2)#13 | 12.5%(+78.0)#144 |
| 14. | Birch Creek Colony | 88.1% | 12.4%(+75.7)#14 | 12.5%(+75.6)#155 |
| 15. | Turner Colony | 82.5% | 12.4%(+70.1)#15 | 12.5%(+70.0)#180 |
| 16. | Nibbe | 78.9% | 12.4%(+66.5)#16 | 12.5%(+66.4)#206 |
| 17. | Camrose Colony | 78.9% | 12.4%(+66.5)#17 | 12.5%(+66.4)#208 |
| 18. | Stryker | 71.4% | 12.4%(+59.0)#18 | 12.5%(+58.9)#296 |
| 19. | New Rockport Colony | 70.6% | 12.4%(+58.2)#19 | 12.5%(+58.1)#311 |
| 20. | New Miami Colony | 68.5% | 12.4%(+56.1)#20 | 12.5%(+56.0)#337 |
| 21. | Big Stone Colony | 67.7% | 12.4%(+55.3)#21 | 12.5%(+55.2)#348 |
| 22. | Ayers Ranch Colony | 64.1% | 12.4%(+51.7)#22 | 12.5%(+51.6)#414 |
| 23. | Heron | 63.9% | 12.4%(+51.5)#23 | 12.5%(+51.3)#422 |
| 24. | Glacier Colony | 59.8% | 12.4%(+47.4)#24 | 12.5%(+47.3)#525 |
| 25. | Alzada | 57.1% | 12.4%(+44.7)#25 | 12.5%(+44.6)#589 |
| 26. | Muddy | 56.8% | 12.4%(+44.4)#26 | 12.5%(+44.3)#596 |
| 27. | Camas | 56.8% | 12.4%(+44.3)#27 | 12.5%(+44.2)#598 |
| 28. | Brockton | 56.4% | 12.4%(+44.0)#28 | 12.5%(+43.9)#614 |
| 29. | Big Arm | 51.8% | 12.4%(+39.4)#29 | 12.5%(+39.3)#809 |
| 30. | Old Agency | 50.6% | 12.4%(+38.2)#30 | 12.5%(+38.1)#877 |
| 31. | Rimrock Colony | 50.0% | 12.4%(+37.6)#31 | 12.5%(+37.5)#905 |
| 32. | Neihart | 50.0% | 12.4%(+37.6)#32 | 12.5%(+37.5)#909 |
| 33. | St. Mary | 49.3% | 12.4%(+36.9)#33 | 12.5%(+36.8)#954 |
| 34. | Canyon Creek | 49.2% | 12.4%(+36.7)#34 | 12.5%(+36.6)#962 |
| 35. | Starr School | 49.1% | 12.4%(+36.7)#35 | 12.5%(+36.5)#966 |
| 36. | Moccasin | 48.3% | 12.4%(+35.9)#36 | 12.5%(+35.7)#1,019 |
| 37. | Norris | 47.7% | 12.4%(+35.3)#37 | 12.5%(+35.2)#1,041 |
| 38. | Lame Deer | 47.5% | 12.4%(+35.1)#38 | 12.5%(+35.0)#1,057 |
| 39. | Boyd | 47.2% | 12.4%(+34.8)#39 | 12.5%(+34.7)#1,077 |
| 40. | Golden Valley Colony | 46.7% | 12.4%(+34.3)#40 | 12.5%(+34.1)#1,126 |
| 41. | Heart Butte | 46.4% | 12.4%(+33.9)#41 | 12.5%(+33.8)#1,153 |
| 42. | Crow Agency | 46.2% | 12.4%(+33.7)#42 | 12.5%(+33.6)#1,170 |
| 43. | South Browning | 45.7% | 12.4%(+33.3)#43 | 12.5%(+33.2)#1,200 |
| 44. | Centerville | 44.4% | 12.4%(+32.0)#45 | 12.5%(+31.9)#1,293 |
| 45. | Danvers | 44.4% | 12.4%(+32.0)#46 | 12.5%(+31.9)#1,294 |
| 46. | Parker School | 44.2% | 12.4%(+31.8)#47 | 12.5%(+31.7)#1,311 |
| 47. | Forest Hill Village | 43.9% | 12.4%(+31.4)#48 | 12.5%(+31.3)#1,335 |
| 48. | Pendroy | 43.8% | 12.4%(+31.3)#49 | 12.5%(+31.2)#1,345 |
| 49. | Havre North | 42.8% | 12.4%(+30.4)#50 | 12.5%(+30.3)#1,437 |
| 50. | Saco | 42.6% | 12.4%(+30.2)#51 | 12.5%(+30.1)#1,451 |
| 51. | Rocky Boy West | 41.4% | 12.4%(+29.0)#52 | 12.5%(+28.9)#1,570 |
| 52. | Browning | 40.0% | 12.4%(+27.6)#53 | 12.5%(+27.4)#1,693 |
| 53. | Musselshell | 39.4% | 12.4%(+27.0)#54 | 12.5%(+26.9)#1,754 |
| 54. | Pablo | 38.9% | 12.4%(+26.5)#55 | 12.5%(+26.4)#1,801 |
| 55. | St Marie | 37.6% | 12.4%(+25.2)#56 | 12.5%(+25.1)#1,959 |
| 56. | Stanford | 37.6% | 12.4%(+25.1)#57 | 12.5%(+25.0)#1,970 |
| 57. | Fallon | 37.5% | 12.4%(+25.1)#58 | 12.5%(+25.0)#1,973 |
| 58. | Twodot | 37.5% | 12.4%(+25.1)#59 | 12.5%(+25.0)#1,983 |
| 59. | Wyola | 37.5% | 12.4%(+25.0)#60 | 12.5%(+24.9)#1,988 |
| 60. | Radersburg | 37.3% | 12.4%(+24.9)#61 | 12.5%(+24.8)#2,005 |
| 61. | Flaxville | 37.1% | 12.4%(+24.7)#62 | 12.5%(+24.6)#2,046 |
| 62. | Reserve | 37.0% | 12.4%(+24.6)#63 | 12.5%(+24.5)#2,059 |
| 63. | Bull Lake | 36.6% | 12.4%(+24.2)#64 | 12.5%(+24.1)#2,123 |
| 64. | Lodge Grass | 36.4% | 12.4%(+24.0)#65 | 12.5%(+23.8)#2,150 |
| 65. | Elmo | 36.1% | 12.4%(+23.7)#66 | 12.5%(+23.6)#2,177 |
| 66. | North Browning | 35.7% | 12.4%(+23.3)#67 | 12.5%(+23.1)#2,256 |
| 67. | Black Eagle | 34.7% | 12.4%(+22.3)#68 | 12.5%(+22.1)#2,408 |
| 68. | Fort Belknap Agency | 34.4% | 12.4%(+21.9)#69 | 12.5%(+21.8)#2,462 |
| 69. | Arlee | 34.3% | 12.4%(+21.8)#70 | 12.5%(+21.7)#2,481 |
| 70. | Acton | 34.2% | 12.4%(+21.8)#71 | 12.5%(+21.6)#2,498 |
| 71. | Poplar | 34.2% | 12.4%(+21.8)#72 | 12.5%(+21.6)#2,500 |
| 72. | Frazer | 34.1% | 12.4%(+21.7)#73 | 12.5%(+21.5)#2,516 |
| 73. | Carter | 34.0% | 12.4%(+21.6)#74 | 12.5%(+21.5)#2,526 |
| 74. | Boneau | 34.0% | 12.4%(+21.6)#75 | 12.5%(+21.5)#2,528 |
| 75. | Azure | 33.7% | 12.4%(+21.3)#76 | 12.5%(+21.1)#2,592 |
| 76. | Lodge Pole | 33.5% | 12.4%(+21.1)#77 | 12.5%(+20.9)#2,634 |
| 77. | Dixon | 33.3% | 12.4%(+20.9)#78 | 12.5%(+20.8)#2,652 |
| 78. | Geraldine | 32.4% | 12.4%(+20.0)#79 | 12.5%(+19.9)#2,846 |
| 79. | St Pierre | 32.4% | 12.4%(+20.0)#80 | 12.5%(+19.9)#2,853 |
| 80. | Pryor | 31.1% | 12.4%(+18.7)#81 | 12.5%(+18.6)#3,155 |
| 81. | Rimini | 30.3% | 12.4%(+17.9)#82 | 12.5%(+17.8)#3,335 |
| 82. | Sapphire Ridge | 30.0% | 12.4%(+17.6)#83 | 12.5%(+17.5)#3,408 |
| 83. | Troy | 29.7% | 12.4%(+17.3)#84 | 12.5%(+17.2)#3,457 |
| 84. | Hays | 29.7% | 12.4%(+17.3)#85 | 12.5%(+17.1)#3,474 |
| 85. | Joplin | 29.5% | 12.4%(+17.1)#86 | 12.5%(+17.0)#3,528 |
| 86. | Roy | 29.4% | 12.4%(+17.0)#87 | 12.5%(+16.8)#3,570 |
| 87. | Libby | 29.2% | 12.4%(+16.7)#88 | 12.5%(+16.6)#3,631 |
| 88. | Lakeview | 29.0% | 12.4%(+16.6)#89 | 12.5%(+16.5)#3,667 |
| 89. | Little Browning | 28.8% | 12.4%(+16.4)#90 | 12.5%(+16.3)#3,726 |
| 90. | Wolf Point | 28.7% | 12.4%(+16.3)#91 | 12.5%(+16.2)#3,760 |
| 91. | Camp Three | 28.5% | 12.4%(+16.1)#92 | 12.5%(+15.9)#3,841 |
| 92. | Ashland | 28.0% | 12.4%(+15.6)#93 | 12.5%(+15.5)#3,966 |
| 93. | Hot Springs | 27.5% | 12.4%(+15.1)#94 | 12.5%(+15.0)#4,157 |
| 94. | Sangrey | 26.9% | 12.4%(+14.5)#95 | 12.5%(+14.4)#4,333 |
| 95. | Santa Rita | 26.9% | 12.4%(+14.5)#96 | 12.5%(+14.4)#4,346 |
| 96. | Cut Bank | 26.7% | 12.4%(+14.3)#97 | 12.5%(+14.2)#4,397 |
| 97. | Terry | 26.6% | 12.4%(+14.1)#98 | 12.5%(+14.0)#4,470 |
| 98. | Ryegate | 25.7% | 12.4%(+13.3)#99 | 12.5%(+13.2)#4,768 |
| 99. | White Haven | 25.3% | 12.4%(+12.9)#100 | 12.5%(+12.8)#4,925 |
| 100. | Ronan | 25.3% | 12.4%(+12.9)#101 | 12.5%(+12.7)#4,933 |
Common Questions
What are the Top 10 Cities with the Highest Poverty Level in Montana?
Top 10 Cities with the Highest Poverty Level in Montana are:
#1
100.0%
#2
71.4%
#3
63.9%
#4
57.1%
#5
56.8%
#6
56.8%
#7
56.4%
#8
51.8%
#9
50.6%
#10
50.0%
What city has the Highest Poverty Level in Montana?
Turtle Lake has the Highest Poverty Level in Montana with 100.0%.
What is the Poverty Level in the State of Montana?
Poverty Level in Montana is 12.4%.
What is the Poverty Level in the United States?
Poverty Level in the United States is 12.5%.