Cities with the Highest Poverty Level in Texas
RELATED REPORTS & OPTIONS
Highest Poverty
Texas
Compare Cities
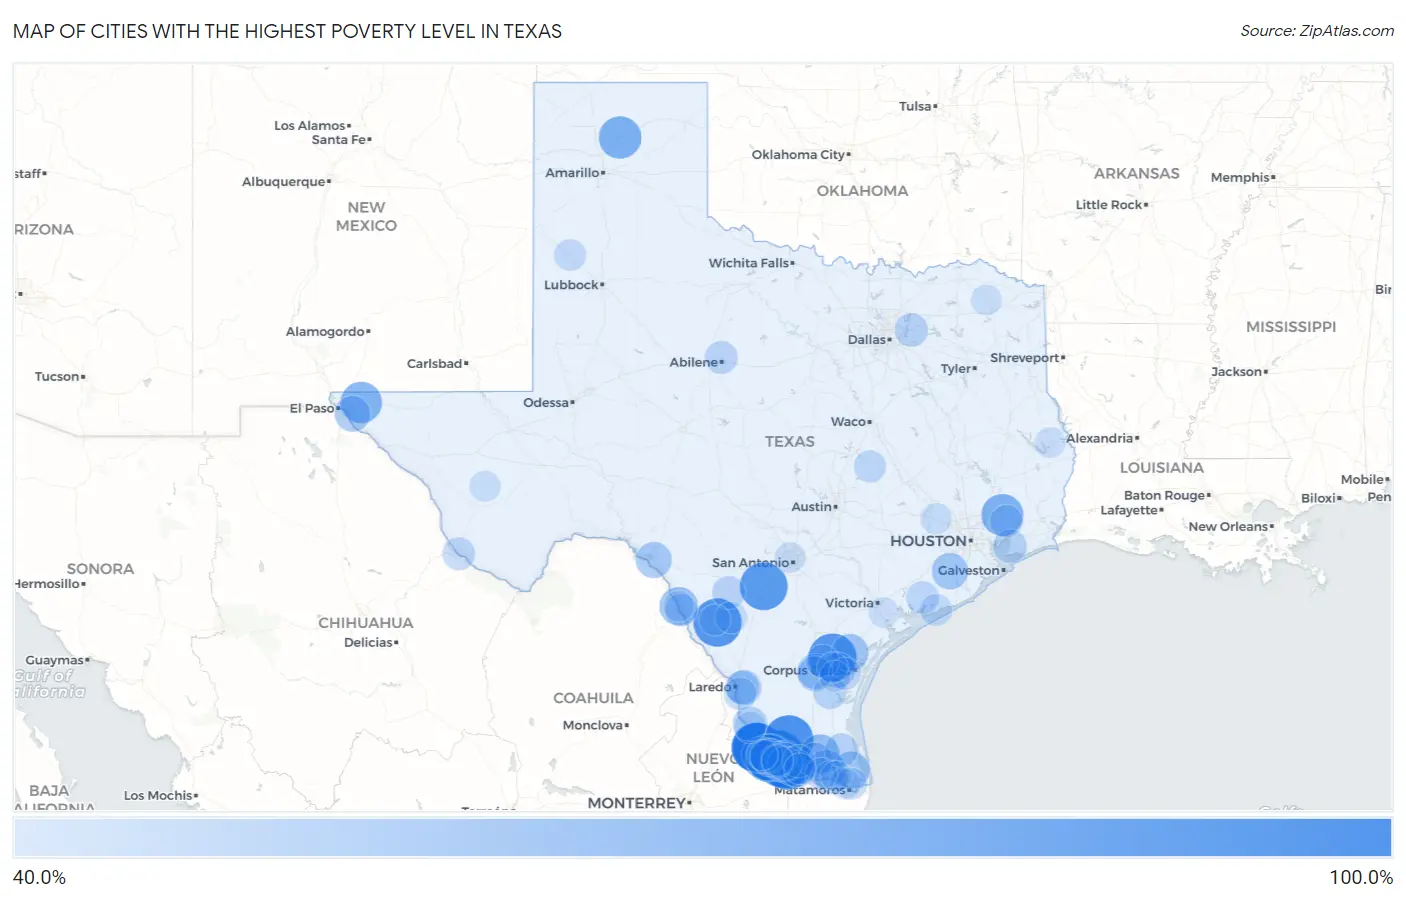
Map of Cities with the Highest Poverty Level in Texas
0.0%
100.0%
Cities with the Highest Poverty Level in Texas
| City | Poverty | vs State | vs National | |
| 1. | Hilltop Cdp Starr County | 100.0% | 13.9%(+86.1)#1 | 12.5%(+87.5)#11 |
| 2. | La Esperanza | 100.0% | 13.9%(+86.1)#2 | 12.5%(+87.5)#12 |
| 3. | North Escobares | 100.0% | 13.9%(+86.1)#3 | 12.5%(+87.5)#13 |
| 4. | El Castillo | 100.0% | 13.9%(+86.1)#4 | 12.5%(+87.5)#20 |
| 5. | El Quiote | 100.0% | 13.9%(+86.1)#5 | 12.5%(+87.5)#24 |
| 6. | Quesada | 100.0% | 13.9%(+86.1)#6 | 12.5%(+87.5)#39 |
| 7. | La Loma De Falcon | 100.0% | 13.9%(+86.1)#7 | 12.5%(+87.5)#48 |
| 8. | Normandy | 100.0% | 13.9%(+86.1)#8 | 12.5%(+87.5)#51 |
| 9. | Los Ebanos Cdp Hidalgo County | 100.0% | 13.9%(+86.1)#9 | 12.5%(+87.5)#54 |
| 10. | Acala | 100.0% | 13.9%(+86.1)#10 | 12.5%(+87.5)#65 |
| 11. | Victoria Vera | 100.0% | 13.9%(+86.1)#11 | 12.5%(+87.5)#72 |
| 12. | Palo Blanco | 100.0% | 13.9%(+86.1)#12 | 12.5%(+87.5)#86 |
| 13. | Clay | 100.0% | 13.9%(+86.1)#13 | 12.5%(+87.5)#87 |
| 14. | Falconaire | 100.0% | 13.9%(+86.1)#14 | 12.5%(+87.5)#88 |
| 15. | Chapeno | 100.0% | 13.9%(+86.1)#15 | 12.5%(+87.5)#91 |
| 16. | Rafael Pena | 100.0% | 13.9%(+86.1)#17 | 12.5%(+87.5)#98 |
| 17. | Martinez | 100.0% | 13.9%(+86.1)#18 | 12.5%(+87.5)#99 |
| 18. | Santa Anna | 100.0% | 13.9%(+86.1)#19 | 12.5%(+87.5)#116 |
| 19. | Carrizo Hill | 96.0% | 13.9%(+82.1)#20 | 12.5%(+83.5)#122 |
| 20. | Sandy Hollow Escondidas | 95.6% | 13.9%(+81.7)#21 | 12.5%(+83.1)#123 |
| 21. | Moore | 94.6% | 13.9%(+80.7)#22 | 12.5%(+82.1)#126 |
| 22. | Los Alvarez | 93.9% | 13.9%(+80.0)#23 | 12.5%(+81.4)#130 |
| 23. | Campo Verde | 89.8% | 13.9%(+75.9)#24 | 12.5%(+77.3)#151 |
| 24. | Sanford | 78.2% | 13.9%(+64.3)#25 | 12.5%(+65.7)#213 |
| 25. | Dayton Lakes | 76.8% | 13.9%(+62.9)#26 | 12.5%(+64.3)#225 |
| 26. | Butterfield | 75.2% | 13.9%(+61.3)#27 | 12.5%(+62.7)#240 |
| 27. | Mcleod | 73.5% | 13.9%(+59.5)#28 | 12.5%(+60.9)#262 |
| 28. | Alto Bonito Heights | 72.0% | 13.9%(+58.1)#29 | 12.5%(+59.5)#282 |
| 29. | Manuel Garcia | 70.2% | 13.9%(+56.2)#30 | 12.5%(+57.6)#320 |
| 30. | Bledsoe | 68.3% | 13.9%(+54.3)#31 | 12.5%(+55.7)#342 |
| 31. | Hargill | 68.0% | 13.9%(+54.1)#32 | 12.5%(+55.5)#345 |
| 32. | Eugenio Saenz | 68.0% | 13.9%(+54.0)#33 | 12.5%(+55.4)#346 |
| 33. | Salida Del Sol Estates | 66.7% | 13.9%(+52.7)#34 | 12.5%(+54.2)#362 |
| 34. | Havana | 66.1% | 13.9%(+52.2)#35 | 12.5%(+53.6)#372 |
| 35. | Fabrica | 66.1% | 13.9%(+52.2)#36 | 12.5%(+53.6)#373 |
| 36. | Barrera | 64.0% | 13.9%(+50.1)#37 | 12.5%(+51.5)#418 |
| 37. | Indian Hills | 63.9% | 13.9%(+49.9)#38 | 12.5%(+51.3)#423 |
| 38. | El Socio | 63.0% | 13.9%(+49.0)#39 | 12.5%(+50.4)#442 |
| 39. | Lopeno | 62.5% | 13.9%(+48.6)#40 | 12.5%(+50.0)#449 |
| 40. | Rancho Chico | 62.3% | 13.9%(+48.3)#41 | 12.5%(+49.7)#459 |
| 41. | La Tina Ranch | 61.9% | 13.9%(+48.0)#42 | 12.5%(+49.4)#466 |
| 42. | Briggs | 61.8% | 13.9%(+47.9)#43 | 12.5%(+49.3)#468 |
| 43. | Abram | 61.4% | 13.9%(+47.4)#44 | 12.5%(+48.8)#479 |
| 44. | Damon | 60.2% | 13.9%(+46.2)#45 | 12.5%(+47.7)#510 |
| 45. | Garza Salinas Ii | 60.0% | 13.9%(+46.1)#46 | 12.5%(+47.5)#517 |
| 46. | Fronton | 59.8% | 13.9%(+45.9)#47 | 12.5%(+47.3)#522 |
| 47. | Salineno North | 59.7% | 13.9%(+45.8)#48 | 12.5%(+47.2)#529 |
| 48. | Lake View | 59.0% | 13.9%(+45.1)#49 | 12.5%(+46.5)#545 |
| 49. | Garceno | 58.2% | 13.9%(+44.3)#50 | 12.5%(+45.7)#558 |
| 50. | Sparks | 58.2% | 13.9%(+44.2)#51 | 12.5%(+45.6)#560 |
| 51. | Tierra Verde | 57.1% | 13.9%(+43.2)#52 | 12.5%(+44.6)#586 |
| 52. | Ranchitos East | 56.5% | 13.9%(+42.6)#53 | 12.5%(+44.0)#604 |
| 53. | Rancho Alegre | 56.4% | 13.9%(+42.5)#54 | 12.5%(+43.9)#608 |
| 54. | Alice Acres | 55.9% | 13.9%(+42.0)#55 | 12.5%(+43.4)#627 |
| 55. | Doolittle | 55.8% | 13.9%(+41.8)#56 | 12.5%(+43.3)#630 |
| 56. | Medina | 54.5% | 13.9%(+40.6)#57 | 12.5%(+42.0)#683 |
| 57. | East Alto Bonito | 53.8% | 13.9%(+39.9)#58 | 12.5%(+41.3)#716 |
| 58. | Mobile City | 52.0% | 13.9%(+38.0)#59 | 12.5%(+39.5)#797 |
| 59. | Oak Island | 52.0% | 13.9%(+38.0)#60 | 12.5%(+39.4)#799 |
| 60. | Bluetown | 51.5% | 13.9%(+37.6)#61 | 12.5%(+39.0)#822 |
| 61. | San Perlita | 51.1% | 13.9%(+37.2)#62 | 12.5%(+38.6)#843 |
| 62. | San Carlos I | 50.6% | 13.9%(+36.7)#63 | 12.5%(+38.1)#873 |
| 63. | South La Paloma | 50.6% | 13.9%(+36.6)#64 | 12.5%(+38.0)#878 |
| 64. | Ricardo | 50.5% | 13.9%(+36.6)#65 | 12.5%(+38.0)#881 |
| 65. | Batesville | 50.4% | 13.9%(+36.4)#66 | 12.5%(+37.8)#889 |
| 66. | Impact | 50.0% | 13.9%(+36.1)#67 | 12.5%(+37.5)#913 |
| 67. | Presidio | 49.4% | 13.9%(+35.4)#68 | 12.5%(+36.8)#949 |
| 68. | La Presa | 49.1% | 13.9%(+35.1)#69 | 12.5%(+36.6)#964 |
| 69. | Ames | 49.0% | 13.9%(+35.1)#70 | 12.5%(+36.5)#969 |
| 70. | Blessing | 49.0% | 13.9%(+35.0)#71 | 12.5%(+36.4)#974 |
| 71. | Escobares | 48.8% | 13.9%(+34.9)#72 | 12.5%(+36.3)#980 |
| 72. | Las Quintas Fronterizas | 48.8% | 13.9%(+34.9)#73 | 12.5%(+36.3)#981 |
| 73. | Citrus City | 48.6% | 13.9%(+34.7)#74 | 12.5%(+36.1)#992 |
| 74. | Sunset Cdp Starr County | 48.3% | 13.9%(+34.4)#75 | 12.5%(+35.8)#1,013 |
| 75. | Tierra Grande | 47.5% | 13.9%(+33.6)#76 | 12.5%(+35.0)#1,055 |
| 76. | Buckholts | 47.5% | 13.9%(+33.6)#77 | 12.5%(+35.0)#1,058 |
| 77. | Matagorda | 47.0% | 13.9%(+33.1)#78 | 12.5%(+34.5)#1,095 |
| 78. | Amherst | 46.7% | 13.9%(+32.8)#79 | 12.5%(+34.2)#1,113 |
| 79. | Cameron Park | 46.7% | 13.9%(+32.8)#80 | 12.5%(+34.2)#1,114 |
| 80. | Villa Verde | 46.5% | 13.9%(+32.5)#81 | 12.5%(+33.9)#1,146 |
| 81. | Big Wells | 46.1% | 13.9%(+32.1)#82 | 12.5%(+33.5)#1,175 |
| 82. | Siesta Shores | 46.0% | 13.9%(+32.0)#83 | 12.5%(+33.4)#1,185 |
| 83. | El Refugio | 45.7% | 13.9%(+31.8)#84 | 12.5%(+33.2)#1,201 |
| 84. | Chula Vista Cdp Cameron County | 45.5% | 13.9%(+31.5)#85 | 12.5%(+32.9)#1,218 |
| 85. | Santa Rosa | 45.3% | 13.9%(+31.4)#86 | 12.5%(+32.8)#1,226 |
| 86. | Prairie View | 44.7% | 13.9%(+30.7)#87 | 12.5%(+32.1)#1,274 |
| 87. | Palmview South | 44.4% | 13.9%(+30.4)#88 | 12.5%(+31.8)#1,299 |
| 88. | Fort Davis | 44.3% | 13.9%(+30.3)#89 | 12.5%(+31.7)#1,306 |
| 89. | Carrizo Springs | 44.2% | 13.9%(+30.3)#90 | 12.5%(+31.7)#1,310 |
| 90. | Balcones Heights | 44.1% | 13.9%(+30.2)#91 | 12.5%(+31.6)#1,316 |
| 91. | Driscoll | 44.0% | 13.9%(+30.1)#92 | 12.5%(+31.5)#1,323 |
| 92. | San Pedro | 43.9% | 13.9%(+29.9)#93 | 12.5%(+31.4)#1,332 |
| 93. | Talco | 43.5% | 13.9%(+29.5)#94 | 12.5%(+31.0)#1,368 |
| 94. | Rangerville | 43.4% | 13.9%(+29.5)#95 | 12.5%(+30.9)#1,378 |
| 95. | Seco Mines | 43.1% | 13.9%(+29.1)#96 | 12.5%(+30.6)#1,408 |
| 96. | Pineland | 43.0% | 13.9%(+29.0)#97 | 12.5%(+30.5)#1,421 |
| 97. | Bloomington | 42.7% | 13.9%(+28.8)#98 | 12.5%(+30.2)#1,444 |
| 98. | Banquete | 42.6% | 13.9%(+28.7)#99 | 12.5%(+30.1)#1,449 |
| 99. | Chula Vista Cdp Zavala County | 42.3% | 13.9%(+28.4)#100 | 12.5%(+29.8)#1,478 |
| 100. | Ramos | 41.9% | 13.9%(+28.0)#101 | 12.5%(+29.4)#1,506 |
Common Questions
What are the Top 10 Cities with the Highest Poverty Level in Texas?
Top 10 Cities with the Highest Poverty Level in Texas are:
#1
100.0%
#2
100.0%
#3
100.0%
#4
100.0%
#5
100.0%
#6
100.0%
#7
100.0%
#8
100.0%
#9
100.0%
#10
100.0%
What city has the Highest Poverty Level in Texas?
La Esperanza has the Highest Poverty Level in Texas with 100.0%.
What is the Poverty Level in the State of Texas?
Poverty Level in Texas is 13.9%.
What is the Poverty Level in the United States?
Poverty Level in the United States is 12.5%.