Cities with the Highest Poverty Level in Michigan
RELATED REPORTS & OPTIONS
Highest Poverty
Michigan
Compare Cities
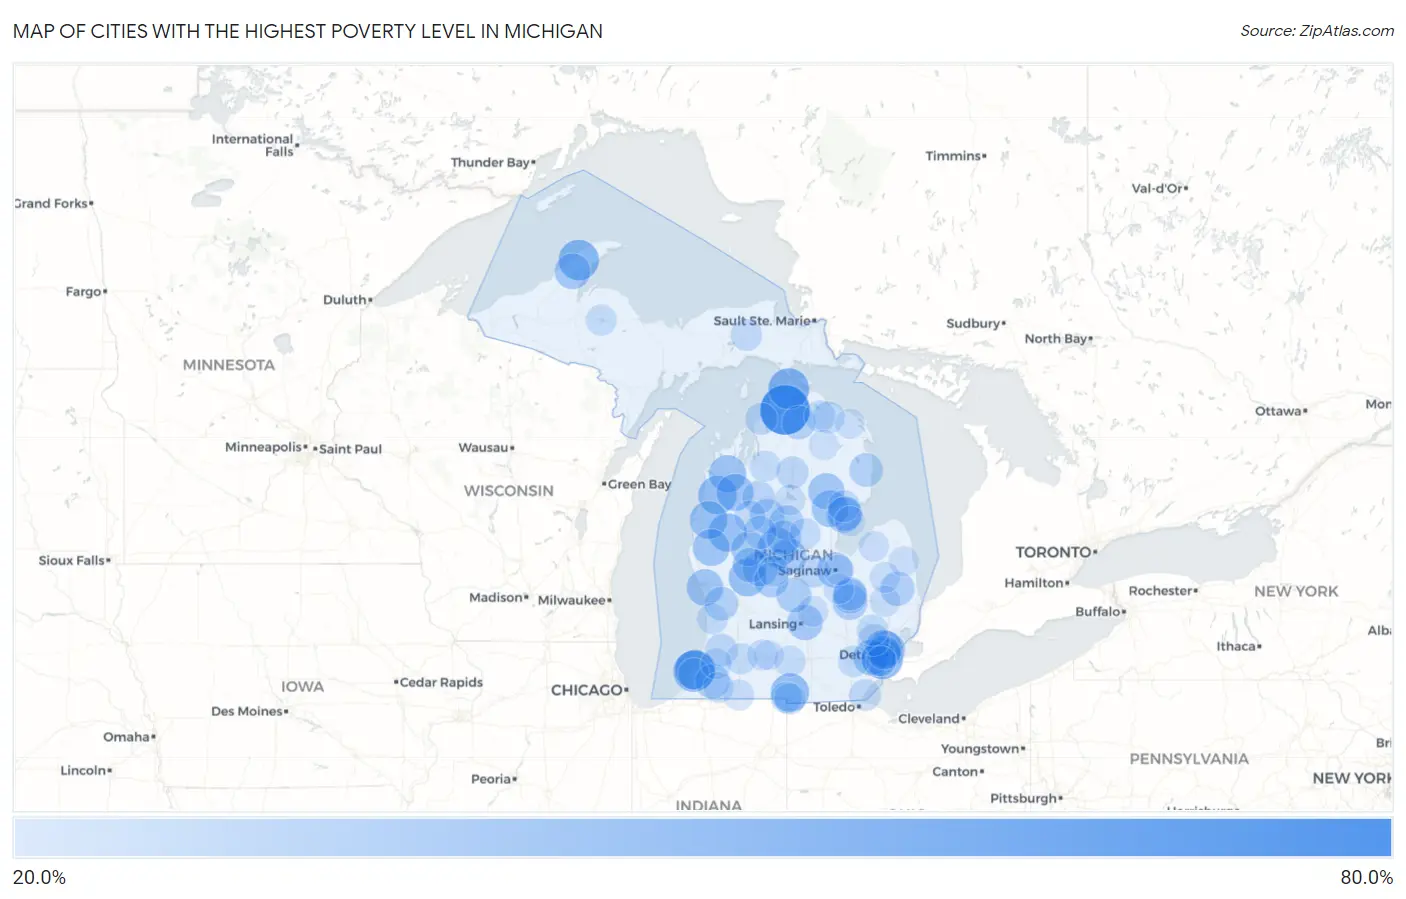
Map of Cities with the Highest Poverty Level in Michigan
0.0%
80.0%
Cities with the Highest Poverty Level in Michigan
| City | Poverty | vs State | vs National | |
| 1. | Oden | 60.3% | 13.1%(+47.2)#1 | 12.5%(+47.8)#507 |
| 2. | Rockland | 50.5% | 13.1%(+37.4)#2 | 12.5%(+38.0)#883 |
| 3. | Elm Hall | 50.3% | 13.1%(+37.1)#3 | 12.5%(+37.7)#897 |
| 4. | Pelkie | 50.0% | 13.1%(+36.9)#4 | 12.5%(+37.5)#910 |
| 5. | Paris | 46.2% | 13.1%(+33.1)#5 | 12.5%(+33.7)#1,165 |
| 6. | Benton Harbor | 44.2% | 13.1%(+31.1)#6 | 12.5%(+31.7)#1,309 |
| 7. | Carp Lake | 44.1% | 13.1%(+30.9)#7 | 12.5%(+31.5)#1,318 |
| 8. | River Rouge | 43.8% | 13.1%(+30.7)#8 | 12.5%(+31.3)#1,336 |
| 9. | Calumet | 43.3% | 13.1%(+30.1)#9 | 12.5%(+30.7)#1,392 |
| 10. | Benton Heights | 43.0% | 13.1%(+29.9)#10 | 12.5%(+30.5)#1,417 |
| 11. | Weidman | 40.2% | 13.1%(+27.1)#11 | 12.5%(+27.7)#1,655 |
| 12. | Kaleva | 39.5% | 13.1%(+26.4)#12 | 12.5%(+27.0)#1,741 |
| 13. | Reading | 39.5% | 13.1%(+26.3)#13 | 12.5%(+26.9)#1,746 |
| 14. | Baldwin | 39.2% | 13.1%(+26.0)#14 | 12.5%(+26.6)#1,779 |
| 15. | Fountain | 38.3% | 13.1%(+25.2)#15 | 12.5%(+25.8)#1,863 |
| 16. | Pierson | 38.3% | 13.1%(+25.1)#16 | 12.5%(+25.7)#1,868 |
| 17. | Hamtramck | 37.7% | 13.1%(+24.6)#17 | 12.5%(+25.2)#1,945 |
| 18. | Highland Park | 37.6% | 13.1%(+24.4)#18 | 12.5%(+25.0)#1,966 |
| 19. | Bendon | 37.5% | 13.1%(+24.4)#19 | 12.5%(+25.0)#1,974 |
| 20. | Mesick | 37.2% | 13.1%(+24.0)#20 | 12.5%(+24.6)#2,033 |
| 21. | Walkerville | 36.8% | 13.1%(+23.7)#21 | 12.5%(+24.3)#2,089 |
| 22. | Muskegon Heights | 36.5% | 13.1%(+23.3)#22 | 12.5%(+23.9)#2,139 |
| 23. | Skidway Lake | 36.2% | 13.1%(+23.1)#23 | 12.5%(+23.7)#2,166 |
| 24. | Hurontown | 36.0% | 13.1%(+22.9)#24 | 12.5%(+23.5)#2,189 |
| 25. | Rose City | 35.6% | 13.1%(+22.4)#25 | 12.5%(+23.0)#2,266 |
| 26. | Inkster | 35.1% | 13.1%(+22.0)#26 | 12.5%(+22.6)#2,346 |
| 27. | Houghton | 34.9% | 13.1%(+21.7)#27 | 12.5%(+22.3)#2,377 |
| 28. | Twining | 34.5% | 13.1%(+21.4)#28 | 12.5%(+22.0)#2,427 |
| 29. | Saginaw | 34.5% | 13.1%(+21.3)#29 | 12.5%(+21.9)#2,446 |
| 30. | Mount Pleasant | 34.4% | 13.1%(+21.3)#30 | 12.5%(+21.9)#2,450 |
| 31. | Winn | 34.3% | 13.1%(+21.2)#31 | 12.5%(+21.8)#2,469 |
| 32. | East Lansing | 34.3% | 13.1%(+21.1)#32 | 12.5%(+21.7)#2,478 |
| 33. | Kincheloe | 33.9% | 13.1%(+20.8)#33 | 12.5%(+21.4)#2,542 |
| 34. | Lakeview | 33.6% | 13.1%(+20.5)#34 | 12.5%(+21.1)#2,601 |
| 35. | Big Rapids | 33.6% | 13.1%(+20.4)#35 | 12.5%(+21.0)#2,621 |
| 36. | Flint | 33.3% | 13.1%(+20.2)#36 | 12.5%(+20.8)#2,681 |
| 37. | Maple Rapids | 33.2% | 13.1%(+20.1)#37 | 12.5%(+20.7)#2,690 |
| 38. | Melvindale | 33.2% | 13.1%(+20.0)#38 | 12.5%(+20.6)#2,702 |
| 39. | Morley | 33.1% | 13.1%(+20.0)#39 | 12.5%(+20.6)#2,709 |
| 40. | Marion | 32.9% | 13.1%(+19.8)#40 | 12.5%(+20.4)#2,749 |
| 41. | Dowagiac | 32.8% | 13.1%(+19.6)#41 | 12.5%(+20.2)#2,773 |
| 42. | Beecher | 32.5% | 13.1%(+19.4)#42 | 12.5%(+20.0)#2,828 |
| 43. | Stanton | 32.5% | 13.1%(+19.3)#43 | 12.5%(+19.9)#2,838 |
| 44. | Turner | 32.4% | 13.1%(+19.3)#44 | 12.5%(+19.9)#2,847 |
| 45. | Dodgeville | 32.4% | 13.1%(+19.3)#45 | 12.5%(+19.9)#2,857 |
| 46. | Harrison | 32.4% | 13.1%(+19.2)#46 | 12.5%(+19.8)#2,867 |
| 47. | Farwell | 32.2% | 13.1%(+19.1)#47 | 12.5%(+19.7)#2,913 |
| 48. | Melvin | 31.7% | 13.1%(+18.6)#48 | 12.5%(+19.2)#3,028 |
| 49. | Detroit | 31.5% | 13.1%(+18.4)#49 | 12.5%(+19.0)#3,078 |
| 50. | Lincoln | 31.3% | 13.1%(+18.2)#50 | 12.5%(+18.8)#3,110 |
| 51. | Wolverine | 31.2% | 13.1%(+18.1)#51 | 12.5%(+18.7)#3,135 |
| 52. | Allendale | 31.1% | 13.1%(+18.0)#52 | 12.5%(+18.6)#3,165 |
| 53. | Mount Morris | 30.4% | 13.1%(+17.3)#53 | 12.5%(+17.9)#3,320 |
| 54. | Evart | 30.1% | 13.1%(+17.0)#54 | 12.5%(+17.6)#3,384 |
| 55. | Jennings | 29.7% | 13.1%(+16.6)#55 | 12.5%(+17.2)#3,468 |
| 56. | Bloomingdale | 29.2% | 13.1%(+16.0)#56 | 12.5%(+16.6)#3,628 |
| 57. | Riverdale | 29.1% | 13.1%(+16.0)#57 | 12.5%(+16.6)#3,633 |
| 58. | Tower | 29.1% | 13.1%(+15.9)#58 | 12.5%(+16.5)#3,655 |
| 59. | Merrill | 28.9% | 13.1%(+15.8)#59 | 12.5%(+16.4)#3,687 |
| 60. | Charlevoix | 28.4% | 13.1%(+15.2)#60 | 12.5%(+15.8)#3,864 |
| 61. | Pittsford | 28.4% | 13.1%(+15.2)#61 | 12.5%(+15.8)#3,870 |
| 62. | Grayling | 28.3% | 13.1%(+15.2)#62 | 12.5%(+15.8)#3,890 |
| 63. | Whittemore | 28.1% | 13.1%(+15.0)#63 | 12.5%(+15.6)#3,935 |
| 64. | Millersburg | 28.0% | 13.1%(+14.8)#64 | 12.5%(+15.4)#3,989 |
| 65. | Bingham Farms | 27.9% | 13.1%(+14.7)#65 | 12.5%(+15.3)#4,016 |
| 66. | Luna Pier | 27.8% | 13.1%(+14.6)#66 | 12.5%(+15.2)#4,061 |
| 67. | Newberry | 27.5% | 13.1%(+14.4)#67 | 12.5%(+15.0)#4,140 |
| 68. | Ypsilanti | 27.3% | 13.1%(+14.1)#68 | 12.5%(+14.7)#4,223 |
| 69. | Onaway | 27.2% | 13.1%(+14.1)#69 | 12.5%(+14.7)#4,230 |
| 70. | Montgomery | 27.2% | 13.1%(+14.1)#70 | 12.5%(+14.7)#4,241 |
| 71. | Tustin | 27.2% | 13.1%(+14.0)#71 | 12.5%(+14.6)#4,252 |
| 72. | Camden | 27.0% | 13.1%(+13.9)#72 | 12.5%(+14.5)#4,307 |
| 73. | Beaverton | 26.9% | 13.1%(+13.7)#73 | 12.5%(+14.3)#4,359 |
| 74. | Kalkaska | 26.9% | 13.1%(+13.7)#74 | 12.5%(+14.3)#4,364 |
| 75. | Kalamazoo | 26.8% | 13.1%(+13.7)#75 | 12.5%(+14.3)#4,379 |
| 76. | Pontiac | 26.7% | 13.1%(+13.6)#76 | 12.5%(+14.2)#4,399 |
| 77. | Albion | 26.7% | 13.1%(+13.6)#77 | 12.5%(+14.2)#4,411 |
| 78. | Beechwood | 26.6% | 13.1%(+13.5)#78 | 12.5%(+14.1)#4,454 |
| 79. | Michigamme | 26.5% | 13.1%(+13.4)#79 | 12.5%(+14.0)#4,474 |
| 80. | Fair Plain | 26.5% | 13.1%(+13.4)#80 | 12.5%(+14.0)#4,483 |
| 81. | Lakeport | 26.5% | 13.1%(+13.3)#81 | 12.5%(+13.9)#4,500 |
| 82. | Lawrence | 26.4% | 13.1%(+13.3)#82 | 12.5%(+13.9)#4,513 |
| 83. | Naubinway | 26.4% | 13.1%(+13.3)#83 | 12.5%(+13.9)#4,521 |
| 84. | White Pigeon | 26.2% | 13.1%(+13.1)#84 | 12.5%(+13.7)#4,569 |
| 85. | Imlay City | 26.2% | 13.1%(+13.0)#85 | 12.5%(+13.6)#4,600 |
| 86. | Laingsburg | 26.2% | 13.1%(+13.0)#86 | 12.5%(+13.6)#4,601 |
| 87. | Springfield | 26.2% | 13.1%(+13.0)#87 | 12.5%(+13.6)#4,604 |
| 88. | Edmore | 26.1% | 13.1%(+13.0)#88 | 12.5%(+13.6)#4,616 |
| 89. | Houghton Lake | 26.1% | 13.1%(+12.9)#89 | 12.5%(+13.5)#4,636 |
| 90. | Cassopolis | 26.0% | 13.1%(+12.9)#90 | 12.5%(+13.5)#4,652 |
| 91. | Marlette | 25.9% | 13.1%(+12.7)#91 | 12.5%(+13.3)#4,716 |
| 92. | Montrose | 25.6% | 13.1%(+12.5)#92 | 12.5%(+13.1)#4,813 |
| 93. | Owendale | 25.5% | 13.1%(+12.3)#93 | 12.5%(+12.9)#4,865 |
| 94. | Au Gres | 25.3% | 13.1%(+12.1)#94 | 12.5%(+12.7)#4,936 |
| 95. | Atlanta | 25.1% | 13.1%(+12.0)#95 | 12.5%(+12.6)#4,989 |
| 96. | Ecorse | 25.0% | 13.1%(+11.9)#96 | 12.5%(+12.5)#5,075 |
| 97. | Buena Vista | 25.0% | 13.1%(+11.8)#97 | 12.5%(+12.4)#5,081 |
| 98. | Brownlee Park | 24.9% | 13.1%(+11.8)#98 | 12.5%(+12.4)#5,095 |
| 99. | Posen | 24.9% | 13.1%(+11.8)#99 | 12.5%(+12.4)#5,099 |
| 100. | Deckerville | 24.8% | 13.1%(+11.7)#100 | 12.5%(+12.3)#5,124 |
Common Questions
What are the Top 10 Cities with the Highest Poverty Level in Michigan?
Top 10 Cities with the Highest Poverty Level in Michigan are:
#1
60.3%
#2
44.2%
#3
44.1%
#4
43.8%
#5
43.3%
#6
43.0%
#7
40.2%
#8
39.5%
#9
39.5%
#10
39.2%
What city has the Highest Poverty Level in Michigan?
Oden has the Highest Poverty Level in Michigan with 60.3%.
What is the Poverty Level in the State of Michigan?
Poverty Level in Michigan is 13.1%.
What is the Poverty Level in the United States?
Poverty Level in the United States is 12.5%.