Cities with the Highest Poverty Level in Florida
RELATED REPORTS & OPTIONS
Highest Poverty
Florida
Compare Cities
Map of Cities with the Highest Poverty Level in Florida
0.0%
100.0%
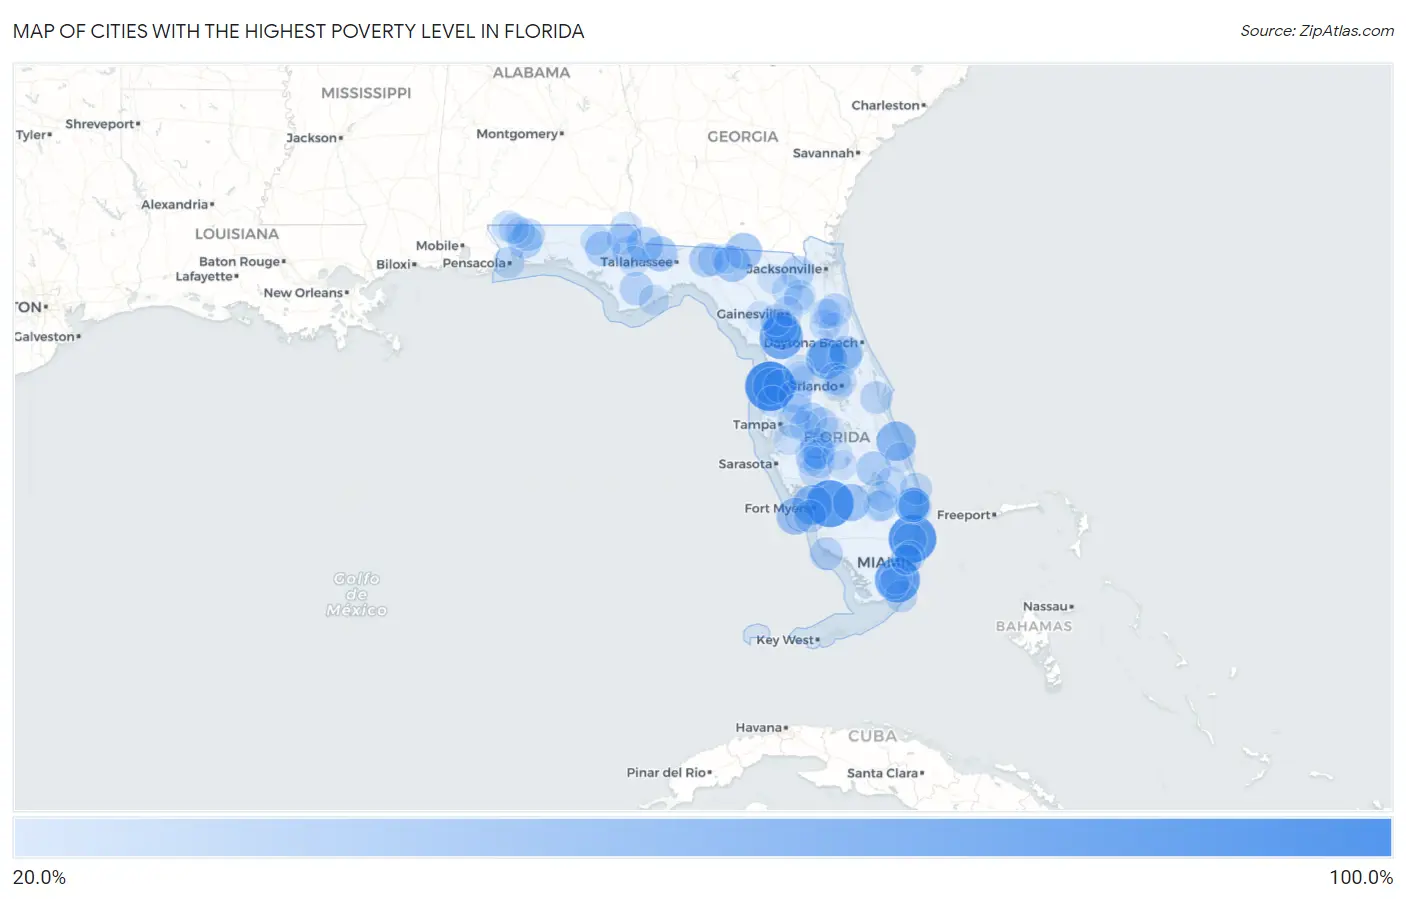
Cities with the Highest Poverty Level in Florida
| City | Poverty | vs State | vs National | |
| 1. | Bayport | 100.0% | 12.9% (+87.1)#1 | 12.5% (+87.5)#26 |
| 2. | Lazy Lake | 93.0% | 12.9% (+80.1)#2 | 12.5% (+80.5)#133 |
| 3. | Charleston Park | 90.9% | 12.9% (+78.0)#3 | 12.5% (+78.4)#140 |
| 4. | Homestead Base | 83.0% | 12.9% (+70.1)#4 | 12.5% (+70.5)#179 |
| 5. | Morriston | 77.1% | 12.9% (+64.3)#5 | 12.5% (+64.6)#222 |
| 6. | Florida Gulf Coast University | 69.2% | 12.9% (+56.3)#6 | 12.5% (+56.6)#331 |
| 7. | Altoona | 65.4% | 12.9% (+52.5)#7 | 12.5% (+52.8)#386 |
| 8. | Palmona Park | 62.9% | 12.9% (+50.1)#8 | 12.5% (+50.4)#443 |
| 9. | Gifford | 62.2% | 12.9% (+49.4)#9 | 12.5% (+49.7)#461 |
| 10. | East Williston | 55.0% | 12.9% (+42.2)#10 | 12.5% (+42.5)#664 |
| 11. | Pioneer | 53.7% | 12.9% (+40.8)#11 | 12.5% (+41.2)#720 |
| 12. | Captiva | 53.0% | 12.9% (+40.1)#12 | 12.5% (+40.4)#751 |
| 13. | Weeki Wachee Gardens | 52.6% | 12.9% (+39.8)#13 | 12.5% (+40.1)#766 |
| 14. | Jennings | 51.5% | 12.9% (+38.6)#14 | 12.5% (+39.0)#824 |
| 15. | Lee | 50.8% | 12.9% (+37.9)#15 | 12.5% (+38.2)#866 |
| 16. | Chattahoochee | 48.2% | 12.9% (+35.3)#16 | 12.5% (+35.6)#1,024 |
| 17. | Pine Air | 48.0% | 12.9% (+35.1)#17 | 12.5% (+35.5)#1,029 |
| 18. | Pittman | 46.7% | 12.9% (+33.9)#18 | 12.5% (+34.2)#1,116 |
| 19. | Quincy | 46.7% | 12.9% (+33.8)#19 | 12.5% (+34.1)#1,122 |
| 20. | Royal Palm Estates | 46.3% | 12.9% (+33.4)#20 | 12.5% (+33.7)#1,161 |
| 21. | Wausau | 45.2% | 12.9% (+32.4)#21 | 12.5% (+32.7)#1,234 |
| 22. | Raleigh | 45.0% | 12.9% (+32.1)#22 | 12.5% (+32.5)#1,250 |
| 23. | Wauchula | 44.9% | 12.9% (+32.1)#23 | 12.5% (+32.4)#1,254 |
| 24. | Cypress Quarters | 44.4% | 12.9% (+31.5)#24 | 12.5% (+31.9)#1,294 |
| 25. | Springhill | 43.6% | 12.9% (+30.7)#25 | 12.5% (+31.1)#1,358 |
| 26. | Aucilla | 43.6% | 12.9% (+30.7)#26 | 12.5% (+31.0)#1,360 |
| 27. | Tropical Park | 42.2% | 12.9% (+29.3)#27 | 12.5% (+29.7)#1,488 |
| 28. | Deland Southwest | 41.8% | 12.9% (+28.9)#28 | 12.5% (+29.2)#1,533 |
| 29. | North Deland | 41.0% | 12.9% (+28.1)#29 | 12.5% (+28.4)#1,599 |
| 30. | Franklin Park | 40.2% | 12.9% (+27.3)#30 | 12.5% (+27.6)#1,660 |
| 31. | Sumatra | 40.0% | 12.9% (+27.1)#31 | 12.5% (+27.5)#1,690 |
| 32. | Wiscon | 40.0% | 12.9% (+27.1)#32 | 12.5% (+27.4)#1,694 |
| 33. | Glen St Mary | 39.7% | 12.9% (+26.9)#33 | 12.5% (+27.2)#1,712 |
| 34. | Dover | 39.7% | 12.9% (+26.8)#34 | 12.5% (+27.2)#1,719 |
| 35. | Hastings | 39.1% | 12.9% (+26.3)#35 | 12.5% (+26.6)#1,780 |
| 36. | Dade City North | 38.3% | 12.9% (+25.4)#36 | 12.5% (+25.7)#1,874 |
| 37. | Goodland | 38.1% | 12.9% (+25.2)#37 | 12.5% (+25.5)#1,901 |
| 38. | Cocoa West | 37.9% | 12.9% (+25.1)#38 | 12.5% (+25.4)#1,914 |
| 39. | Wahneta | 37.9% | 12.9% (+25.1)#39 | 12.5% (+25.4)#1,917 |
| 40. | Harlem Heights | 36.5% | 12.9% (+23.7)#40 | 12.5% (+24.0)#2,130 |
| 41. | Crystal Lake | 36.4% | 12.9% (+23.6)#41 | 12.5% (+23.9)#2,144 |
| 42. | Altha | 36.4% | 12.9% (+23.5)#42 | 12.5% (+23.8)#2,151 |
| 43. | Munson | 36.2% | 12.9% (+23.3)#43 | 12.5% (+23.6)#2,176 |
| 44. | Greenville | 35.7% | 12.9% (+22.9)#44 | 12.5% (+23.2)#2,239 |
| 45. | Schall Circle | 35.6% | 12.9% (+22.7)#45 | 12.5% (+23.1)#2,264 |
| 46. | University Cdp Hillsborough County | 35.2% | 12.9% (+22.3)#46 | 12.5% (+22.7)#2,330 |
| 47. | Ona | 35.2% | 12.9% (+22.3)#47 | 12.5% (+22.6)#2,336 |
| 48. | North Key Largo | 35.2% | 12.9% (+22.3)#48 | 12.5% (+22.6)#2,337 |
| 49. | Arcadia | 35.2% | 12.9% (+22.3)#49 | 12.5% (+22.6)#2,338 |
| 50. | Jupiter Inlet Colony | 35.1% | 12.9% (+22.3)#50 | 12.5% (+22.6)#2,339 |
| 51. | Archer | 34.7% | 12.9% (+21.8)#51 | 12.5% (+22.2)#2,404 |
| 52. | South Apopka | 34.4% | 12.9% (+21.6)#52 | 12.5% (+21.9)#2,452 |
| 53. | Malone | 33.7% | 12.9% (+20.9)#53 | 12.5% (+21.2)#2,582 |
| 54. | Marianna | 33.6% | 12.9% (+20.8)#54 | 12.5% (+21.1)#2,602 |
| 55. | Bowling Green | 33.6% | 12.9% (+20.8)#55 | 12.5% (+21.1)#2,605 |
| 56. | Goulding | 33.6% | 12.9% (+20.7)#56 | 12.5% (+21.0)#2,617 |
| 57. | Rainbow Park | 33.6% | 12.9% (+20.7)#57 | 12.5% (+21.0)#2,619 |
| 58. | Naranja | 33.6% | 12.9% (+20.7)#58 | 12.5% (+21.0)#2,623 |
| 59. | Gardner | 33.1% | 12.9% (+20.2)#59 | 12.5% (+20.5)#2,721 |
| 60. | Indiantown | 32.7% | 12.9% (+19.9)#60 | 12.5% (+20.2)#2,783 |
| 61. | Willow Oak | 32.7% | 12.9% (+19.8)#61 | 12.5% (+20.1)#2,796 |
| 62. | Florida City | 32.6% | 12.9% (+19.7)#62 | 12.5% (+20.1)#2,803 |
| 63. | Belle Glade | 32.5% | 12.9% (+19.7)#63 | 12.5% (+20.0)#2,827 |
| 64. | Gun Club Estates | 32.4% | 12.9% (+19.6)#64 | 12.5% (+19.9)#2,845 |
| 65. | Zolfo Springs | 32.4% | 12.9% (+19.5)#65 | 12.5% (+19.9)#2,849 |
| 66. | Gladeview | 32.3% | 12.9% (+19.5)#66 | 12.5% (+19.8)#2,879 |
| 67. | Century | 32.1% | 12.9% (+19.3)#67 | 12.5% (+19.6)#2,925 |
| 68. | Eatonville | 32.1% | 12.9% (+19.2)#68 | 12.5% (+19.5)#2,935 |
| 69. | South Bay | 32.0% | 12.9% (+19.1)#69 | 12.5% (+19.5)#2,949 |
| 70. | Bonifay | 32.0% | 12.9% (+19.1)#70 | 12.5% (+19.4)#2,967 |
| 71. | Pahokee | 31.8% | 12.9% (+18.9)#71 | 12.5% (+19.2)#3,006 |
| 72. | Starke | 31.7% | 12.9% (+18.8)#72 | 12.5% (+19.2)#3,027 |
| 73. | Berrydale | 31.7% | 12.9% (+18.8)#73 | 12.5% (+19.1)#3,034 |
| 74. | Lake Butler | 31.5% | 12.9% (+18.6)#74 | 12.5% (+18.9)#3,091 |
| 75. | Welaka | 31.4% | 12.9% (+18.6)#75 | 12.5% (+18.9)#3,095 |
| 76. | Moon Lake | 31.4% | 12.9% (+18.5)#76 | 12.5% (+18.9)#3,099 |
| 77. | Hampton | 31.3% | 12.9% (+18.4)#77 | 12.5% (+18.8)#3,117 |
| 78. | Biscayne Park | 31.1% | 12.9% (+18.2)#78 | 12.5% (+18.6)#3,170 |
| 79. | Webster | 30.6% | 12.9% (+17.7)#79 | 12.5% (+18.1)#3,271 |
| 80. | Crooked Lake Park | 30.6% | 12.9% (+17.7)#80 | 12.5% (+18.0)#3,284 |
| 81. | Carrabelle | 30.5% | 12.9% (+17.6)#81 | 12.5% (+17.9)#3,300 |
| 82. | Jay | 30.3% | 12.9% (+17.4)#82 | 12.5% (+17.8)#3,344 |
| 83. | Blountstown | 30.2% | 12.9% (+17.3)#83 | 12.5% (+17.6)#3,371 |
| 84. | Lake Panasoffkee | 30.0% | 12.9% (+17.1)#84 | 12.5% (+17.4)#3,419 |
| 85. | Brownsville | 29.7% | 12.9% (+16.8)#85 | 12.5% (+17.2)#3,467 |
| 86. | Orlovista | 29.7% | 12.9% (+16.8)#86 | 12.5% (+17.2)#3,471 |
| 87. | Wimauma | 29.5% | 12.9% (+16.6)#87 | 12.5% (+16.9)#3,541 |
| 88. | Crystal Springs | 29.4% | 12.9% (+16.5)#88 | 12.5% (+16.9)#3,563 |
| 89. | Crescent City | 29.3% | 12.9% (+16.4)#89 | 12.5% (+16.7)#3,591 |
| 90. | Fort Pierce | 29.0% | 12.9% (+16.2)#90 | 12.5% (+16.5)#3,663 |
| 91. | Gainesville | 29.0% | 12.9% (+16.1)#91 | 12.5% (+16.5)#3,670 |
| 92. | Palatka | 29.0% | 12.9% (+16.1)#92 | 12.5% (+16.4)#3,679 |
| 93. | Sebring | 28.6% | 12.9% (+15.8)#93 | 12.5% (+16.1)#3,774 |
| 94. | Madison | 28.6% | 12.9% (+15.7)#94 | 12.5% (+16.1)#3,789 |
| 95. | Bushnell | 28.6% | 12.9% (+15.7)#95 | 12.5% (+16.1)#3,790 |
| 96. | Watertown | 28.3% | 12.9% (+15.4)#96 | 12.5% (+15.8)#3,896 |
| 97. | Limestone | 28.1% | 12.9% (+15.3)#97 | 12.5% (+15.6)#3,939 |
| 98. | Lake Placid | 28.1% | 12.9% (+15.2)#98 | 12.5% (+15.6)#3,948 |
| 99. | Trenton | 28.1% | 12.9% (+15.2)#99 | 12.5% (+15.5)#3,952 |
| 100. | East Palatka | 28.0% | 12.9% (+15.2)#100 | 12.5% (+15.5)#3,962 |
Common Questions
What are the Top 10 Cities with the Highest Poverty Level in Florida?
Top 10 Cities with the Highest Poverty Level in Florida are:
#1
100.0%
#2
93.0%
#3
90.9%
#4
83.0%
#5
77.1%
#6
65.4%
#7
62.9%
#8
62.2%
#9
55.0%
#10
53.7%
What city has the Highest Poverty Level in Florida?
Bayport has the Highest Poverty Level in Florida with 100.0%.
What is the Poverty Level in the State of Florida?
Poverty Level in Florida is 12.9%.
What is the Poverty Level in the United States?
Poverty Level in the United States is 12.5%.