Cities with the Highest Poverty Level in New York
RELATED REPORTS & OPTIONS
Highest Poverty
New York
Compare Cities
Map of Cities with the Highest Poverty Level in New York
0.0%
100.0%
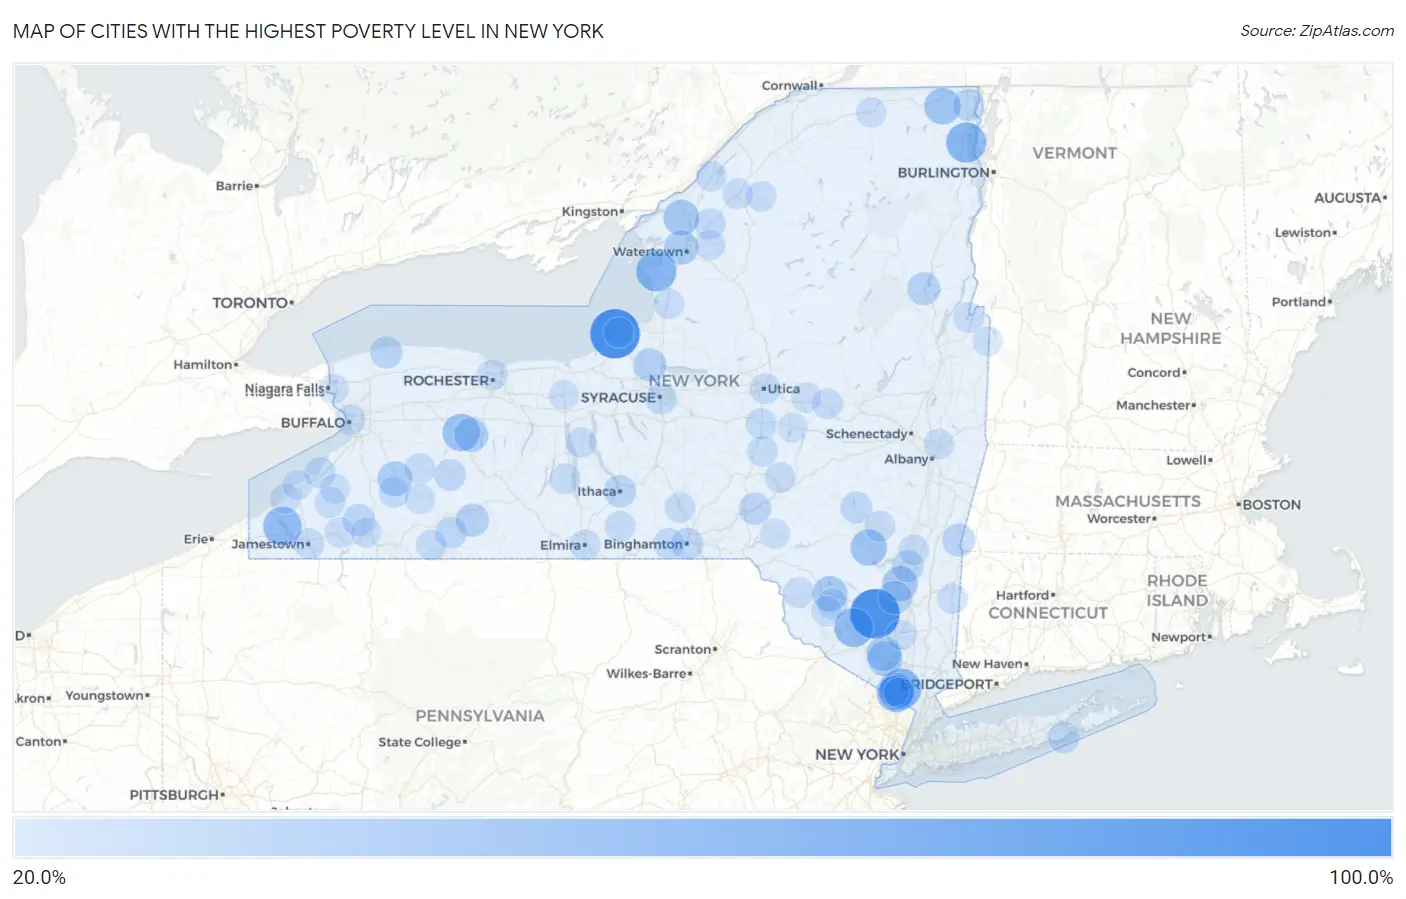
Cities with the Highest Poverty Level in New York
| City | Poverty | vs State | vs National | |
| 1. | Suny Oswego | 100.0% | 13.6% (+86.4)#1 | 12.5% (+87.5)#1 |
| 2. | Siena College | 100.0% | 13.6% (+86.4)#2 | 12.5% (+87.5)#4 |
| 3. | Nazareth College | 100.0% | 13.6% (+86.4)#3 | 12.5% (+87.5)#5 |
| 4. | Watchtower | 100.0% | 13.6% (+86.4)#4 | 12.5% (+87.5)#7 |
| 5. | Fallsburg | 81.0% | 13.6% (+67.4)#5 | 12.5% (+68.5)#188 |
| 6. | New Square | 64.2% | 13.6% (+50.6)#6 | 12.5% (+51.6)#409 |
| 7. | Henderson | 63.4% | 13.6% (+49.8)#7 | 12.5% (+50.9)#434 |
| 8. | Parc | 63.3% | 13.6% (+49.7)#8 | 12.5% (+50.7)#436 |
| 9. | Kaser | 60.4% | 13.6% (+46.8)#9 | 12.5% (+47.9)#504 |
| 10. | Bloomingburg | 58.5% | 13.6% (+44.9)#10 | 12.5% (+46.0)#551 |
| 11. | Chautauqua | 57.6% | 13.6% (+44.0)#11 | 12.5% (+45.0)#572 |
| 12. | Hankins | 56.4% | 13.6% (+42.8)#12 | 12.5% (+43.9)#613 |
| 13. | Wadsworth | 52.0% | 13.6% (+38.4)#13 | 12.5% (+39.5)#796 |
| 14. | Altona | 49.0% | 13.6% (+35.4)#14 | 12.5% (+36.5)#970 |
| 15. | Phoenicia | 48.9% | 13.6% (+35.3)#15 | 12.5% (+36.3)#979 |
| 16. | Mount Vision | 47.3% | 13.6% (+33.7)#16 | 12.5% (+34.7)#1,075 |
| 17. | Rochester Institute Of Technology | 46.9% | 13.6% (+33.3)#17 | 12.5% (+34.4)#1,101 |
| 18. | La Fargeville | 46.0% | 13.6% (+32.4)#18 | 12.5% (+33.5)#1,177 |
| 19. | Monsey | 45.8% | 13.6% (+32.2)#19 | 12.5% (+33.3)#1,193 |
| 20. | Rifton | 44.3% | 13.6% (+30.7)#20 | 12.5% (+31.8)#1,300 |
| 21. | Loch Sheldrake | 43.4% | 13.6% (+29.8)#21 | 12.5% (+30.9)#1,376 |
| 22. | Kiryas Joel | 43.3% | 13.6% (+29.7)#22 | 12.5% (+30.8)#1,387 |
| 23. | Yorkshire | 42.8% | 13.6% (+29.2)#23 | 12.5% (+30.3)#1,435 |
| 24. | South Blooming Grove | 42.6% | 13.6% (+29.0)#24 | 12.5% (+30.1)#1,452 |
| 25. | Glen Park | 40.7% | 13.6% (+27.1)#25 | 12.5% (+28.2)#1,614 |
| 26. | Geneseo | 39.6% | 13.6% (+26.0)#26 | 12.5% (+27.1)#1,730 |
| 27. | New Paltz | 37.8% | 13.6% (+24.2)#27 | 12.5% (+25.3)#1,938 |
| 28. | Sand Ridge | 37.1% | 13.6% (+23.5)#28 | 12.5% (+24.5)#2,048 |
| 29. | South Ilion | 37.1% | 13.6% (+23.4)#29 | 12.5% (+24.5)#2,051 |
| 30. | Alfred | 36.3% | 13.6% (+22.6)#30 | 12.5% (+23.7)#2,162 |
| 31. | Pottersville | 36.1% | 13.6% (+22.5)#31 | 12.5% (+23.6)#2,183 |
| 32. | West Danby | 35.3% | 13.6% (+21.7)#32 | 12.5% (+22.8)#2,315 |
| 33. | Copake Falls | 35.2% | 13.6% (+21.6)#33 | 12.5% (+22.7)#2,328 |
| 34. | Ithaca | 33.1% | 13.6% (+19.5)#34 | 12.5% (+20.5)#2,722 |
| 35. | East Kingston | 32.8% | 13.6% (+19.2)#35 | 12.5% (+20.3)#2,768 |
| 36. | Barker | 32.8% | 13.6% (+19.2)#36 | 12.5% (+20.3)#2,769 |
| 37. | Little Valley | 32.6% | 13.6% (+19.0)#37 | 12.5% (+20.1)#2,807 |
| 38. | Unadilla | 32.6% | 13.6% (+19.0)#38 | 12.5% (+20.1)#2,811 |
| 39. | Chazy | 32.6% | 13.6% (+19.0)#39 | 12.5% (+20.0)#2,817 |
| 40. | Wingdale | 32.6% | 13.6% (+18.9)#40 | 12.5% (+20.0)#2,821 |
| 41. | Westernville | 32.1% | 13.6% (+18.5)#41 | 12.5% (+19.5)#2,937 |
| 42. | Binghamton | 31.7% | 13.6% (+18.1)#42 | 12.5% (+19.2)#3,023 |
| 43. | Prattsville | 31.6% | 13.6% (+18.0)#43 | 12.5% (+19.1)#3,047 |
| 44. | Wassaic | 31.5% | 13.6% (+17.9)#44 | 12.5% (+19.0)#3,070 |
| 45. | Scio | 31.4% | 13.6% (+17.8)#45 | 12.5% (+18.9)#3,098 |
| 46. | Hunt | 31.0% | 13.6% (+17.3)#46 | 12.5% (+18.4)#3,198 |
| 47. | Quogue | 30.3% | 13.6% (+16.7)#47 | 12.5% (+17.8)#3,340 |
| 48. | Philadelphia | 29.9% | 13.6% (+16.3)#48 | 12.5% (+17.3)#3,433 |
| 49. | Syracuse | 29.6% | 13.6% (+16.0)#49 | 12.5% (+17.0)#3,503 |
| 50. | Endicott | 29.5% | 13.6% (+15.9)#50 | 12.5% (+16.9)#3,543 |
| 51. | Bridgewater | 28.7% | 13.6% (+15.1)#51 | 12.5% (+16.1)#3,761 |
| 52. | Sunset Bay | 28.6% | 13.6% (+15.0)#52 | 12.5% (+16.0)#3,799 |
| 53. | Jamestown | 28.2% | 13.6% (+14.6)#53 | 12.5% (+15.7)#3,911 |
| 54. | Utica | 28.2% | 13.6% (+14.6)#54 | 12.5% (+15.6)#3,924 |
| 55. | Jeffersonville | 28.0% | 13.6% (+14.4)#55 | 12.5% (+15.5)#3,967 |
| 56. | Rochester | 27.9% | 13.6% (+14.3)#56 | 12.5% (+15.4)#3,998 |
| 57. | South Dayton | 27.9% | 13.6% (+14.2)#57 | 12.5% (+15.3)#4,027 |
| 58. | Dundee | 27.8% | 13.6% (+14.2)#58 | 12.5% (+15.2)#4,062 |
| 59. | Edmeston | 27.7% | 13.6% (+14.1)#59 | 12.5% (+15.2)#4,077 |
| 60. | Whitehall | 27.7% | 13.6% (+14.0)#60 | 12.5% (+15.1)#4,090 |
| 61. | Elmira | 27.6% | 13.6% (+14.0)#61 | 12.5% (+15.1)#4,093 |
| 62. | Laurens | 27.6% | 13.6% (+14.0)#62 | 12.5% (+15.0)#4,126 |
| 63. | Whitney Point | 27.5% | 13.6% (+13.9)#63 | 12.5% (+15.0)#4,148 |
| 64. | Swan Lake | 27.3% | 13.6% (+13.7)#64 | 12.5% (+14.8)#4,209 |
| 65. | Spencer | 27.3% | 13.6% (+13.7)#65 | 12.5% (+14.7)#4,215 |
| 66. | South Fallsburg | 27.2% | 13.6% (+13.6)#66 | 12.5% (+14.7)#4,234 |
| 67. | Tivoli | 27.2% | 13.6% (+13.6)#67 | 12.5% (+14.6)#4,256 |
| 68. | Buffalo | 27.2% | 13.6% (+13.6)#68 | 12.5% (+14.6)#4,261 |
| 69. | Richburg | 27.2% | 13.6% (+13.6)#69 | 12.5% (+14.6)#4,263 |
| 70. | Gouverneur | 27.2% | 13.6% (+13.5)#70 | 12.5% (+14.6)#4,266 |
| 71. | Bliss | 27.1% | 13.6% (+13.5)#71 | 12.5% (+14.6)#4,268 |
| 72. | St Johnsville | 27.0% | 13.6% (+13.4)#72 | 12.5% (+14.5)#4,305 |
| 73. | Hunter | 27.0% | 13.6% (+13.4)#73 | 12.5% (+14.5)#4,319 |
| 74. | Lime Lake | 26.8% | 13.6% (+13.2)#74 | 12.5% (+14.3)#4,369 |
| 75. | Hammond | 26.8% | 13.6% (+13.2)#75 | 12.5% (+14.3)#4,377 |
| 76. | Edwards | 26.8% | 13.6% (+13.2)#76 | 12.5% (+14.3)#4,385 |
| 77. | East Durham | 26.6% | 13.6% (+12.9)#77 | 12.5% (+14.0)#4,472 |
| 78. | Rushford | 26.5% | 13.6% (+12.9)#78 | 12.5% (+14.0)#4,481 |
| 79. | Romulus | 26.5% | 13.6% (+12.9)#79 | 12.5% (+14.0)#4,490 |
| 80. | Newburgh | 26.5% | 13.6% (+12.9)#80 | 12.5% (+13.9)#4,497 |
| 81. | Lacona | 26.4% | 13.6% (+12.8)#81 | 12.5% (+13.9)#4,508 |
| 82. | Malone | 26.3% | 13.6% (+12.7)#82 | 12.5% (+13.8)#4,541 |
| 83. | Great Bend | 26.1% | 13.6% (+12.5)#83 | 12.5% (+13.5)#4,634 |
| 84. | East Randolph | 26.0% | 13.6% (+12.4)#84 | 12.5% (+13.5)#4,656 |
| 85. | Green Island | 26.0% | 13.6% (+12.4)#85 | 12.5% (+13.5)#4,662 |
| 86. | Dover Plains | 26.0% | 13.6% (+12.4)#86 | 12.5% (+13.5)#4,674 |
| 87. | Brocton | 25.8% | 13.6% (+12.2)#87 | 12.5% (+13.3)#4,735 |
| 88. | Salamanca | 25.8% | 13.6% (+12.2)#88 | 12.5% (+13.3)#4,740 |
| 89. | Monticello | 25.6% | 13.6% (+12.0)#89 | 12.5% (+13.1)#4,798 |
| 90. | Viola | 25.5% | 13.6% (+11.9)#90 | 12.5% (+13.0)#4,837 |
| 91. | Richfield Springs | 25.5% | 13.6% (+11.9)#91 | 12.5% (+12.9)#4,854 |
| 92. | Granville | 25.5% | 13.6% (+11.9)#92 | 12.5% (+12.9)#4,869 |
| 93. | Oswego | 25.4% | 13.6% (+11.8)#93 | 12.5% (+12.9)#4,874 |
| 94. | Spring Valley | 25.3% | 13.6% (+11.7)#94 | 12.5% (+12.7)#4,937 |
| 95. | Walton | 25.3% | 13.6% (+11.7)#95 | 12.5% (+12.7)#4,940 |
| 96. | Little Falls | 25.1% | 13.6% (+11.5)#96 | 12.5% (+12.6)#4,990 |
| 97. | Perrysburg | 25.1% | 13.6% (+11.5)#97 | 12.5% (+12.5)#5,023 |
| 98. | Niagara Falls | 25.1% | 13.6% (+11.5)#98 | 12.5% (+12.5)#5,024 |
| 99. | Lyons | 25.0% | 13.6% (+11.4)#99 | 12.5% (+12.5)#5,038 |
| 100. | Dunkirk | 24.9% | 13.6% (+11.3)#100 | 12.5% (+12.3)#5,104 |
Common Questions
What are the Top 10 Cities with the Highest Poverty Level in New York?
Top 10 Cities with the Highest Poverty Level in New York are:
#1
100.0%
#2
100.0%
#3
64.2%
#4
63.4%
#5
63.3%
#6
60.4%
#7
58.5%
#8
57.6%
#9
52.0%
#10
49.0%
What city has the Highest Poverty Level in New York?
SUNY Oswego has the Highest Poverty Level in New York with 100.0%.
What is the Poverty Level in the State of New York?
Poverty Level in New York is 13.6%.
What is the Poverty Level in the United States?
Poverty Level in the United States is 12.5%.