Cities with the Most Immigrants from Oceania in Colorado
RELATED REPORTS & OPTIONS
Oceania
Colorado
Compare Cities
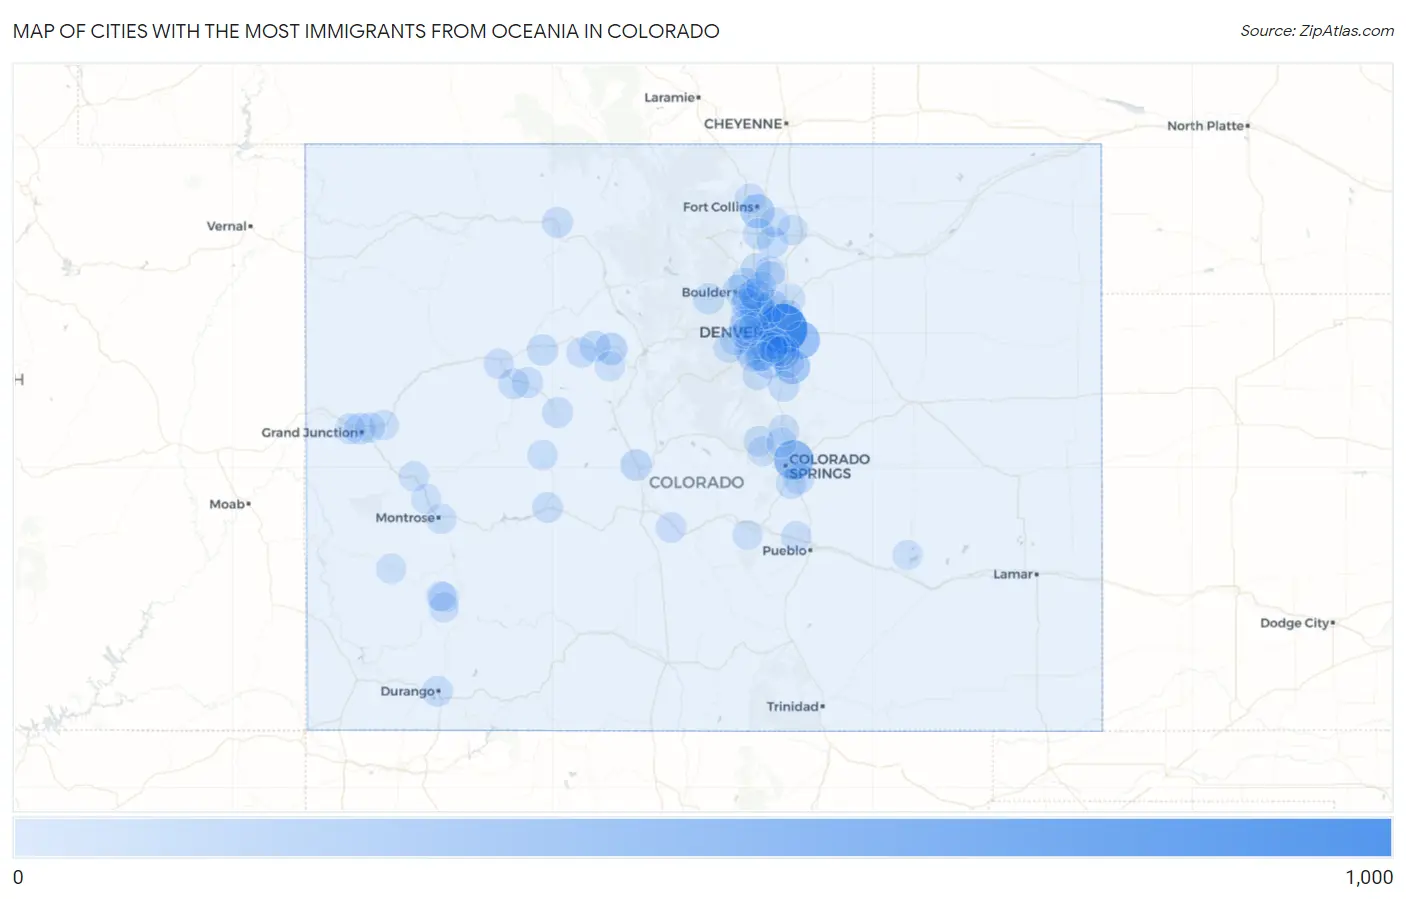
Map of Cities with the Most Immigrants from Oceania in Colorado
0
1,000
Cities with the Most Immigrants from Oceania in Colorado
| City | Oceania | vs State | vs National | |
| 1. | Denver | 913 | 5,514(16.56%)#1 | 293,459(0.31%)#36 |
| 2. | Colorado Springs | 424 | 5,514(7.69%)#2 | 293,459(0.14%)#92 |
| 3. | Aurora | 333 | 5,514(6.04%)#3 | 293,459(0.11%)#134 |
| 4. | Parker | 242 | 5,514(4.39%)#4 | 293,459(0.08%)#205 |
| 5. | Centennial | 220 | 5,514(3.99%)#5 | 293,459(0.07%)#223 |
| 6. | Westminster | 211 | 5,514(3.83%)#6 | 293,459(0.07%)#230 |
| 7. | Fort Collins | 181 | 5,514(3.28%)#7 | 293,459(0.06%)#271 |
| 8. | Broomfield | 175 | 5,514(3.17%)#8 | 293,459(0.06%)#285 |
| 9. | Federal Heights | 106 | 5,514(1.92%)#9 | 293,459(0.04%)#453 |
| 10. | Thornton | 105 | 5,514(1.90%)#10 | 293,459(0.04%)#455 |
| 11. | Highlands Ranch | 93 | 5,514(1.69%)#11 | 293,459(0.03%)#509 |
| 12. | Louisville | 93 | 5,514(1.69%)#12 | 293,459(0.03%)#513 |
| 13. | Vail | 89 | 5,514(1.61%)#13 | 293,459(0.03%)#539 |
| 14. | Englewood | 84 | 5,514(1.52%)#14 | 293,459(0.03%)#563 |
| 15. | Arvada | 79 | 5,514(1.43%)#15 | 293,459(0.03%)#587 |
| 16. | Gunbarrel | 78 | 5,514(1.41%)#16 | 293,459(0.03%)#594 |
| 17. | Buena Vista | 74 | 5,514(1.34%)#17 | 293,459(0.03%)#608 |
| 18. | Lakewood | 67 | 5,514(1.22%)#18 | 293,459(0.02%)#648 |
| 19. | Grand Junction | 65 | 5,514(1.18%)#19 | 293,459(0.02%)#670 |
| 20. | Boulder | 60 | 5,514(1.09%)#20 | 293,459(0.02%)#713 |
| 21. | Loveland | 52 | 5,514(0.94%)#21 | 293,459(0.02%)#803 |
| 22. | Gypsum | 50 | 5,514(0.91%)#22 | 293,459(0.02%)#826 |
| 23. | Longmont | 49 | 5,514(0.89%)#23 | 293,459(0.02%)#828 |
| 24. | Dakota Ridge | 49 | 5,514(0.89%)#24 | 293,459(0.02%)#829 |
| 25. | Avon | 49 | 5,514(0.89%)#25 | 293,459(0.02%)#842 |
| 26. | Nederland | 44 | 5,514(0.80%)#26 | 293,459(0.01%)#903 |
| 27. | Castle Rock | 43 | 5,514(0.78%)#27 | 293,459(0.01%)#909 |
| 28. | Superior | 43 | 5,514(0.78%)#28 | 293,459(0.01%)#918 |
| 29. | Johnstown | 40 | 5,514(0.73%)#29 | 293,459(0.01%)#968 |
| 30. | Stonegate | 38 | 5,514(0.69%)#30 | 293,459(0.01%)#1,011 |
| 31. | Aspen | 37 | 5,514(0.67%)#31 | 293,459(0.01%)#1,030 |
| 32. | El Jebel | 37 | 5,514(0.67%)#32 | 293,459(0.01%)#1,032 |
| 33. | Steamboat Springs | 36 | 5,514(0.65%)#33 | 293,459(0.01%)#1,045 |
| 34. | Durango | 35 | 5,514(0.63%)#34 | 293,459(0.01%)#1,065 |
| 35. | Ken Caryl | 33 | 5,514(0.60%)#35 | 293,459(0.01%)#1,105 |
| 36. | Security Widefield | 31 | 5,514(0.56%)#36 | 293,459(0.01%)#1,154 |
| 37. | Lafayette | 28 | 5,514(0.51%)#37 | 293,459(0.01%)#1,238 |
| 38. | Carbondale | 28 | 5,514(0.51%)#38 | 293,459(0.01%)#1,252 |
| 39. | Monument | 25 | 5,514(0.45%)#39 | 293,459(0.01%)#1,334 |
| 40. | Gunnison | 25 | 5,514(0.45%)#40 | 293,459(0.01%)#1,342 |
| 41. | Holly Hills | 24 | 5,514(0.44%)#41 | 293,459(0.01%)#1,382 |
| 42. | Fort Carson | 23 | 5,514(0.42%)#42 | 293,459(0.01%)#1,402 |
| 43. | Columbine | 22 | 5,514(0.40%)#43 | 293,459(0.01%)#1,435 |
| 44. | Greenwood Village | 21 | 5,514(0.38%)#44 | 293,459(0.01%)#1,479 |
| 45. | Evergreen | 21 | 5,514(0.38%)#45 | 293,459(0.01%)#1,486 |
| 46. | Howard | 21 | 5,514(0.38%)#46 | 293,459(0.01%)#1,506 |
| 47. | Woodland Park | 19 | 5,514(0.34%)#47 | 293,459(0.01%)#1,587 |
| 48. | Redlands | 18 | 5,514(0.33%)#48 | 293,459(0.01%)#1,647 |
| 49. | Firestone | 17 | 5,514(0.31%)#49 | 293,459(0.01%)#1,687 |
| 50. | Genesee | 17 | 5,514(0.31%)#50 | 293,459(0.01%)#1,702 |
| 51. | Greeley | 15 | 5,514(0.27%)#51 | 293,459(0.01%)#1,778 |
| 52. | Pueblo West | 15 | 5,514(0.27%)#52 | 293,459(0.01%)#1,788 |
| 53. | Edwards | 15 | 5,514(0.27%)#53 | 293,459(0.01%)#1,816 |
| 54. | Glenwood Springs | 15 | 5,514(0.27%)#54 | 293,459(0.01%)#1,820 |
| 55. | Frederick | 14 | 5,514(0.25%)#55 | 293,459(0.00%)#1,879 |
| 56. | West Pleasant View | 13 | 5,514(0.24%)#56 | 293,459(0.00%)#1,974 |
| 57. | Telluride | 13 | 5,514(0.24%)#57 | 293,459(0.00%)#1,992 |
| 58. | Mount Crested Butte | 13 | 5,514(0.24%)#58 | 293,459(0.00%)#1,998 |
| 59. | Commerce City | 12 | 5,514(0.22%)#59 | 293,459(0.00%)#2,006 |
| 60. | Fairmount | 11 | 5,514(0.20%)#60 | 293,459(0.00%)#2,142 |
| 61. | Roxborough Park | 11 | 5,514(0.20%)#61 | 293,459(0.00%)#2,147 |
| 62. | Erie | 10 | 5,514(0.18%)#62 | 293,459(0.00%)#2,196 |
| 63. | Montrose | 10 | 5,514(0.18%)#63 | 293,459(0.00%)#2,209 |
| 64. | Applewood | 10 | 5,514(0.18%)#64 | 293,459(0.00%)#2,229 |
| 65. | Delta | 9 | 5,514(0.16%)#65 | 293,459(0.00%)#2,321 |
| 66. | Palisade | 9 | 5,514(0.16%)#66 | 293,459(0.00%)#2,353 |
| 67. | Laporte | 9 | 5,514(0.16%)#67 | 293,459(0.00%)#2,354 |
| 68. | Littleton | 8 | 5,514(0.15%)#68 | 293,459(0.00%)#2,385 |
| 69. | Wheat Ridge | 7 | 5,514(0.13%)#69 | 293,459(0.00%)#2,499 |
| 70. | Cherry Creek | 7 | 5,514(0.13%)#70 | 293,459(0.00%)#2,519 |
| 71. | Fruitvale | 7 | 5,514(0.13%)#71 | 293,459(0.00%)#2,535 |
| 72. | Red Cliff | 7 | 5,514(0.13%)#72 | 293,459(0.00%)#2,586 |
| 73. | Cherry Hills Village | 6 | 5,514(0.11%)#73 | 293,459(0.00%)#2,647 |
| 74. | Ordway | 5 | 5,514(0.09%)#74 | 293,459(0.00%)#2,779 |
| 75. | Green Mountain Falls | 5 | 5,514(0.09%)#75 | 293,459(0.00%)#2,803 |
| 76. | Ophir | 5 | 5,514(0.09%)#76 | 293,459(0.00%)#2,811 |
| 77. | Brighton | 4 | 5,514(0.07%)#77 | 293,459(0.00%)#2,820 |
| 78. | Windsor | 4 | 5,514(0.07%)#78 | 293,459(0.00%)#2,822 |
| 79. | Norwood | 4 | 5,514(0.07%)#79 | 293,459(0.00%)#2,903 |
| 80. | Olathe | 3 | 5,514(0.05%)#80 | 293,459(0.00%)#2,953 |
| 81. | Mountain Village | 3 | 5,514(0.05%)#81 | 293,459(0.00%)#2,966 |
| 82. | Air Force Academy | 2 | 5,514(0.04%)#82 | 293,459(0.00%)#3,032 |
| 83. | Rockvale | 2 | 5,514(0.04%)#83 | 293,459(0.00%)#3,088 |
Common Questions
What are the Top 10 Cities with the Most Immigrants from Oceania in Colorado?
Top 10 Cities with the Most Immigrants from Oceania in Colorado are:
#1
913
#2
424
#3
333
#4
242
#5
220
#6
211
#7
181
#8
175
#9
106
#10
105
What city has the Most Immigrants from Oceania in Colorado?
Denver has the Most Immigrants from Oceania in Colorado with 913.
What is the Total Immigrants from Oceania in the State of Colorado?
Total Immigrants from Oceania in Colorado is 5,514.
What is the Total Immigrants from Oceania in the United States?
Total Immigrants from Oceania in the United States is 293,459.