Cities with the Most Immigrants from Oceania in Tennessee
RELATED REPORTS & OPTIONS
Oceania
Tennessee
Compare Cities
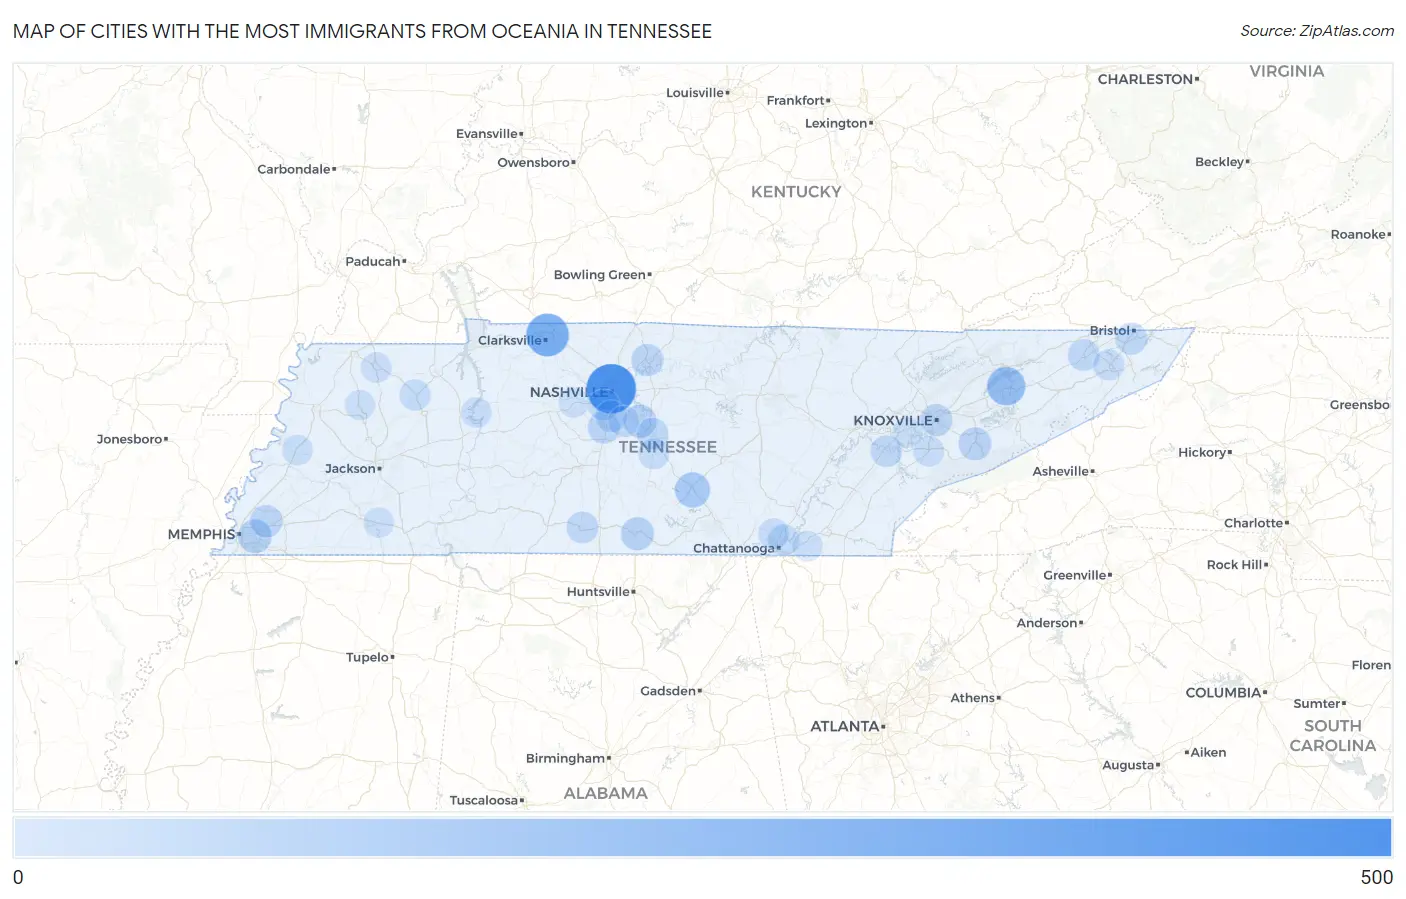
Map of Cities with the Most Immigrants from Oceania in Tennessee
0
500
Cities with the Most Immigrants from Oceania in Tennessee
| City | Oceania | vs State | vs National | |
| 1. | Nashville | 409 | 2,217(18.45%)#1 | 293,459(0.14%)#98 |
| 2. | Clarksville | 262 | 2,217(11.82%)#2 | 293,459(0.09%)#186 |
| 3. | Morristown | 168 | 2,217(7.58%)#3 | 293,459(0.06%)#290 |
| 4. | Manchester | 101 | 2,217(4.56%)#4 | 293,459(0.03%)#476 |
| 5. | Memphis | 71 | 2,217(3.20%)#5 | 293,459(0.02%)#623 |
| 6. | Smyrna | 60 | 2,217(2.71%)#6 | 293,459(0.02%)#715 |
| 7. | Fayetteville | 60 | 2,217(2.71%)#7 | 293,459(0.02%)#724 |
| 8. | Pigeon Forge | 55 | 2,217(2.48%)#8 | 293,459(0.02%)#776 |
| 9. | Bartlett | 46 | 2,217(2.07%)#9 | 293,459(0.02%)#870 |
| 10. | Knoxville | 43 | 2,217(1.94%)#10 | 293,459(0.01%)#904 |
| 11. | Franklin | 41 | 2,217(1.85%)#11 | 293,459(0.01%)#947 |
| 12. | Gallatin | 40 | 2,217(1.80%)#12 | 293,459(0.01%)#962 |
| 13. | Bristol | 37 | 2,217(1.67%)#13 | 293,459(0.01%)#1,024 |
| 14. | Brentwood | 34 | 2,217(1.53%)#14 | 293,459(0.01%)#1,079 |
| 15. | Pulaski | 34 | 2,217(1.53%)#15 | 293,459(0.01%)#1,091 |
| 16. | Fall Branch | 34 | 2,217(1.53%)#16 | 293,459(0.01%)#1,098 |
| 17. | Murfreesboro | 32 | 2,217(1.44%)#17 | 293,459(0.01%)#1,123 |
| 18. | Loudon | 31 | 2,217(1.40%)#18 | 293,459(0.01%)#1,168 |
| 19. | Forest Hills | 23 | 2,217(1.04%)#19 | 293,459(0.01%)#1,417 |
| 20. | Mckenzie | 21 | 2,217(0.95%)#20 | 293,459(0.01%)#1,489 |
| 21. | Chattanooga | 18 | 2,217(0.81%)#21 | 293,459(0.01%)#1,610 |
| 22. | Johnson City | 16 | 2,217(0.72%)#22 | 293,459(0.01%)#1,723 |
| 23. | Nolensville | 15 | 2,217(0.68%)#23 | 293,459(0.01%)#1,809 |
| 24. | Signal Mountain | 14 | 2,217(0.63%)#24 | 293,459(0.00%)#1,889 |
| 25. | Christiana | 13 | 2,217(0.59%)#25 | 293,459(0.00%)#1,976 |
| 26. | Maryville | 12 | 2,217(0.54%)#26 | 293,459(0.00%)#2,021 |
| 27. | Ripley | 8 | 2,217(0.36%)#27 | 293,459(0.00%)#2,428 |
| 28. | New Johnsonville | 6 | 2,217(0.27%)#28 | 293,459(0.00%)#2,680 |
| 29. | Martin | 4 | 2,217(0.18%)#29 | 293,459(0.00%)#2,842 |
| 30. | Farragut | 3 | 2,217(0.14%)#30 | 293,459(0.00%)#2,918 |
| 31. | Collegedale | 3 | 2,217(0.14%)#31 | 293,459(0.00%)#2,927 |
| 32. | Kingston Springs | 3 | 2,217(0.14%)#32 | 293,459(0.00%)#2,947 |
| 33. | Hornsby | 3 | 2,217(0.14%)#33 | 293,459(0.00%)#3,009 |
| 34. | Dyer | 1 | 2,217(0.05%)#34 | 293,459(0.00%)#3,150 |
Common Questions
What are the Top 10 Cities with the Most Immigrants from Oceania in Tennessee?
Top 10 Cities with the Most Immigrants from Oceania in Tennessee are:
#1
409
#2
262
#3
168
#4
101
#5
71
#6
60
#7
60
#8
55
#9
46
#10
43
What city has the Most Immigrants from Oceania in Tennessee?
Nashville has the Most Immigrants from Oceania in Tennessee with 409.
What is the Total Immigrants from Oceania in the State of Tennessee?
Total Immigrants from Oceania in Tennessee is 2,217.
What is the Total Immigrants from Oceania in the United States?
Total Immigrants from Oceania in the United States is 293,459.