Cities with the Most Immigrants from Oceania in Arizona
RELATED REPORTS & OPTIONS
Oceania
Arizona
Compare Cities
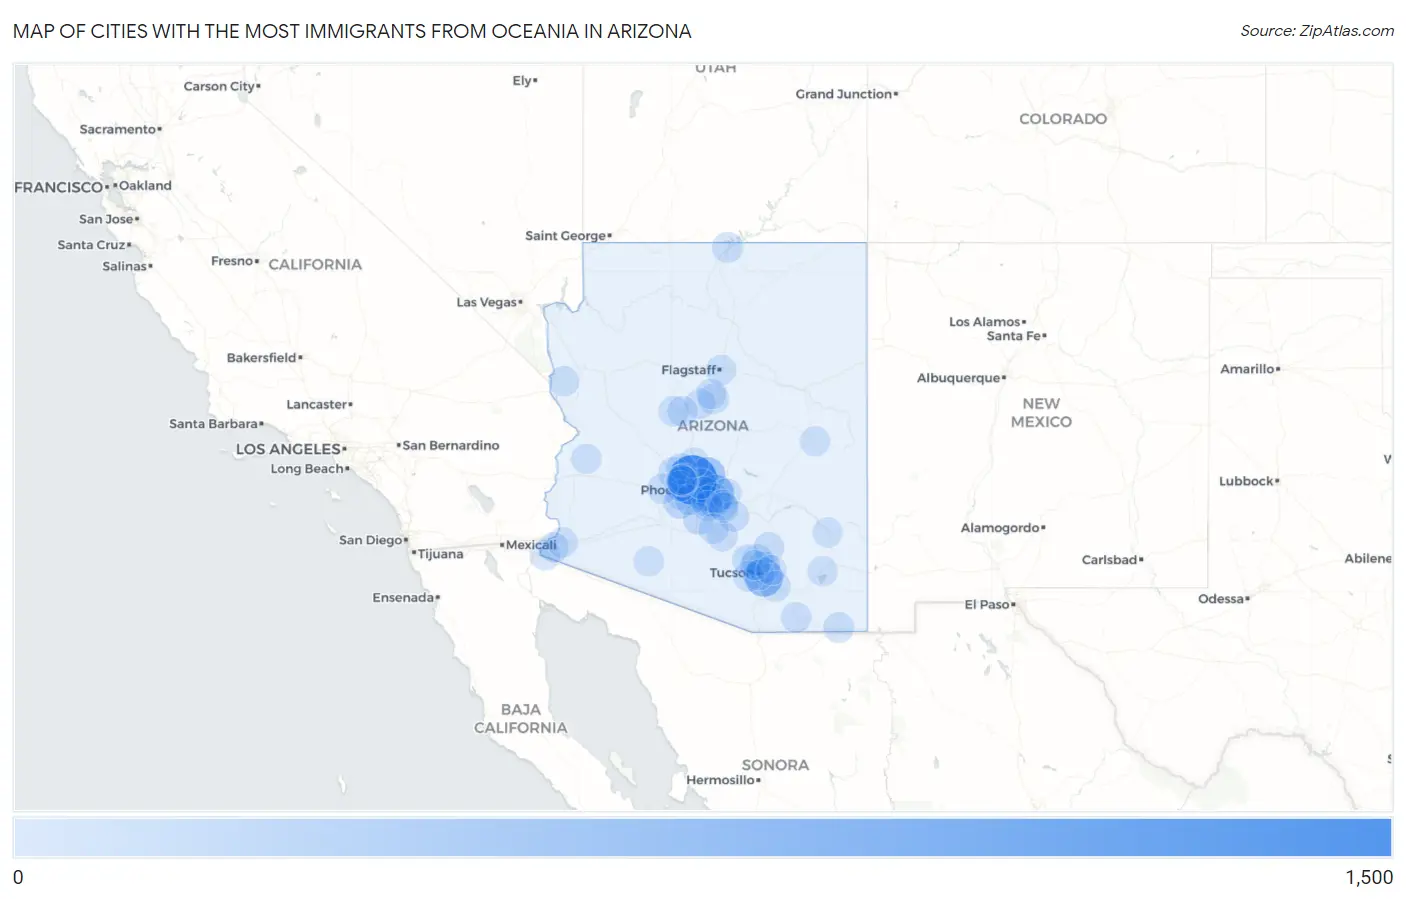
Map of Cities with the Most Immigrants from Oceania in Arizona
0
1,500
Cities with the Most Immigrants from Oceania in Arizona
| City | Oceania | vs State | vs National | |
| 1. | Phoenix | 1,381 | 5,326(25.93%)#1 | 293,459(0.47%)#23 |
| 2. | Tucson | 567 | 5,326(10.65%)#2 | 293,459(0.19%)#63 |
| 3. | Mesa | 560 | 5,326(10.51%)#3 | 293,459(0.19%)#68 |
| 4. | Scottsdale | 381 | 5,326(7.15%)#4 | 293,459(0.13%)#113 |
| 5. | Tempe | 286 | 5,326(5.37%)#5 | 293,459(0.10%)#167 |
| 6. | Gilbert | 260 | 5,326(4.88%)#6 | 293,459(0.09%)#188 |
| 7. | Goodyear | 160 | 5,326(3.00%)#7 | 293,459(0.05%)#313 |
| 8. | Catalina Foothills | 130 | 5,326(2.44%)#8 | 293,459(0.04%)#381 |
| 9. | Maricopa | 105 | 5,326(1.97%)#9 | 293,459(0.04%)#458 |
| 10. | Chandler | 90 | 5,326(1.69%)#10 | 293,459(0.03%)#525 |
| 11. | Surprise | 72 | 5,326(1.35%)#11 | 293,459(0.02%)#616 |
| 12. | Oro Valley | 70 | 5,326(1.31%)#12 | 293,459(0.02%)#632 |
| 13. | Glendale | 59 | 5,326(1.11%)#13 | 293,459(0.02%)#726 |
| 14. | Marana | 59 | 5,326(1.11%)#14 | 293,459(0.02%)#733 |
| 15. | Oracle | 55 | 5,326(1.03%)#15 | 293,459(0.02%)#777 |
| 16. | Avondale | 54 | 5,326(1.01%)#16 | 293,459(0.02%)#782 |
| 17. | Page | 51 | 5,326(0.96%)#17 | 293,459(0.02%)#818 |
| 18. | Peoria | 41 | 5,326(0.77%)#18 | 293,459(0.01%)#943 |
| 19. | Apache Junction | 41 | 5,326(0.77%)#19 | 293,459(0.01%)#952 |
| 20. | Florence | 39 | 5,326(0.73%)#20 | 293,459(0.01%)#985 |
| 21. | Douglas | 38 | 5,326(0.71%)#21 | 293,459(0.01%)#1,007 |
| 22. | Vail | 38 | 5,326(0.71%)#22 | 293,459(0.01%)#1,009 |
| 23. | Prescott | 31 | 5,326(0.58%)#23 | 293,459(0.01%)#1,152 |
| 24. | South Tucson | 31 | 5,326(0.58%)#24 | 293,459(0.01%)#1,170 |
| 25. | Eloy | 30 | 5,326(0.56%)#25 | 293,459(0.01%)#1,186 |
| 26. | Tucson Estates | 28 | 5,326(0.53%)#26 | 293,459(0.01%)#1,245 |
| 27. | Village Of Oak Creek Big Park | 28 | 5,326(0.53%)#27 | 293,459(0.01%)#1,253 |
| 28. | Sierra Vista | 27 | 5,326(0.51%)#28 | 293,459(0.01%)#1,258 |
| 29. | San Luis | 27 | 5,326(0.51%)#29 | 293,459(0.01%)#1,260 |
| 30. | Sun Lakes | 27 | 5,326(0.51%)#30 | 293,459(0.01%)#1,273 |
| 31. | Komatke | 27 | 5,326(0.51%)#31 | 293,459(0.01%)#1,287 |
| 32. | Queen Creek | 26 | 5,326(0.49%)#32 | 293,459(0.01%)#1,291 |
| 33. | Fortuna Foothills | 25 | 5,326(0.47%)#33 | 293,459(0.01%)#1,321 |
| 34. | Cottonwood | 25 | 5,326(0.47%)#34 | 293,459(0.01%)#1,331 |
| 35. | Litchfield Park | 25 | 5,326(0.47%)#35 | 293,459(0.01%)#1,340 |
| 36. | Paradise Valley | 23 | 5,326(0.43%)#36 | 293,459(0.01%)#1,406 |
| 37. | Buckeye | 19 | 5,326(0.36%)#37 | 293,459(0.01%)#1,559 |
| 38. | Prescott Valley | 19 | 5,326(0.36%)#38 | 293,459(0.01%)#1,566 |
| 39. | Flagstaff | 17 | 5,326(0.32%)#39 | 293,459(0.01%)#1,667 |
| 40. | Oatman | 17 | 5,326(0.32%)#40 | 293,459(0.01%)#1,716 |
| 41. | Yuma | 16 | 5,326(0.30%)#41 | 293,459(0.01%)#1,719 |
| 42. | Casa Grande | 15 | 5,326(0.28%)#42 | 293,459(0.01%)#1,782 |
| 43. | Sun City | 15 | 5,326(0.28%)#43 | 293,459(0.01%)#1,785 |
| 44. | Sedona | 13 | 5,326(0.24%)#44 | 293,459(0.00%)#1,960 |
| 45. | San Tan Valley | 10 | 5,326(0.19%)#45 | 293,459(0.00%)#2,180 |
| 46. | Anthem | 10 | 5,326(0.19%)#46 | 293,459(0.00%)#2,206 |
| 47. | Youngtown | 10 | 5,326(0.19%)#47 | 293,459(0.00%)#2,233 |
| 48. | Casas Adobes | 9 | 5,326(0.17%)#48 | 293,459(0.00%)#2,270 |
| 49. | Pinetop Lakeside | 9 | 5,326(0.17%)#49 | 293,459(0.00%)#2,343 |
| 50. | Bouse | 8 | 5,326(0.15%)#50 | 293,459(0.00%)#2,462 |
| 51. | El Mirage | 7 | 5,326(0.13%)#51 | 293,459(0.00%)#2,493 |
| 52. | Ajo | 7 | 5,326(0.13%)#52 | 293,459(0.00%)#2,550 |
| 53. | Tanque Verde | 5 | 5,326(0.09%)#53 | 293,459(0.00%)#2,731 |
| 54. | Willcox | 5 | 5,326(0.09%)#54 | 293,459(0.00%)#2,763 |
| 55. | Thatcher | 4 | 5,326(0.08%)#55 | 293,459(0.00%)#2,854 |
Common Questions
What are the Top 10 Cities with the Most Immigrants from Oceania in Arizona?
Top 10 Cities with the Most Immigrants from Oceania in Arizona are:
#1
1,381
#2
567
#3
560
#4
381
#5
286
#6
260
#7
160
#8
130
#9
105
#10
90
What city has the Most Immigrants from Oceania in Arizona?
Phoenix has the Most Immigrants from Oceania in Arizona with 1,381.
What is the Total Immigrants from Oceania in the State of Arizona?
Total Immigrants from Oceania in Arizona is 5,326.
What is the Total Immigrants from Oceania in the United States?
Total Immigrants from Oceania in the United States is 293,459.