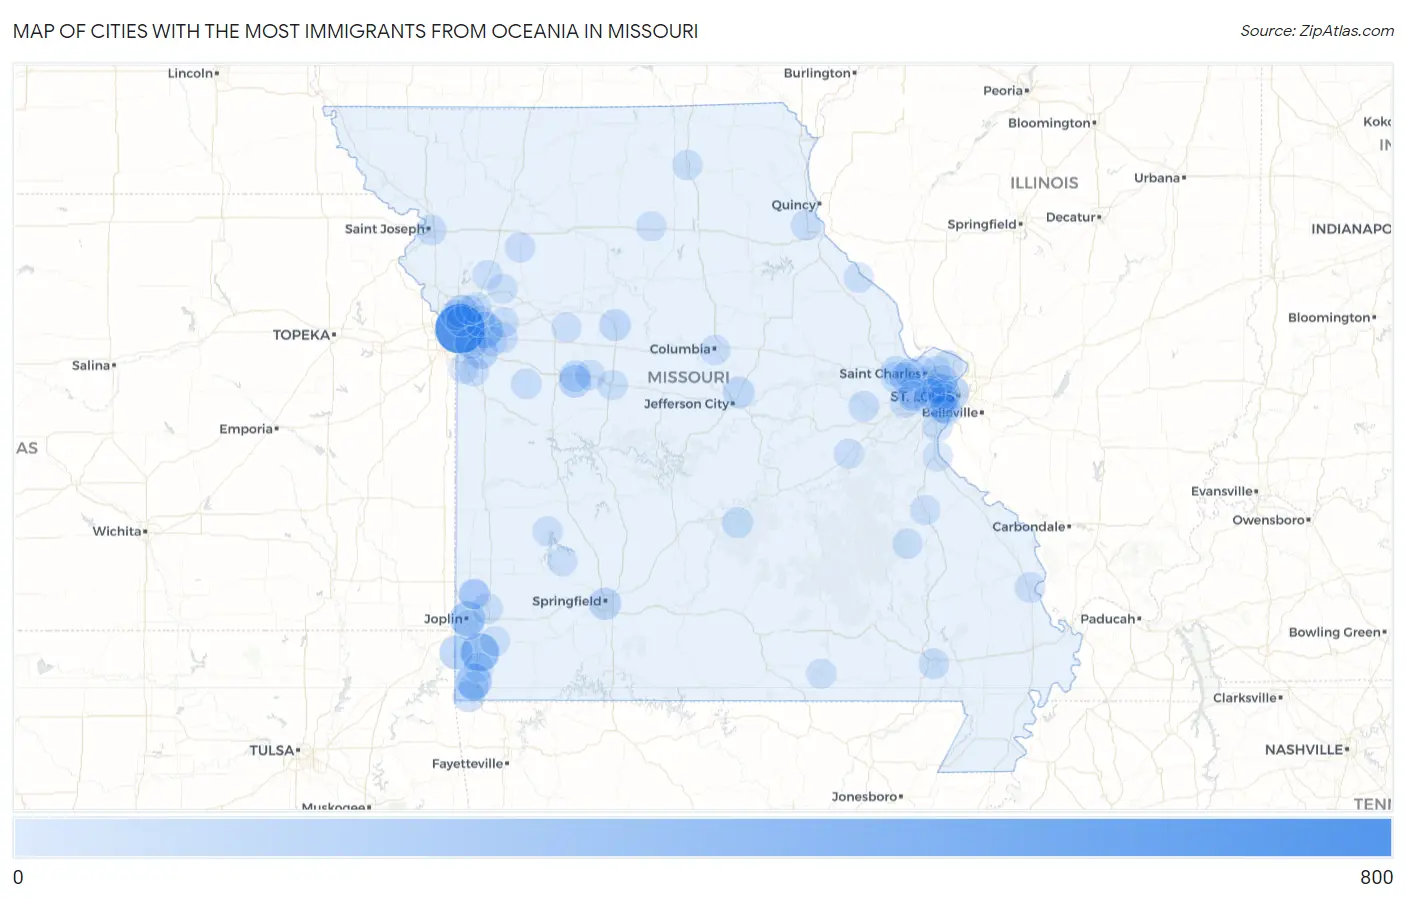
Cities with the Most Immigrants from Oceania in Missouri
RELATED REPORTS & OPTIONS
Oceania
Missouri
Compare Cities
Map of Cities with the Most Immigrants from Oceania in Missouri
0
800
Cities with the Most Immigrants from Oceania in Missouri
| City | Oceania | vs State | vs National | |
| 1. | Kansas City | 714 | 4,433(16.11%)#1 | 293,459(0.24%)#49 |
| 2. | Neosho | 303 | 4,433(6.84%)#2 | 293,459(0.10%)#155 |
| 3. | Independence | 208 | 4,433(4.69%)#3 | 293,459(0.07%)#233 |
| 4. | Anderson | 202 | 4,433(4.56%)#4 | 293,459(0.07%)#241 |
| 5. | Joplin | 175 | 4,433(3.95%)#5 | 293,459(0.06%)#286 |
| 6. | Seneca | 126 | 4,433(2.84%)#6 | 293,459(0.04%)#395 |
| 7. | St Louis | 119 | 4,433(2.68%)#7 | 293,459(0.04%)#414 |
| 8. | Lee S Summit | 109 | 4,433(2.46%)#8 | 293,459(0.04%)#439 |
| 9. | Gladstone | 101 | 4,433(2.28%)#9 | 293,459(0.03%)#475 |
| 10. | Raytown | 95 | 4,433(2.14%)#10 | 293,459(0.03%)#503 |
| 11. | Chesterfield | 90 | 4,433(2.03%)#11 | 293,459(0.03%)#529 |
| 12. | Whiteman Afb | 90 | 4,433(2.03%)#12 | 293,459(0.03%)#532 |
| 13. | Springfield | 77 | 4,433(1.74%)#13 | 293,459(0.03%)#596 |
| 14. | University City | 64 | 4,433(1.44%)#14 | 293,459(0.02%)#683 |
| 15. | Marshall | 60 | 4,433(1.35%)#15 | 293,459(0.02%)#722 |
| 16. | Noel | 60 | 4,433(1.35%)#16 | 293,459(0.02%)#725 |
| 17. | Holts Summit | 56 | 4,433(1.26%)#17 | 293,459(0.02%)#766 |
| 18. | Knob Noster | 45 | 4,433(1.02%)#18 | 293,459(0.02%)#892 |
| 19. | Maryland Heights | 44 | 4,433(0.99%)#19 | 293,459(0.01%)#896 |
| 20. | Sugar Creek | 43 | 4,433(0.97%)#20 | 293,459(0.01%)#927 |
| 21. | Dardenne Prairie | 40 | 4,433(0.90%)#21 | 293,459(0.01%)#969 |
| 22. | O Fallon | 33 | 4,433(0.74%)#22 | 293,459(0.01%)#1,100 |
| 23. | Northmoor | 32 | 4,433(0.72%)#23 | 293,459(0.01%)#1,148 |
| 24. | Fort Leonard Wood | 31 | 4,433(0.70%)#24 | 293,459(0.01%)#1,161 |
| 25. | St Charles | 30 | 4,433(0.68%)#25 | 293,459(0.01%)#1,177 |
| 26. | St Peters | 29 | 4,433(0.65%)#26 | 293,459(0.01%)#1,206 |
| 27. | Wildwood | 29 | 4,433(0.65%)#27 | 293,459(0.01%)#1,209 |
| 28. | Creve Coeur | 28 | 4,433(0.63%)#28 | 293,459(0.01%)#1,242 |
| 29. | Grain Valley | 27 | 4,433(0.61%)#29 | 293,459(0.01%)#1,272 |
| 30. | Palmyra | 24 | 4,433(0.54%)#30 | 293,459(0.01%)#1,379 |
| 31. | Carthage | 23 | 4,433(0.52%)#31 | 293,459(0.01%)#1,404 |
| 32. | Washington | 22 | 4,433(0.50%)#32 | 293,459(0.01%)#1,444 |
| 33. | Purcell | 22 | 4,433(0.50%)#33 | 293,459(0.01%)#1,459 |
| 34. | St Joseph | 20 | 4,433(0.45%)#34 | 293,459(0.01%)#1,516 |
| 35. | Poplar Bluff | 20 | 4,433(0.45%)#35 | 293,459(0.01%)#1,535 |
| 36. | Cottleville | 20 | 4,433(0.45%)#36 | 293,459(0.01%)#1,546 |
| 37. | Holden | 18 | 4,433(0.41%)#37 | 293,459(0.01%)#1,660 |
| 38. | Blue Summit | 18 | 4,433(0.41%)#38 | 293,459(0.01%)#1,663 |
| 39. | Des Peres | 17 | 4,433(0.38%)#39 | 293,459(0.01%)#1,695 |
| 40. | Columbia | 15 | 4,433(0.34%)#40 | 293,459(0.01%)#1,777 |
| 41. | Webster Groves | 14 | 4,433(0.32%)#41 | 293,459(0.00%)#1,868 |
| 42. | Kirksville | 14 | 4,433(0.32%)#42 | 293,459(0.00%)#1,876 |
| 43. | La Monte | 14 | 4,433(0.32%)#43 | 293,459(0.00%)#1,915 |
| 44. | Neck City | 14 | 4,433(0.32%)#44 | 293,459(0.00%)#1,919 |
| 45. | Cape Girardeau | 13 | 4,433(0.29%)#45 | 293,459(0.00%)#1,933 |
| 46. | Sedalia | 13 | 4,433(0.29%)#46 | 293,459(0.00%)#1,943 |
| 47. | Lemay | 13 | 4,433(0.29%)#47 | 293,459(0.00%)#1,952 |
| 48. | North Kansas City | 13 | 4,433(0.29%)#48 | 293,459(0.00%)#1,978 |
| 49. | Liberty | 12 | 4,433(0.27%)#49 | 293,459(0.00%)#2,025 |
| 50. | Raymore | 10 | 4,433(0.23%)#50 | 293,459(0.00%)#2,205 |
| 51. | Clarkson Valley | 10 | 4,433(0.23%)#51 | 293,459(0.00%)#2,255 |
| 52. | Affton | 9 | 4,433(0.20%)#52 | 293,459(0.00%)#2,294 |
| 53. | Olivette | 9 | 4,433(0.20%)#53 | 293,459(0.00%)#2,324 |
| 54. | Ironton | 9 | 4,433(0.20%)#54 | 293,459(0.00%)#2,361 |
| 55. | Kingston | 8 | 4,433(0.18%)#55 | 293,459(0.00%)#2,471 |
| 56. | Hazelwood | 7 | 4,433(0.16%)#56 | 293,459(0.00%)#2,501 |
| 57. | Arnold | 7 | 4,433(0.16%)#57 | 293,459(0.00%)#2,507 |
| 58. | Belton | 6 | 4,433(0.14%)#58 | 293,459(0.00%)#2,607 |
| 59. | Clayton | 6 | 4,433(0.14%)#59 | 293,459(0.00%)#2,615 |
| 60. | Maplewood | 6 | 4,433(0.14%)#60 | 293,459(0.00%)#2,645 |
| 61. | Leawood | 5 | 4,433(0.11%)#61 | 293,459(0.00%)#2,797 |
| 62. | Westwood | 5 | 4,433(0.11%)#62 | 293,459(0.00%)#2,808 |
| 63. | Kinloch | 5 | 4,433(0.11%)#63 | 293,459(0.00%)#2,809 |
| 64. | Blue Springs | 4 | 4,433(0.09%)#64 | 293,459(0.00%)#2,816 |
| 65. | Old Jamestown | 4 | 4,433(0.09%)#65 | 293,459(0.00%)#2,829 |
| 66. | Crystal City | 4 | 4,433(0.09%)#66 | 293,459(0.00%)#2,856 |
| 67. | Leadington | 4 | 4,433(0.09%)#67 | 293,459(0.00%)#2,895 |
| 68. | St George | 3 | 4,433(0.07%)#68 | 293,459(0.00%)#2,956 |
| 69. | Goodman | 3 | 4,433(0.07%)#69 | 293,459(0.00%)#2,972 |
| 70. | Lanagan | 3 | 4,433(0.07%)#70 | 293,459(0.00%)#3,004 |
| 71. | Louisiana | 2 | 4,433(0.05%)#71 | 293,459(0.00%)#3,038 |
| 72. | Buckner | 2 | 4,433(0.05%)#72 | 293,459(0.00%)#3,042 |
| 73. | Granby | 2 | 4,433(0.05%)#73 | 293,459(0.00%)#3,048 |
| 74. | Stockton | 2 | 4,433(0.05%)#74 | 293,459(0.00%)#3,051 |
| 75. | Corder | 2 | 4,433(0.05%)#75 | 293,459(0.00%)#3,091 |
| 76. | Oak Grove Village | 2 | 4,433(0.05%)#76 | 293,459(0.00%)#3,107 |
| 77. | Homestead | 2 | 4,433(0.05%)#77 | 293,459(0.00%)#3,122 |
| 78. | Pleasant Valley | 1 | 4,433(0.02%)#78 | 293,459(0.00%)#3,149 |
| 79. | Alton | 1 | 4,433(0.02%)#79 | 293,459(0.00%)#3,165 |
| 80. | Bucklin | 1 | 4,433(0.02%)#80 | 293,459(0.00%)#3,180 |
| 81. | Holt | 1 | 4,433(0.02%)#81 | 293,459(0.00%)#3,186 |
| 82. | Dadeville | 1 | 4,433(0.02%)#82 | 293,459(0.00%)#3,198 |
Common Questions
What are the Top 10 Cities with the Most Immigrants from Oceania in Missouri?
Top 10 Cities with the Most Immigrants from Oceania in Missouri are:
#1
714
#2
303
#3
208
#4
202
#5
175
#6
126
#7
119
#8
109
#9
101
#10
95
What city has the Most Immigrants from Oceania in Missouri?
Kansas City has the Most Immigrants from Oceania in Missouri with 714.
What is the Total Immigrants from Oceania in the State of Missouri?
Total Immigrants from Oceania in Missouri is 4,433.
What is the Total Immigrants from Oceania in the United States?
Total Immigrants from Oceania in the United States is 293,459.