Basin City, WA Map & Demographics
Basin City Map
Basin City Overview
$22,413
PER CAPITA INCOME
$104,025
AVG FAMILY INCOME
$104,025
AVG HOUSEHOLD INCOME
26.6%
WAGE / INCOME GAP [ % ]
73.4¢/ $1
WAGE / INCOME GAP [ $ ]
0.36
INEQUALITY / GINI INDEX
1,570
TOTAL POPULATION
671
MALE POPULATION
899
FEMALE POPULATION
74.64
MALES / 100 FEMALES
133.98
FEMALES / 100 MALES
23.0
MEDIAN AGE
4.7
AVG FAMILY SIZE
4.7
AVG HOUSEHOLD SIZE
640
LABOR FORCE [ PEOPLE ]
62.1%
PERCENT IN LABOR FORCE
Income in Basin City
Income Overview in Basin City
Per Capita Income in Basin City is $22,413, while median incomes of families and households are $104,025 and $104,025 respectively.
| Characteristic | Number | Measure |
| Per Capita Income | 1,570 | $22,413 |
| Median Family Income | 337 | $104,025 |
| Mean Family Income | 337 | $111,429 |
| Median Household Income | 337 | $104,025 |
| Mean Household Income | 337 | $111,429 |
| Income Deficit | 337 | $0 |
| Wage / Income Gap (%) | 1,570 | 26.57% |
| Wage / Income Gap ($) | 1,570 | 73.43¢ per $1 |
| Gini / Inequality Index | 1,570 | 0.36 |
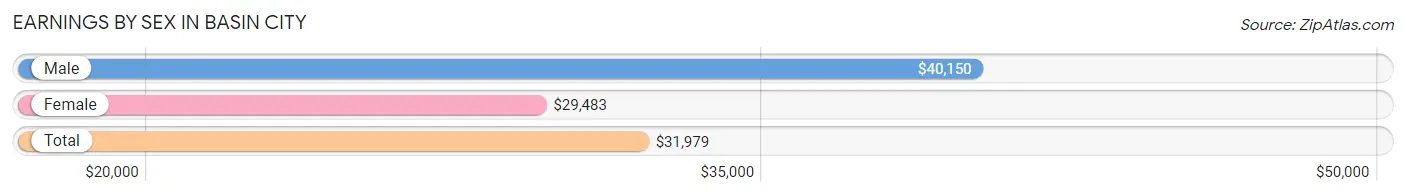
Earnings by Sex in Basin City
Average Earnings in Basin City are $31,979, $40,150 for men and $29,483 for women, a difference of 26.6%.
| Sex | Number | Average Earnings |
| Male | 392 (49.4%) | $40,150 |
| Female | 401 (50.6%) | $29,483 |
| Total | 793 (100.0%) | $31,979 |
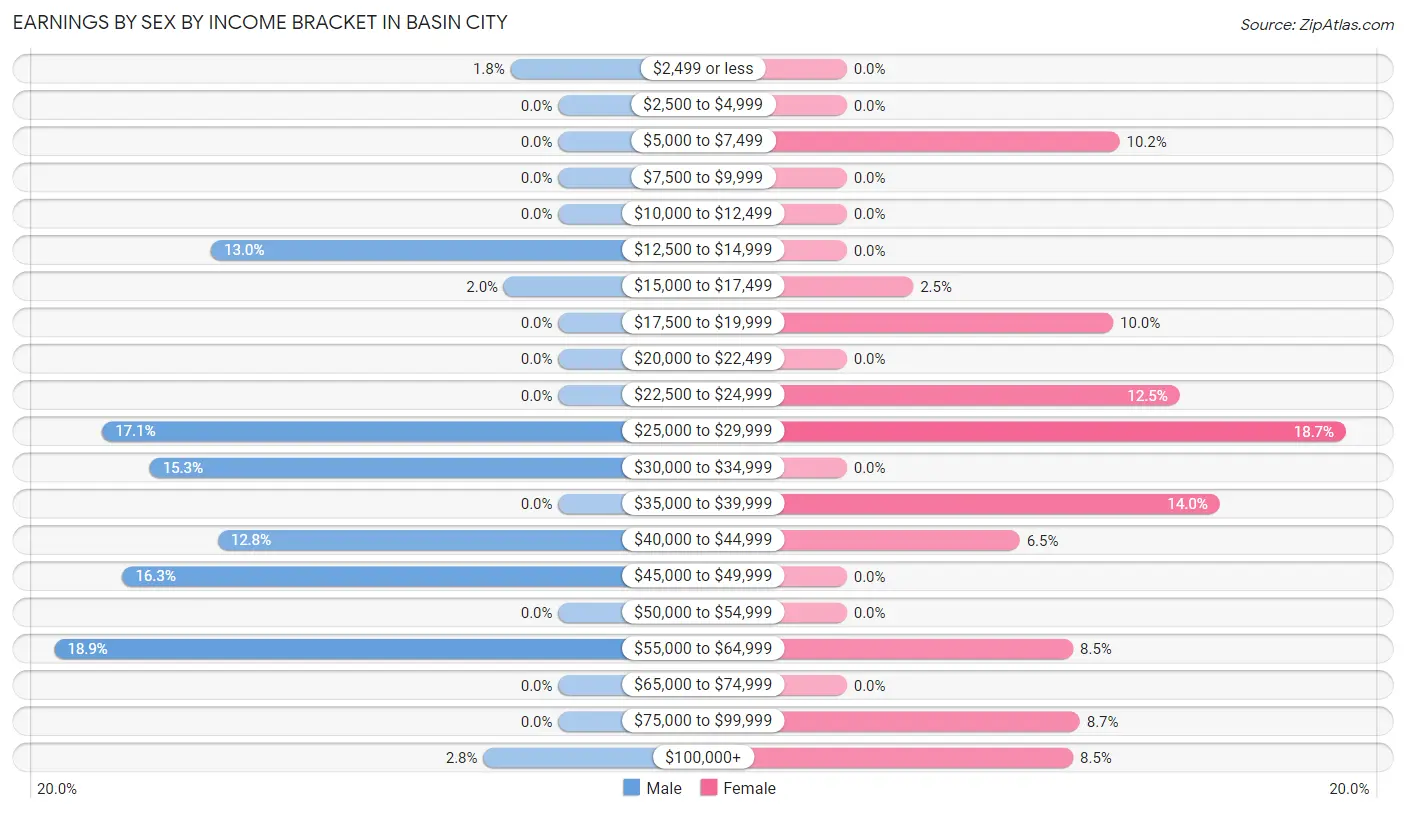
Earnings by Sex by Income Bracket in Basin City
The most common earnings brackets in Basin City are $55,000 to $64,999 for men (74 | 18.9%) and $25,000 to $29,999 for women (75 | 18.7%).
| Income | Male | Female |
| $2,499 or less | 7 (1.8%) | 0 (0.0%) |
| $2,500 to $4,999 | 0 (0.0%) | 0 (0.0%) |
| $5,000 to $7,499 | 0 (0.0%) | 41 (10.2%) |
| $7,500 to $9,999 | 0 (0.0%) | 0 (0.0%) |
| $10,000 to $12,499 | 0 (0.0%) | 0 (0.0%) |
| $12,500 to $14,999 | 51 (13.0%) | 0 (0.0%) |
| $15,000 to $17,499 | 8 (2.0%) | 10 (2.5%) |
| $17,500 to $19,999 | 0 (0.0%) | 40 (10.0%) |
| $20,000 to $22,499 | 0 (0.0%) | 0 (0.0%) |
| $22,500 to $24,999 | 0 (0.0%) | 50 (12.5%) |
| $25,000 to $29,999 | 67 (17.1%) | 75 (18.7%) |
| $30,000 to $34,999 | 60 (15.3%) | 0 (0.0%) |
| $35,000 to $39,999 | 0 (0.0%) | 56 (14.0%) |
| $40,000 to $44,999 | 50 (12.8%) | 26 (6.5%) |
| $45,000 to $49,999 | 64 (16.3%) | 0 (0.0%) |
| $50,000 to $54,999 | 0 (0.0%) | 0 (0.0%) |
| $55,000 to $64,999 | 74 (18.9%) | 34 (8.5%) |
| $65,000 to $74,999 | 0 (0.0%) | 0 (0.0%) |
| $75,000 to $99,999 | 0 (0.0%) | 35 (8.7%) |
| $100,000+ | 11 (2.8%) | 34 (8.5%) |
| Total | 392 (100.0%) | 401 (100.0%) |
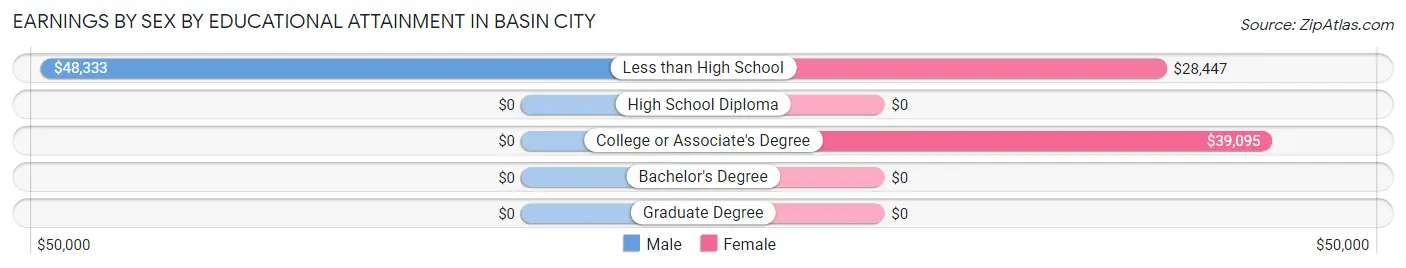
Earnings by Sex by Educational Attainment in Basin City
Average earnings in Basin City are $46,176 for men and $37,759 for women, a difference of 18.2%. Men with an educational attainment of less than high school enjoy the highest average annual earnings of $48,333, while those with less than high school education earn the least with $48,333. Women with an educational attainment of college or associate's degree earn the most with the average annual earnings of $39,095, while those with less than high school education have the smallest earnings of $28,447.
| Educational Attainment | Male Income | Female Income |
| Less than High School | $48,333 | $28,447 |
| High School Diploma | - | - |
| College or Associate's Degree | - | - |
| Bachelor's Degree | - | - |
| Graduate Degree | - | - |
| Total | $46,176 | $37,759 |
Family Income in Basin City
Family Income Brackets in Basin City
According to the Basin City family income data, there are 124 families falling into the $100,000 to $149,999 income range, which is the most common income bracket and makes up 36.8% of all families.
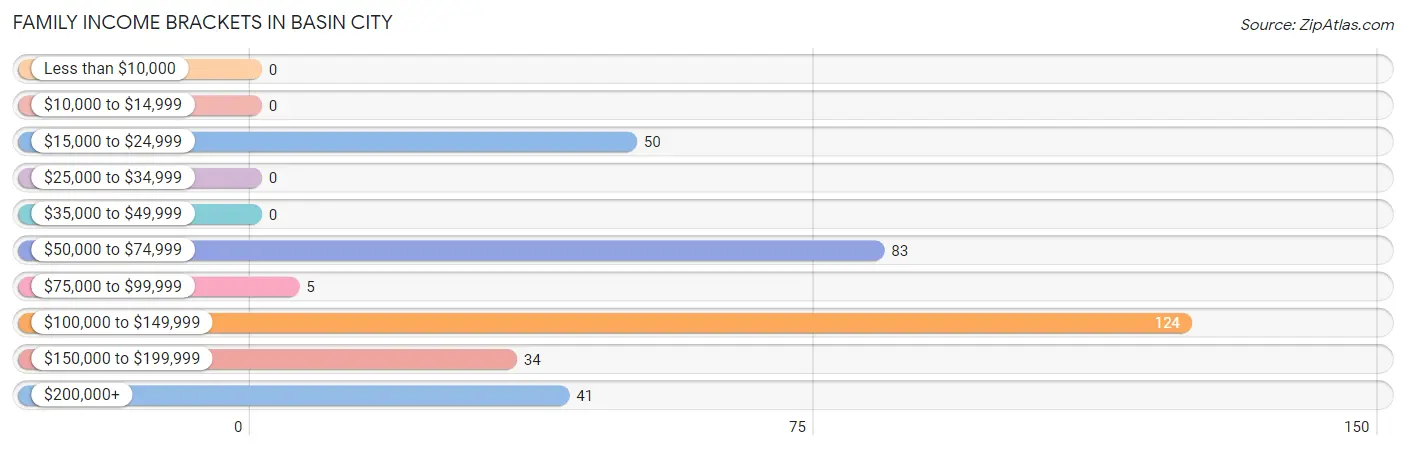
| Income Bracket | # Families | % Families |
| Less than $10,000 | 0 | 0.0% |
| $10,000 to $14,999 | 0 | 0.0% |
| $15,000 to $24,999 | 50 | 14.8% |
| $25,000 to $34,999 | 0 | 0.0% |
| $35,000 to $49,999 | 0 | 0.0% |
| $50,000 to $74,999 | 83 | 24.6% |
| $75,000 to $99,999 | 5 | 1.5% |
| $100,000 to $149,999 | 124 | 36.8% |
| $150,000 to $199,999 | 34 | 10.1% |
| $200,000+ | 41 | 12.2% |
Family Income by Famaliy Size in Basin City
4-person families (174 | 51.6%) account for the highest median family income in Basin City with $104,350 per family, while 4-person families (174 | 51.6%) have the highest median income of $26,088 per family member.
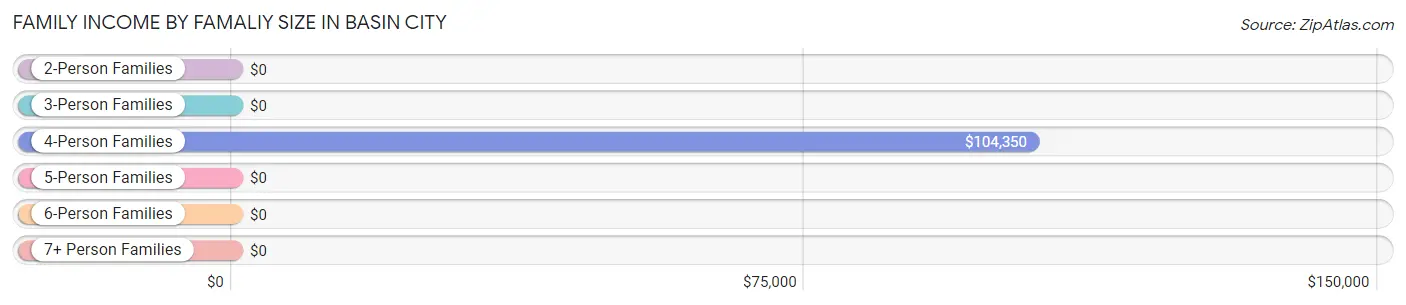
| Income Bracket | # Families | Median Income |
| 2-Person Families | 34 (10.1%) | $0 |
| 3-Person Families | 0 (0.0%) | $0 |
| 4-Person Families | 174 (51.6%) | $104,350 |
| 5-Person Families | 23 (6.8%) | $0 |
| 6-Person Families | 65 (19.3%) | $0 |
| 7+ Person Families | 41 (12.2%) | $0 |
| Total | 337 (100.0%) | $104,025 |
Family Income by Number of Earners in Basin City
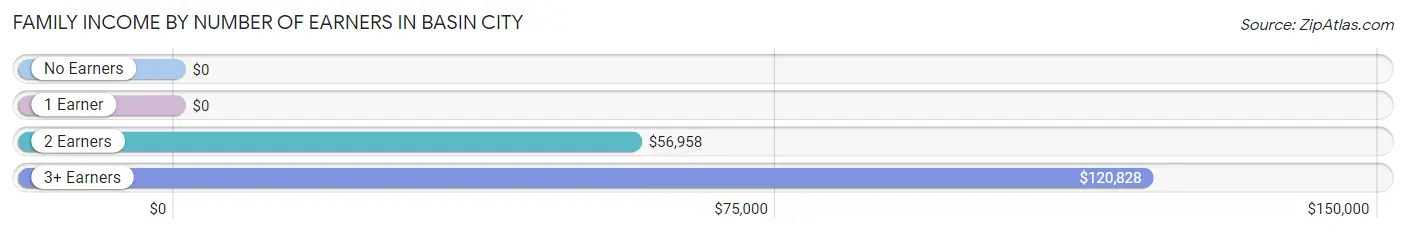
| Number of Earners | # Families | Median Income |
| No Earners | 0 (0.0%) | $0 |
| 1 Earner | 84 (24.9%) | $0 |
| 2 Earners | 94 (27.9%) | $56,958 |
| 3+ Earners | 159 (47.2%) | $120,828 |
| Total | 337 (100.0%) | $104,025 |
Household Income in Basin City
Household Income Brackets in Basin City
With 124 households falling in the category, the $100,000 to $149,999 income range is the most frequent in Basin City, accounting for 36.8% of all households.
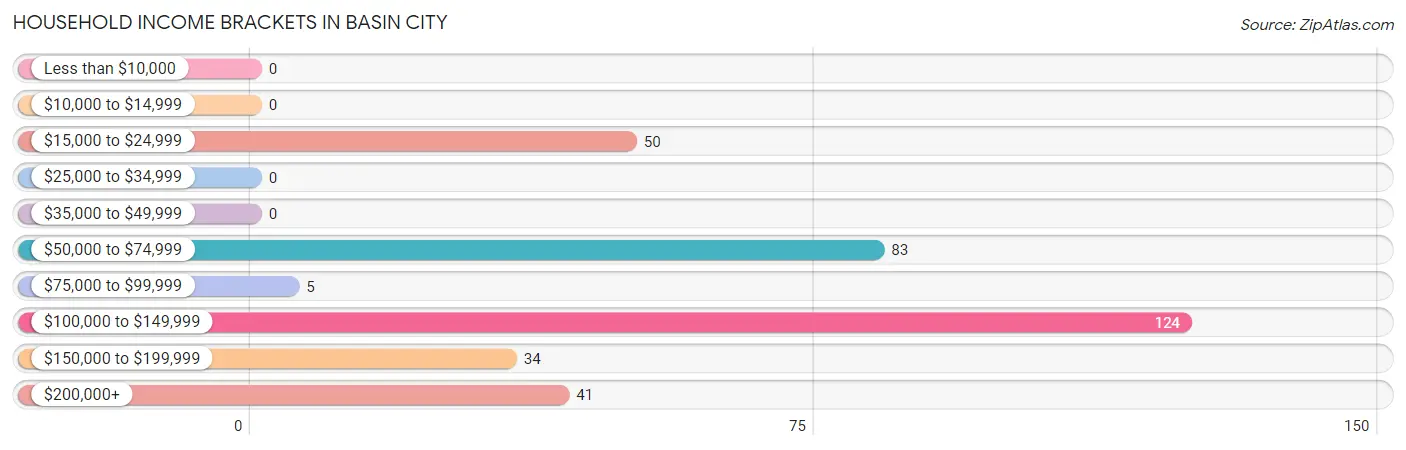
| Income Bracket | # Households | % Households |
| Less than $10,000 | 0 | 0.0% |
| $10,000 to $14,999 | 0 | 0.0% |
| $15,000 to $24,999 | 50 | 14.8% |
| $25,000 to $34,999 | 0 | 0.0% |
| $35,000 to $49,999 | 0 | 0.0% |
| $50,000 to $74,999 | 83 | 24.6% |
| $75,000 to $99,999 | 5 | 1.5% |
| $100,000 to $149,999 | 124 | 36.8% |
| $150,000 to $199,999 | 34 | 10.1% |
| $200,000+ | 41 | 12.2% |
Household Income by Householder Age in Basin City
The median household income in Basin City is $104,025, with the highest median household income of $120,152 found in the 45 to 64 years age bracket for the primary householder. A total of 139 households (41.2%) fall into this category. Meanwhile, the 15 to 24 years age bracket for the primary householder has the lowest median household income of $0, with 60 households (17.8%) in this group.
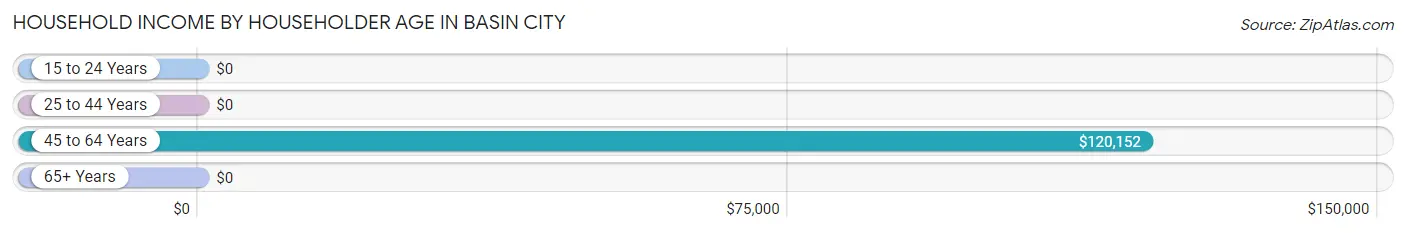
| Income Bracket | # Households | Median Income |
| 15 to 24 Years | 60 (17.8%) | $0 |
| 25 to 44 Years | 104 (30.9%) | $0 |
| 45 to 64 Years | 139 (41.2%) | $120,152 |
| 65+ Years | 34 (10.1%) | $0 |
| Total | 337 (100.0%) | $104,025 |
Poverty in Basin City
Income Below Poverty by Sex and Age in Basin City
With 10.3% poverty level for males and 15.0% for females among the residents of Basin City, 6 to 11 year old males and 6 to 11 year old females are the most vulnerable to poverty, with 16 males (69.6%) and 56 females (58.3%) in their respective age groups living below the poverty level.
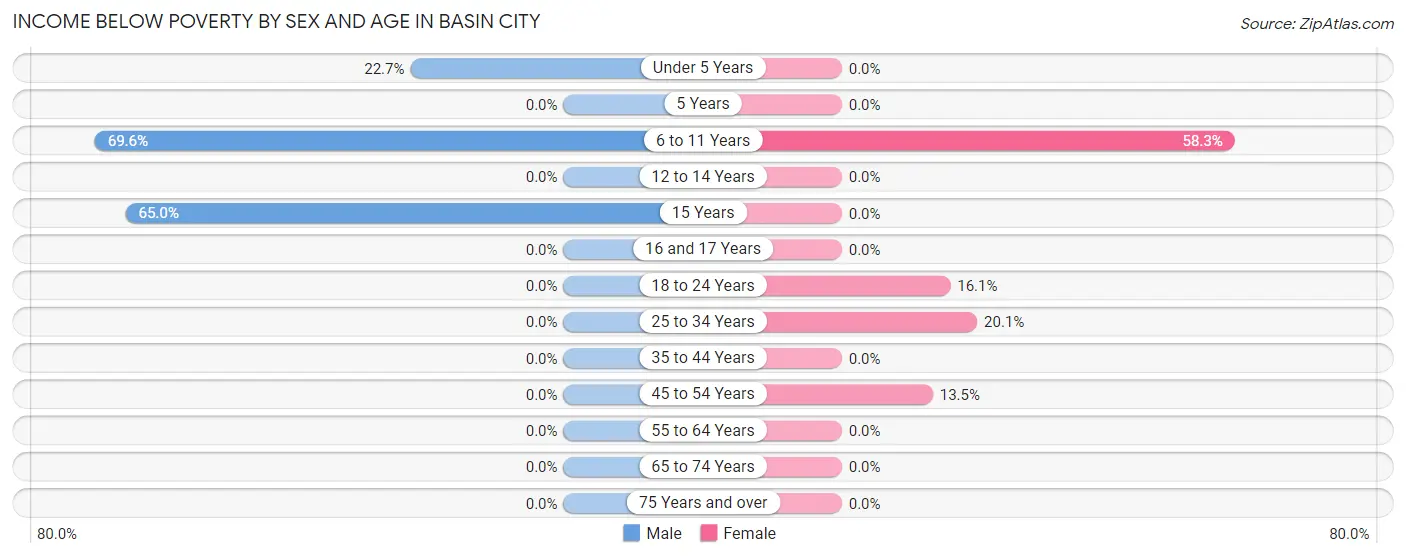
| Age Bracket | Male | Female |
| Under 5 Years | 40 (22.7%) | 0 (0.0%) |
| 5 Years | 0 (0.0%) | 0 (0.0%) |
| 6 to 11 Years | 16 (69.6%) | 56 (58.3%) |
| 12 to 14 Years | 0 (0.0%) | 0 (0.0%) |
| 15 Years | 13 (65.0%) | 0 (0.0%) |
| 16 and 17 Years | 0 (0.0%) | 0 (0.0%) |
| 18 to 24 Years | 0 (0.0%) | 29 (16.1%) |
| 25 to 34 Years | 0 (0.0%) | 40 (20.1%) |
| 35 to 44 Years | 0 (0.0%) | 0 (0.0%) |
| 45 to 54 Years | 0 (0.0%) | 10 (13.5%) |
| 55 to 64 Years | 0 (0.0%) | 0 (0.0%) |
| 65 to 74 Years | 0 (0.0%) | 0 (0.0%) |
| 75 Years and over | 0 (0.0%) | 0 (0.0%) |
| Total | 69 (10.3%) | 135 (15.0%) |
Income Above Poverty by Sex and Age in Basin City
According to the poverty statistics in Basin City, males aged 5 years and females aged under 5 years are the age groups that are most secure financially, with 100.0% of males and 100.0% of females in these age groups living above the poverty line.
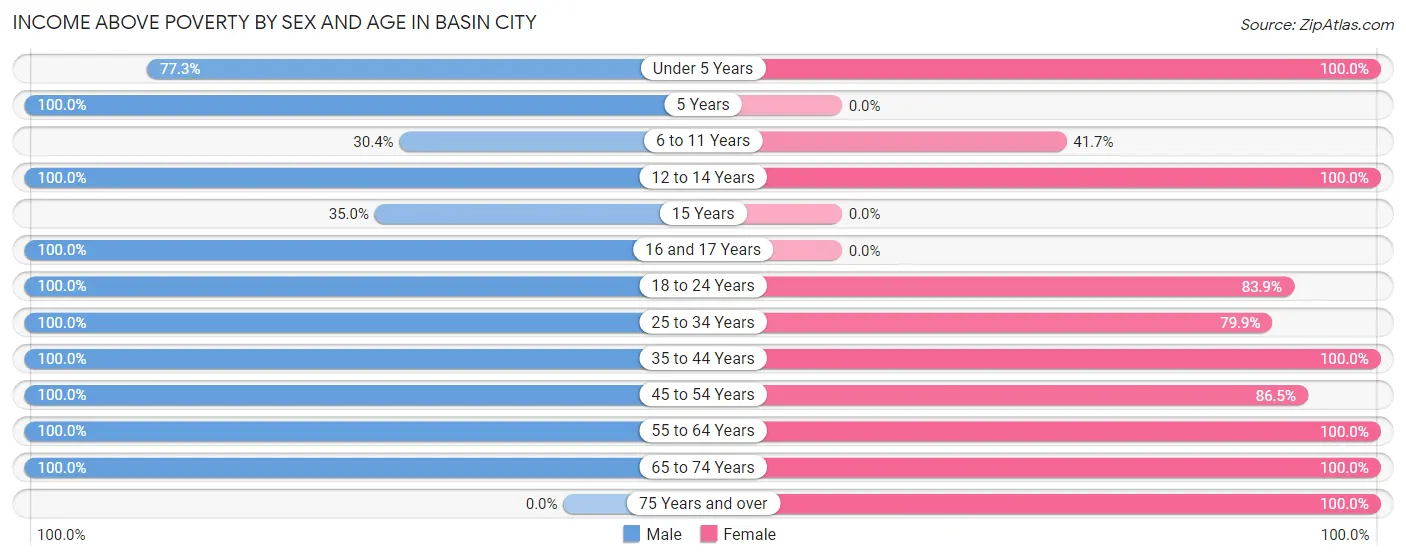
| Age Bracket | Male | Female |
| Under 5 Years | 136 (77.3%) | 161 (100.0%) |
| 5 Years | 30 (100.0%) | 0 (0.0%) |
| 6 to 11 Years | 7 (30.4%) | 40 (41.7%) |
| 12 to 14 Years | 9 (100.0%) | 25 (100.0%) |
| 15 Years | 7 (35.0%) | 0 (0.0%) |
| 16 and 17 Years | 7 (100.0%) | 0 (0.0%) |
| 18 to 24 Years | 119 (100.0%) | 151 (83.9%) |
| 25 to 34 Years | 67 (100.0%) | 159 (79.9%) |
| 35 to 44 Years | 41 (100.0%) | 59 (100.0%) |
| 45 to 54 Years | 158 (100.0%) | 64 (86.5%) |
| 55 to 64 Years | 5 (100.0%) | 39 (100.0%) |
| 65 to 74 Years | 16 (100.0%) | 34 (100.0%) |
| 75 Years and over | 0 (0.0%) | 32 (100.0%) |
| Total | 602 (89.7%) | 764 (85.0%) |
Income Below Poverty Among Married-Couple Families in Basin City
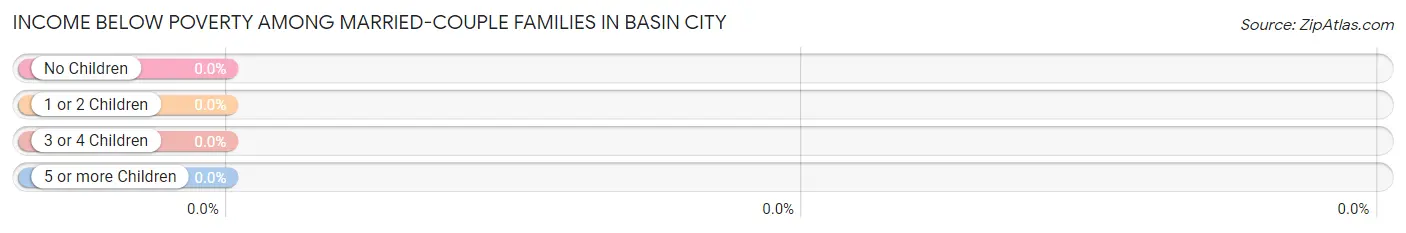
| Children | Above Poverty | Below Poverty |
| No Children | 158 (100.0%) | 0 (0.0%) |
| 1 or 2 Children | 5 (100.0%) | 0 (0.0%) |
| 3 or 4 Children | 90 (100.0%) | 0 (0.0%) |
| 5 or more Children | 11 (100.0%) | 0 (0.0%) |
| Total | 264 (100.0%) | 0 (0.0%) |
Income Below Poverty Among Single-Parent Households in Basin City
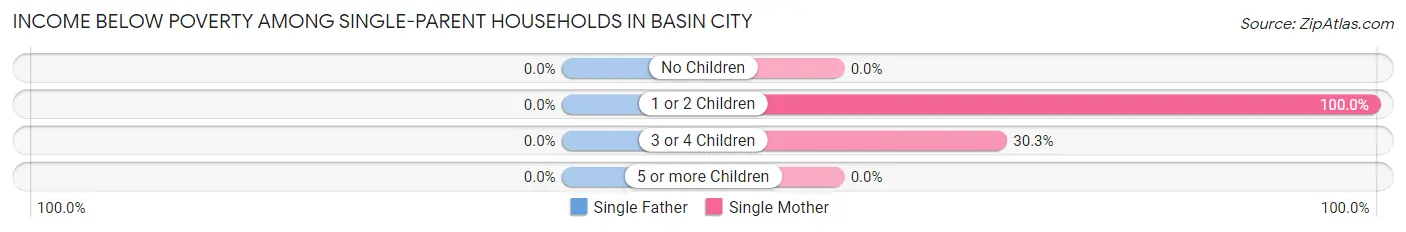
| Children | Single Father | Single Mother |
| No Children | 0 (0.0%) | 0 (0.0%) |
| 1 or 2 Children | 0 (0.0%) | 40 (100.0%) |
| 3 or 4 Children | 0 (0.0%) | 10 (30.3%) |
| 5 or more Children | 0 (0.0%) | 0 (0.0%) |
| Total | 0 (0.0%) | 50 (68.5%) |
Income Below Poverty Among Married-Couple vs Single-Parent Households in Basin City
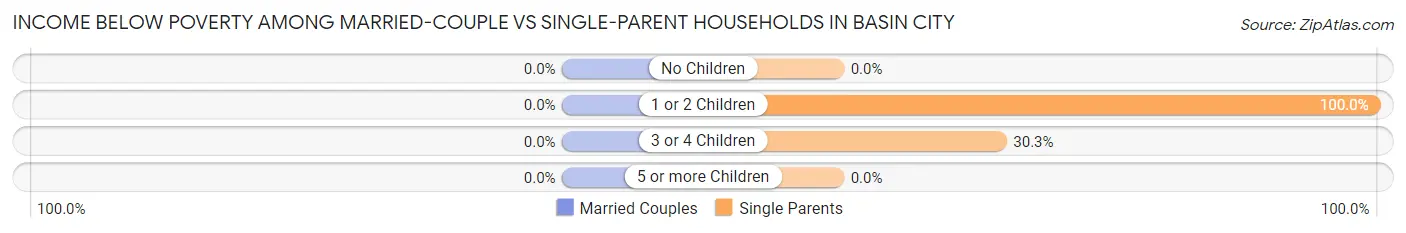
| Children | Married-Couple Families | Single-Parent Households |
| No Children | 0 (0.0%) | 0 (0.0%) |
| 1 or 2 Children | 0 (0.0%) | 40 (100.0%) |
| 3 or 4 Children | 0 (0.0%) | 10 (30.3%) |
| 5 or more Children | 0 (0.0%) | 0 (0.0%) |
| Total | 0 (0.0%) | 50 (68.5%) |
Race in Basin City
The most populous races in Basin City are Hispanic or Latino (1,460 | 93.0%), White / Caucasian (961 | 61.2%), and Some other Race (554 | 35.3%).
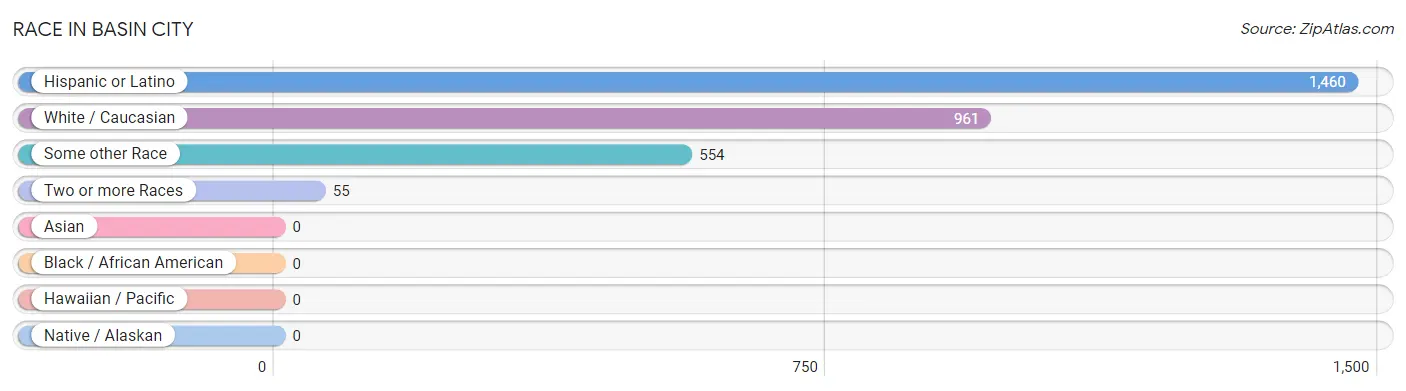
| Race | # Population | % Population |
| Asian | 0 | 0.0% |
| Black / African American | 0 | 0.0% |
| Hawaiian / Pacific | 0 | 0.0% |
| Hispanic or Latino | 1,460 | 93.0% |
| Native / Alaskan | 0 | 0.0% |
| White / Caucasian | 961 | 61.2% |
| Two or more Races | 55 | 3.5% |
| Some other Race | 554 | 35.3% |
| Total | 1,570 | 100.0% |
Ancestry in Basin City
The most populous ancestries reported in Basin City are Mexican (1,460 | 93.0%), English (82 | 5.2%), German (34 | 2.2%), and French (9 | 0.6%), together accounting for 101.0% of all Basin City residents.
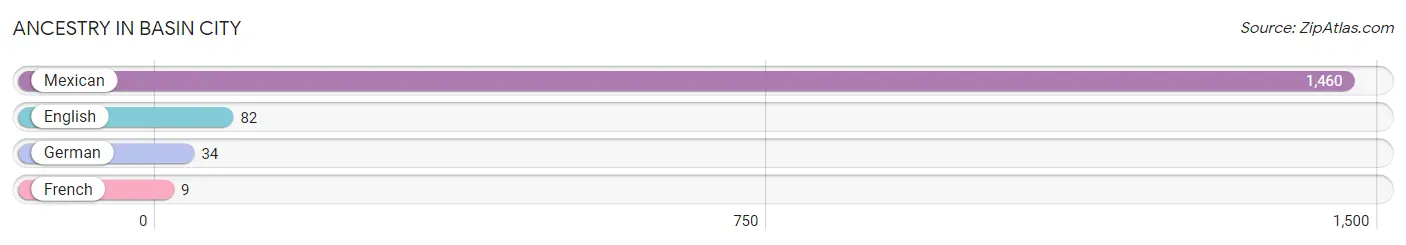
| Ancestry | # Population | % Population |
| English | 82 | 5.2% |
| French | 9 | 0.6% |
| German | 34 | 2.2% |
| Mexican | 1,460 | 93.0% | View All 4 Rows |
Immigrants in Basin City
The most numerous immigrant groups reported in Basin City came from Central America (988 | 62.9%), Latin America (988 | 62.9%), and Mexico (988 | 62.9%), together accounting for 188.8% of all Basin City residents.
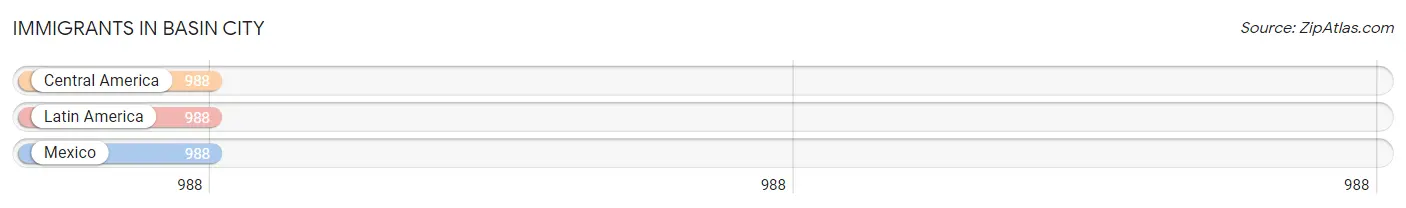
| Immigration Origin | # Population | % Population |
| Central America | 988 | 62.9% |
| Latin America | 988 | 62.9% |
| Mexico | 988 | 62.9% | View All 3 Rows |
Sex and Age in Basin City
Sex and Age in Basin City
The most populous age groups in Basin City are Under 5 Years (176 | 26.2%) for men and Under 5 Years (161 | 17.9%) for women.
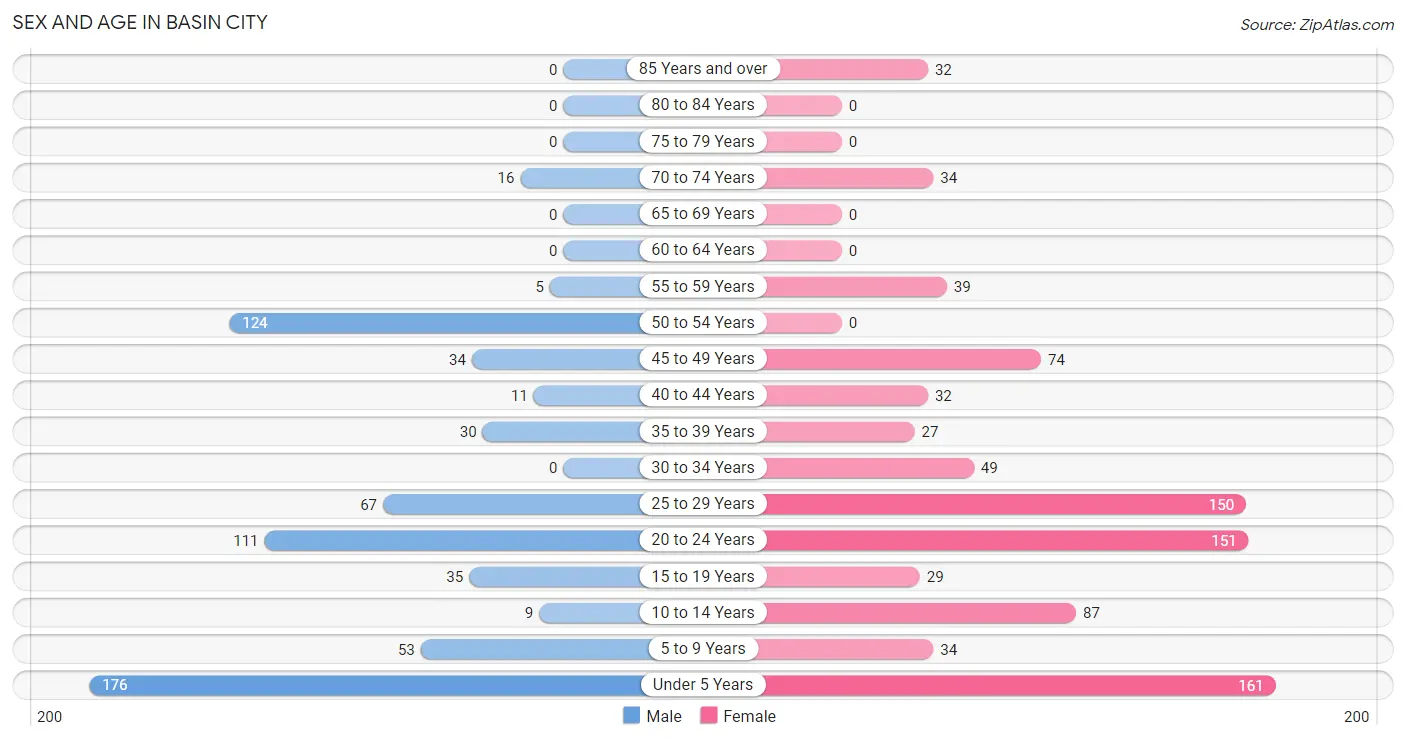
| Age Bracket | Male | Female |
| Under 5 Years | 176 (26.2%) | 161 (17.9%) |
| 5 to 9 Years | 53 (7.9%) | 34 (3.8%) |
| 10 to 14 Years | 9 (1.3%) | 87 (9.7%) |
| 15 to 19 Years | 35 (5.2%) | 29 (3.2%) |
| 20 to 24 Years | 111 (16.5%) | 151 (16.8%) |
| 25 to 29 Years | 67 (10.0%) | 150 (16.7%) |
| 30 to 34 Years | 0 (0.0%) | 49 (5.4%) |
| 35 to 39 Years | 30 (4.5%) | 27 (3.0%) |
| 40 to 44 Years | 11 (1.6%) | 32 (3.6%) |
| 45 to 49 Years | 34 (5.1%) | 74 (8.2%) |
| 50 to 54 Years | 124 (18.5%) | 0 (0.0%) |
| 55 to 59 Years | 5 (0.7%) | 39 (4.3%) |
| 60 to 64 Years | 0 (0.0%) | 0 (0.0%) |
| 65 to 69 Years | 0 (0.0%) | 0 (0.0%) |
| 70 to 74 Years | 16 (2.4%) | 34 (3.8%) |
| 75 to 79 Years | 0 (0.0%) | 0 (0.0%) |
| 80 to 84 Years | 0 (0.0%) | 0 (0.0%) |
| 85 Years and over | 0 (0.0%) | 32 (3.6%) |
| Total | 671 (100.0%) | 899 (100.0%) |
Families and Households in Basin City
Median Family Size in Basin City
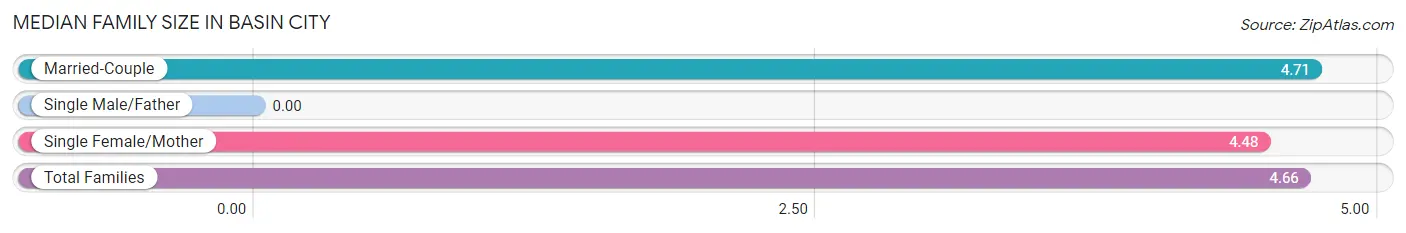
| Family Type | # Families | Family Size |
| Married-Couple | 264 (78.3%) | 4.71 |
| Single Male/Father | 0 (0.0%) | - |
| Single Female/Mother | 73 (21.7%) | 4.48 |
| Total Families | 337 (100.0%) | 4.66 |
Median Household Size in Basin City
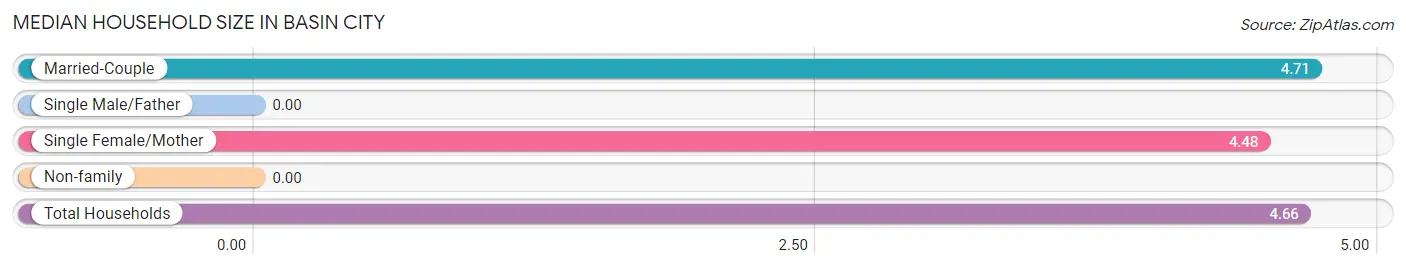
| Household Type | # Households | Household Size |
| Married-Couple | 264 (78.3%) | 4.71 |
| Single Male/Father | 0 (0.0%) | - |
| Single Female/Mother | 73 (21.7%) | 4.48 |
| Non-family | 0 (0.0%) | - |
| Total Households | 337 (100.0%) | 4.66 |
Household Size by Marriage Status in Basin City
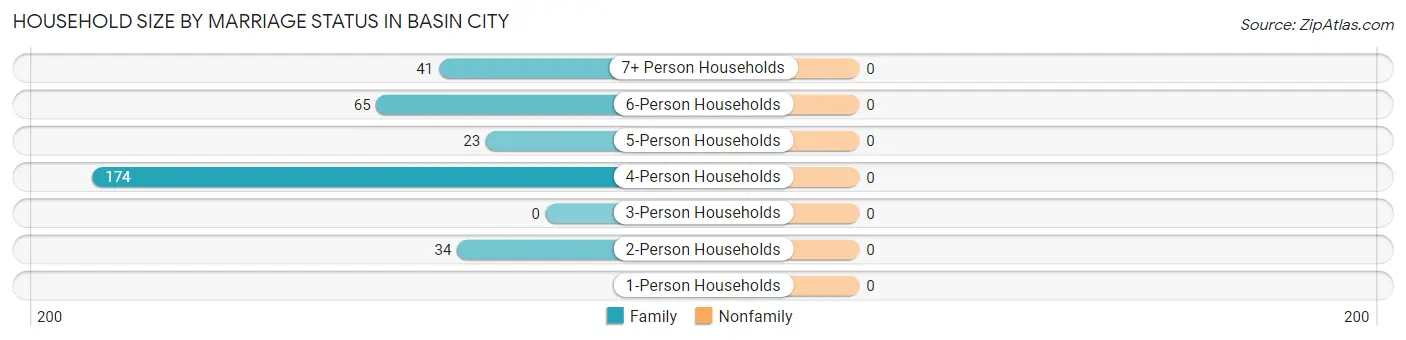
| Household Size | Family Households | Nonfamily Households |
| 1-Person Households | - | 0 (0.0%) |
| 2-Person Households | 34 (10.1%) | 0 (0.0%) |
| 3-Person Households | 0 (0.0%) | 0 (0.0%) |
| 4-Person Households | 174 (51.6%) | 0 (0.0%) |
| 5-Person Households | 23 (6.8%) | 0 (0.0%) |
| 6-Person Households | 65 (19.3%) | 0 (0.0%) |
| 7+ Person Households | 41 (12.2%) | 0 (0.0%) |
| Total | 337 (100.0%) | 0 (0.0%) |
Female Fertility in Basin City
Fertility by Age in Basin City
| Age Bracket | Women with Births | Births / 1,000 Women |
| 15 to 19 years | 0 (0.0%) | 0.0 |
| 20 to 34 years | 0 (0.0%) | 0.0 |
| 35 to 50 years | 0 (0.0%) | 0.0 |
| Total | 0 (0.0%) | 0.0 |
Fertility by Age by Marriage Status in Basin City
| Age Bracket | Married | Unmarried |
| 15 to 19 years | 0 (0.0%) | 0 (0.0%) |
| 20 to 34 years | 0 (0.0%) | 0 (0.0%) |
| 35 to 50 years | 0 (0.0%) | 0 (0.0%) |
| Total | 0 (0.0%) | 0 (0.0%) |
Fertility by Education in Basin City
| Educational Attainment | Women with Births | Births / 1,000 Women |
| Less than High School | 0 (0.0%) | 0.0 |
| High School Diploma | 0 (0.0%) | 0.0 |
| College or Associate's Degree | 0 (0.0%) | 0.0 |
| Bachelor's Degree | 0 (0.0%) | 0.0 |
| Graduate Degree | 0 (0.0%) | 0.0 |
| Total | 0 (0.0%) | 0.0 |
Fertility by Education by Marriage Status in Basin City
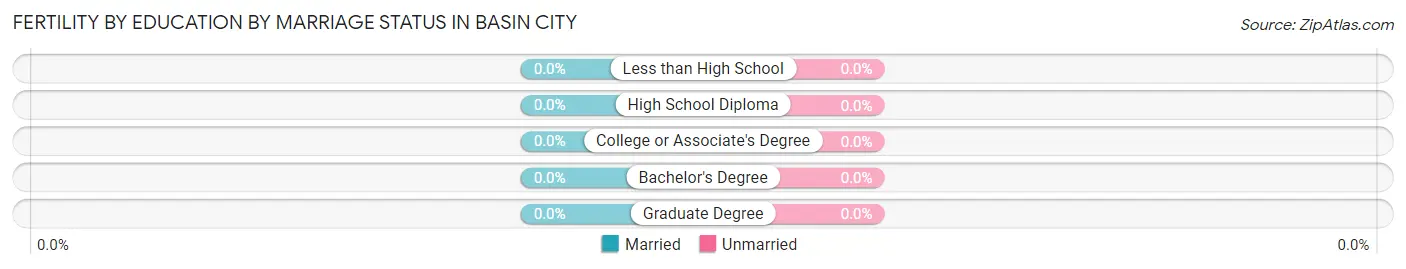
| Educational Attainment | Married | Unmarried |
| Less than High School | 0 (0.0%) | 0 (0.0%) |
| High School Diploma | 0 (0.0%) | 0 (0.0%) |
| College or Associate's Degree | 0 (0.0%) | 0 (0.0%) |
| Bachelor's Degree | 0 (0.0%) | 0 (0.0%) |
| Graduate Degree | 0 (0.0%) | 0 (0.0%) |
| Total | 0 (0.0%) | 0 (0.0%) |
Employment Characteristics in Basin City
Employment by Class of Employer in Basin City
Among the 640 employed individuals in Basin City, private company employees (510 | 79.7%), not-for-profit organizations (95 | 14.8%), and federal government employees (35 | 5.5%) make up the most common classes of employment.
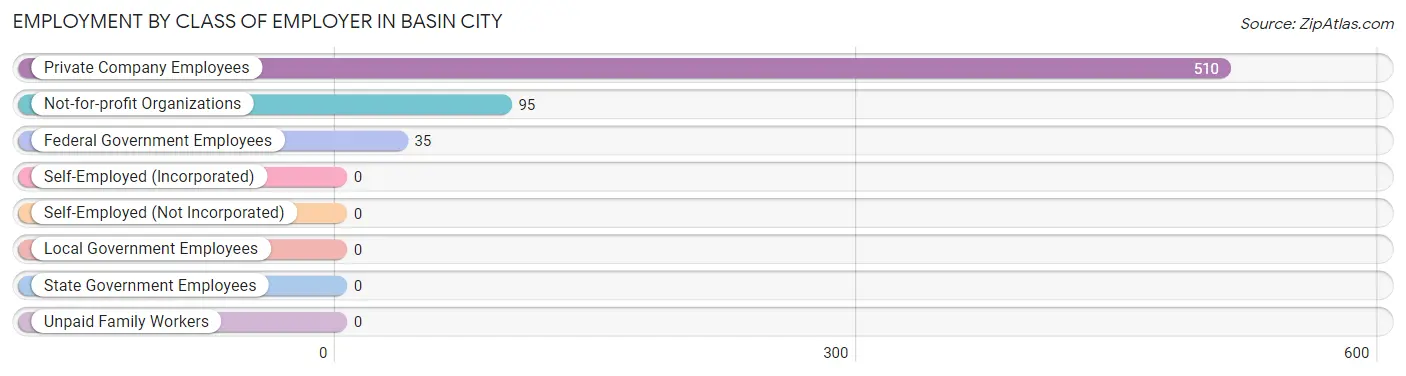
| Employer Class | # Employees | % Employees |
| Private Company Employees | 510 | 79.7% |
| Self-Employed (Incorporated) | 0 | 0.0% |
| Self-Employed (Not Incorporated) | 0 | 0.0% |
| Not-for-profit Organizations | 95 | 14.8% |
| Local Government Employees | 0 | 0.0% |
| State Government Employees | 0 | 0.0% |
| Federal Government Employees | 35 | 5.5% |
| Unpaid Family Workers | 0 | 0.0% |
| Total | 640 | 100.0% |
Employment Status by Age in Basin City
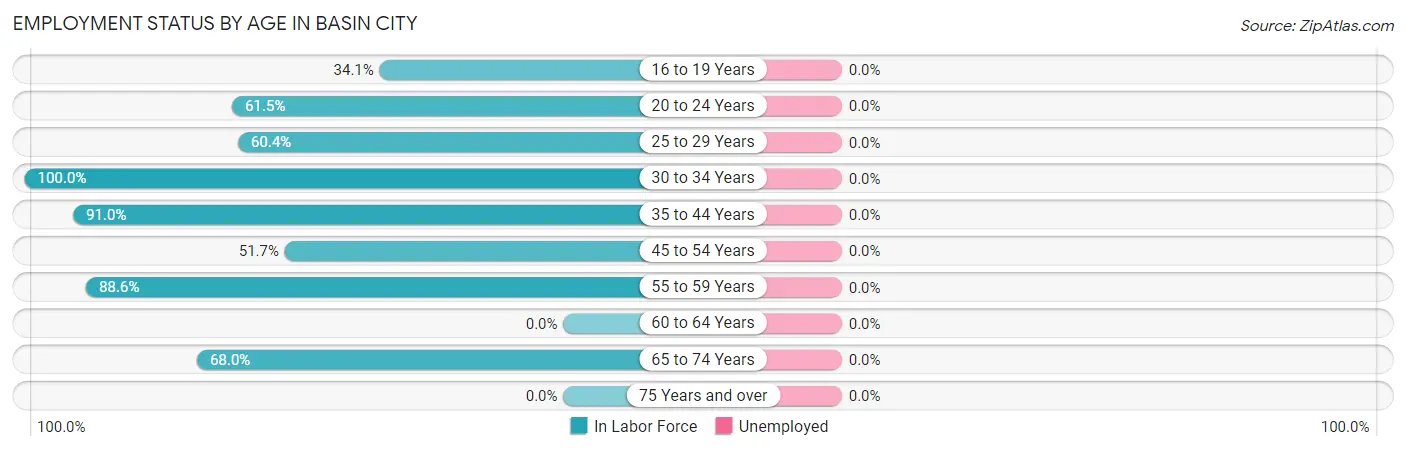
| Age Bracket | In Labor Force | Unemployed |
| 16 to 19 Years | 15 (34.1%) | 0 (0.0%) |
| 20 to 24 Years | 161 (61.5%) | 0 (0.0%) |
| 25 to 29 Years | 131 (60.4%) | 0 (0.0%) |
| 30 to 34 Years | 49 (100.0%) | 0 (0.0%) |
| 35 to 44 Years | 91 (91.0%) | 0 (0.0%) |
| 45 to 54 Years | 120 (51.7%) | 0 (0.0%) |
| 55 to 59 Years | 39 (88.6%) | 0 (0.0%) |
| 60 to 64 Years | 0 (0.0%) | 0 (0.0%) |
| 65 to 74 Years | 34 (68.0%) | 0 (0.0%) |
| 75 Years and over | 0 (0.0%) | 0 (0.0%) |
| Total | 640 (62.1%) | 0 (0.0%) |
Employment Status by Educational Attainment in Basin City
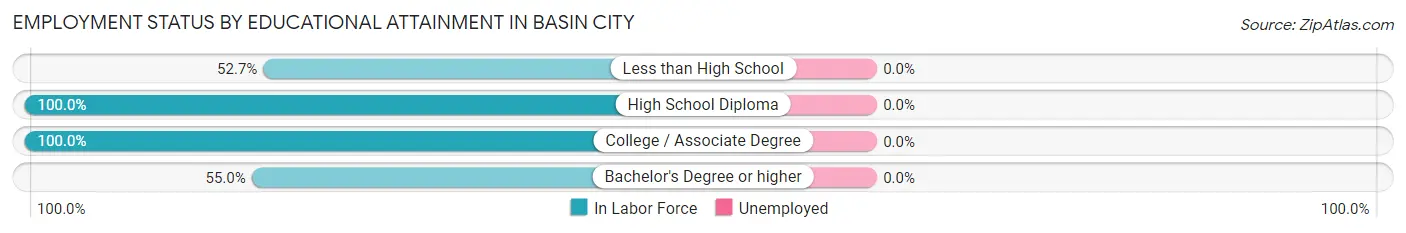
| Educational Attainment | In Labor Force | Unemployed |
| Less than High School | 226 (52.7%) | 0 (0.0%) |
| High School Diploma | 102 (100.0%) | 0 (0.0%) |
| College / Associate Degree | 91 (100.0%) | 0 (0.0%) |
| Bachelor's Degree or higher | 11 (55.0%) | 0 (0.0%) |
| Total | 430 (67.0%) | 0 (0.0%) |
Employment Occupations by Sex in Basin City
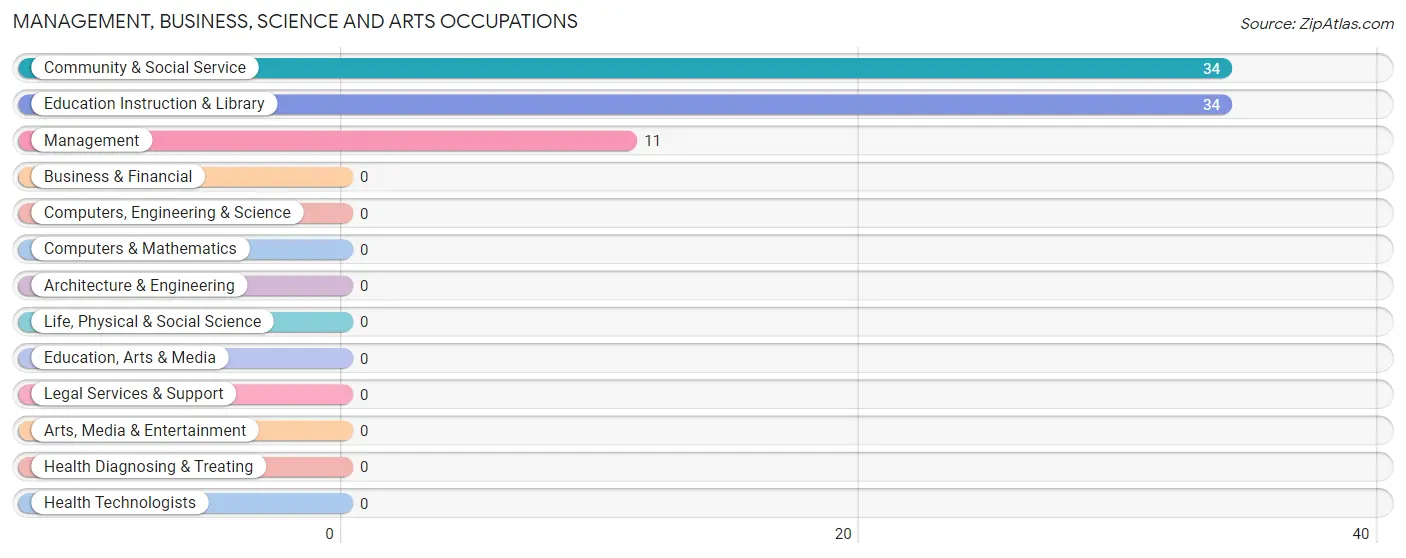
Management, Business, Science and Arts Occupations
The most common Management, Business, Science and Arts occupations in Basin City are Community & Social Service (34 | 5.3%), Education Instruction & Library (34 | 5.3%), and Management (11 | 1.7%).
Management, Business, Science and Arts Occupations by Sex
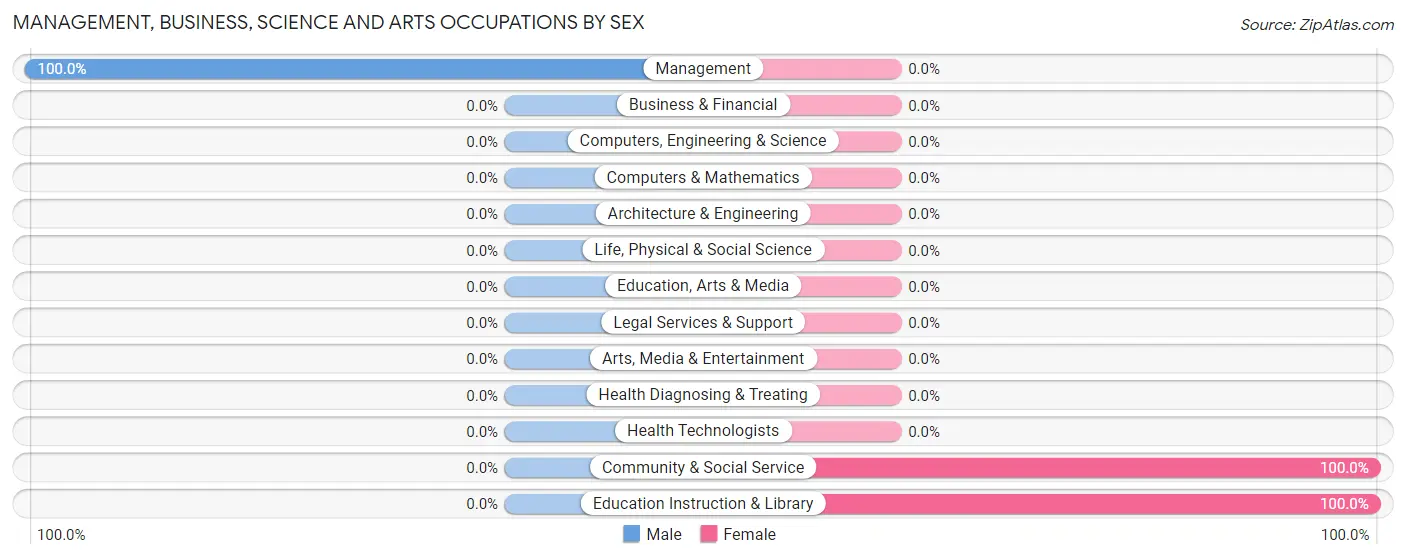
| Occupation | Male | Female |
| Management | 11 (100.0%) | 0 (0.0%) |
| Business & Financial | 0 (0.0%) | 0 (0.0%) |
| Computers, Engineering & Science | 0 (0.0%) | 0 (0.0%) |
| Computers & Mathematics | 0 (0.0%) | 0 (0.0%) |
| Architecture & Engineering | 0 (0.0%) | 0 (0.0%) |
| Life, Physical & Social Science | 0 (0.0%) | 0 (0.0%) |
| Community & Social Service | 0 (0.0%) | 34 (100.0%) |
| Education, Arts & Media | 0 (0.0%) | 0 (0.0%) |
| Legal Services & Support | 0 (0.0%) | 0 (0.0%) |
| Education Instruction & Library | 0 (0.0%) | 34 (100.0%) |
| Arts, Media & Entertainment | 0 (0.0%) | 0 (0.0%) |
| Health Diagnosing & Treating | 0 (0.0%) | 0 (0.0%) |
| Health Technologists | 0 (0.0%) | 0 (0.0%) |
| Total (Category) | 11 (24.4%) | 34 (75.6%) |
| Total (Overall) | 318 (49.7%) | 322 (50.3%) |
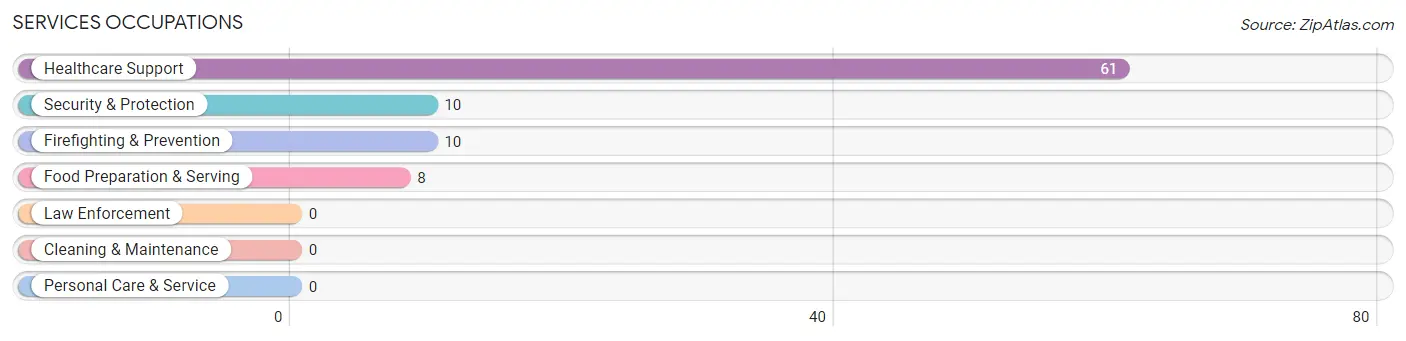
Services Occupations
The most common Services occupations in Basin City are Healthcare Support (61 | 9.5%), Security & Protection (10 | 1.6%), Firefighting & Prevention (10 | 1.6%), and Food Preparation & Serving (8 | 1.3%).
Services Occupations by Sex
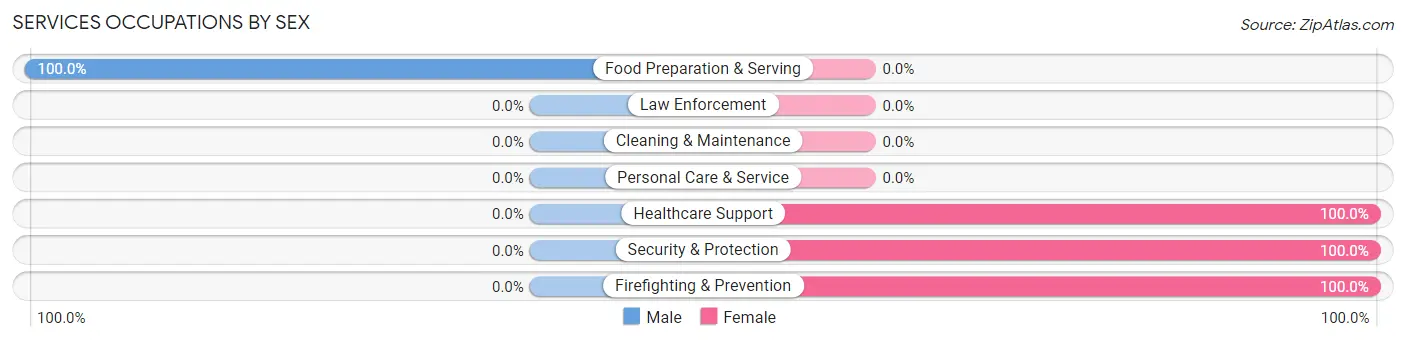
| Occupation | Male | Female |
| Healthcare Support | 0 (0.0%) | 61 (100.0%) |
| Security & Protection | 0 (0.0%) | 10 (100.0%) |
| Firefighting & Prevention | 0 (0.0%) | 10 (100.0%) |
| Law Enforcement | 0 (0.0%) | 0 (0.0%) |
| Food Preparation & Serving | 8 (100.0%) | 0 (0.0%) |
| Cleaning & Maintenance | 0 (0.0%) | 0 (0.0%) |
| Personal Care & Service | 0 (0.0%) | 0 (0.0%) |
| Total (Category) | 8 (10.1%) | 71 (89.9%) |
| Total (Overall) | 318 (49.7%) | 322 (50.3%) |
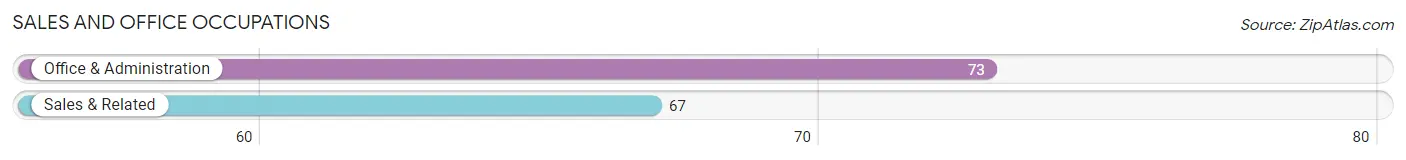
Sales and Office Occupations
The most common Sales and Office occupations in Basin City are Office & Administration (73 | 11.4%), and Sales & Related (67 | 10.5%).
Sales and Office Occupations by Sex
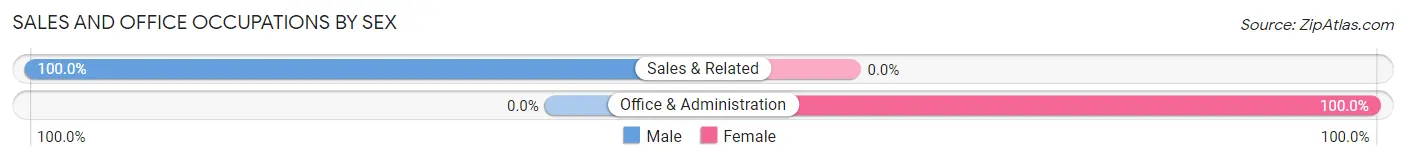
| Occupation | Male | Female |
| Sales & Related | 67 (100.0%) | 0 (0.0%) |
| Office & Administration | 0 (0.0%) | 73 (100.0%) |
| Total (Category) | 67 (47.9%) | 73 (52.1%) |
| Total (Overall) | 318 (49.7%) | 322 (50.3%) |
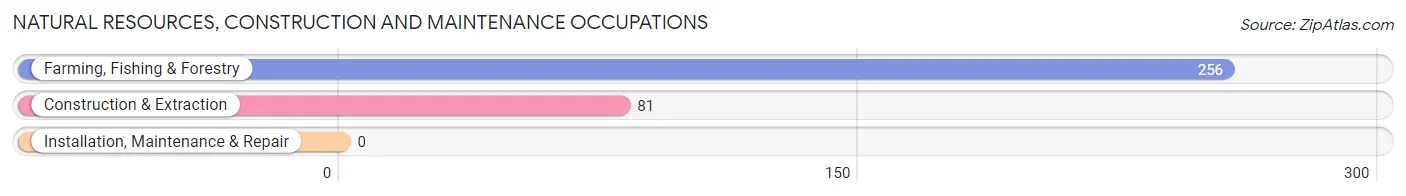
Natural Resources, Construction and Maintenance Occupations
The most common Natural Resources, Construction and Maintenance occupations in Basin City are Farming, Fishing & Forestry (256 | 40.0%), and Construction & Extraction (81 | 12.7%).
Natural Resources, Construction and Maintenance Occupations by Sex
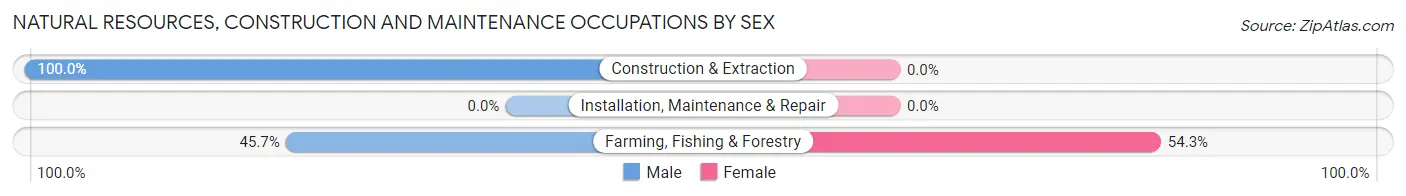
| Occupation | Male | Female |
| Farming, Fishing & Forestry | 117 (45.7%) | 139 (54.3%) |
| Construction & Extraction | 81 (100.0%) | 0 (0.0%) |
| Installation, Maintenance & Repair | 0 (0.0%) | 0 (0.0%) |
| Total (Category) | 198 (58.8%) | 139 (41.2%) |
| Total (Overall) | 318 (49.7%) | 322 (50.3%) |
Production, Transportation and Moving Occupations
The most common Production, Transportation and Moving occupations in Basin City are Production (34 | 5.3%), and Material Moving (5 | 0.8%).
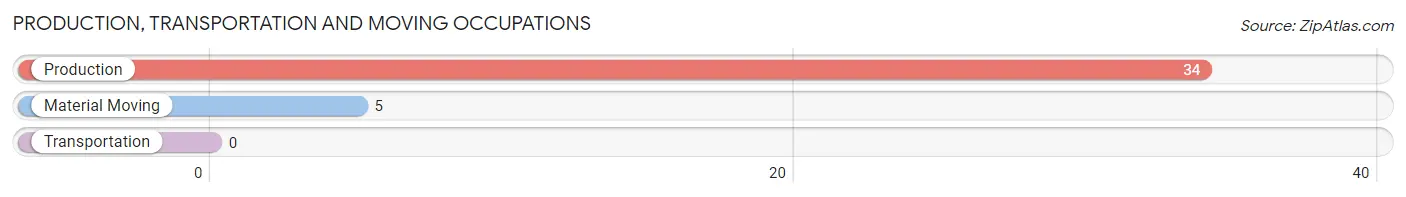
Production, Transportation and Moving Occupations by Sex
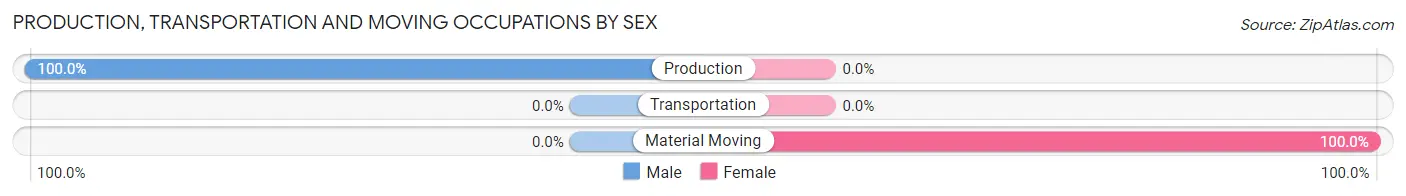
| Occupation | Male | Female |
| Production | 34 (100.0%) | 0 (0.0%) |
| Transportation | 0 (0.0%) | 0 (0.0%) |
| Material Moving | 0 (0.0%) | 5 (100.0%) |
| Total (Category) | 34 (87.2%) | 5 (12.8%) |
| Total (Overall) | 318 (49.7%) | 322 (50.3%) |
Employment Industries by Sex in Basin City
Employment Industries in Basin City
The major employment industries in Basin City include Agriculture, Fishing & Hunting (261 | 40.8%), Construction (81 | 12.7%), Educational Services (74 | 11.6%), Health Care & Social Assistance (71 | 11.1%), and Retail Trade (67 | 10.5%).
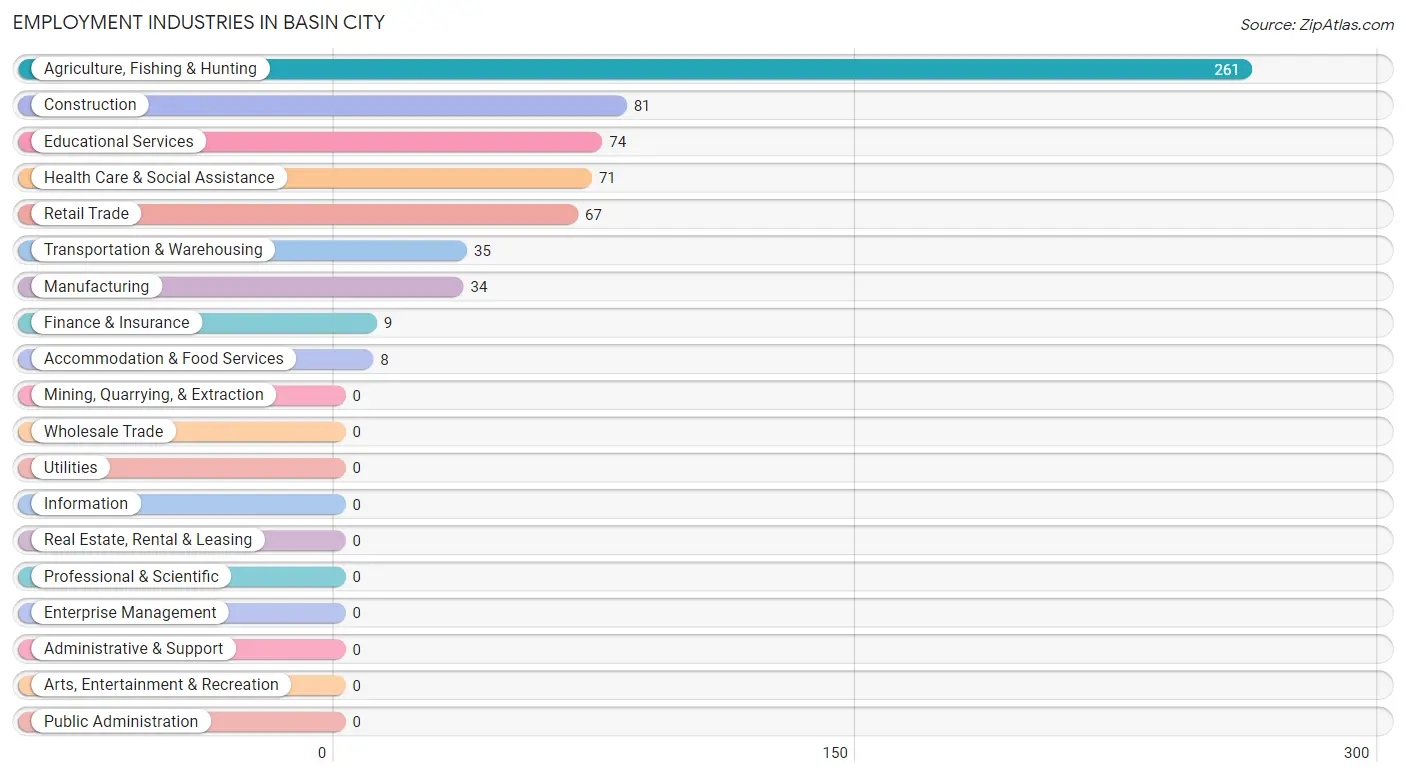
Employment Industries by Sex in Basin City
The Basin City industries that see more men than women are Construction (100.0%), Manufacturing (100.0%), and Retail Trade (100.0%), whereas the industries that tend to have a higher number of women are Transportation & Warehousing (100.0%), Finance & Insurance (100.0%), and Health Care & Social Assistance (100.0%).
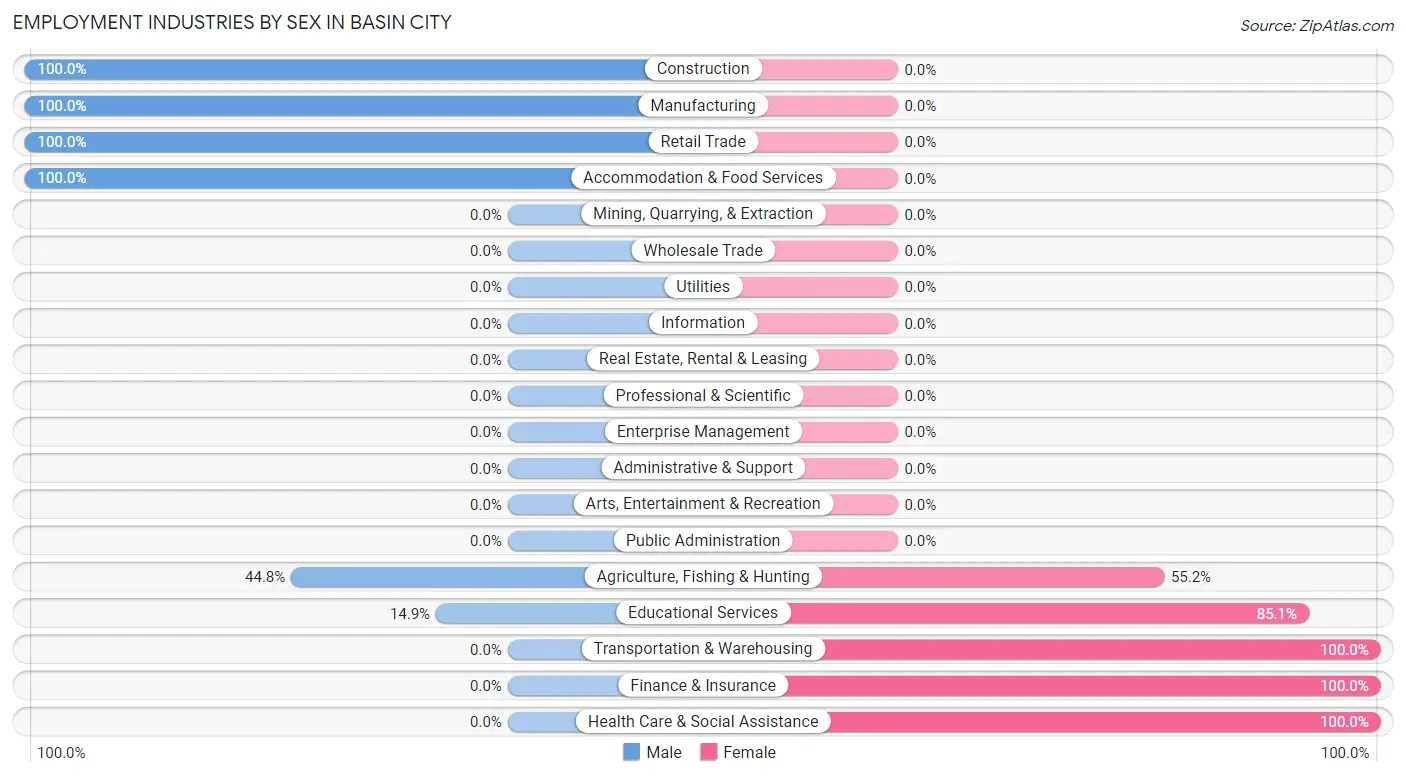
| Industry | Male | Female |
| Agriculture, Fishing & Hunting | 117 (44.8%) | 144 (55.2%) |
| Mining, Quarrying, & Extraction | 0 (0.0%) | 0 (0.0%) |
| Construction | 81 (100.0%) | 0 (0.0%) |
| Manufacturing | 34 (100.0%) | 0 (0.0%) |
| Wholesale Trade | 0 (0.0%) | 0 (0.0%) |
| Retail Trade | 67 (100.0%) | 0 (0.0%) |
| Transportation & Warehousing | 0 (0.0%) | 35 (100.0%) |
| Utilities | 0 (0.0%) | 0 (0.0%) |
| Information | 0 (0.0%) | 0 (0.0%) |
| Finance & Insurance | 0 (0.0%) | 9 (100.0%) |
| Real Estate, Rental & Leasing | 0 (0.0%) | 0 (0.0%) |
| Professional & Scientific | 0 (0.0%) | 0 (0.0%) |
| Enterprise Management | 0 (0.0%) | 0 (0.0%) |
| Administrative & Support | 0 (0.0%) | 0 (0.0%) |
| Educational Services | 11 (14.9%) | 63 (85.1%) |
| Health Care & Social Assistance | 0 (0.0%) | 71 (100.0%) |
| Arts, Entertainment & Recreation | 0 (0.0%) | 0 (0.0%) |
| Accommodation & Food Services | 8 (100.0%) | 0 (0.0%) |
| Public Administration | 0 (0.0%) | 0 (0.0%) |
| Total | 318 (49.7%) | 322 (50.3%) |
Education in Basin City
School Enrollment in Basin City
The most common levels of schooling among the 479 students in Basin City are college / undergraduate (167 | 34.9%), nursery / preschool (132 | 27.6%), and middle school (96 | 20.0%).
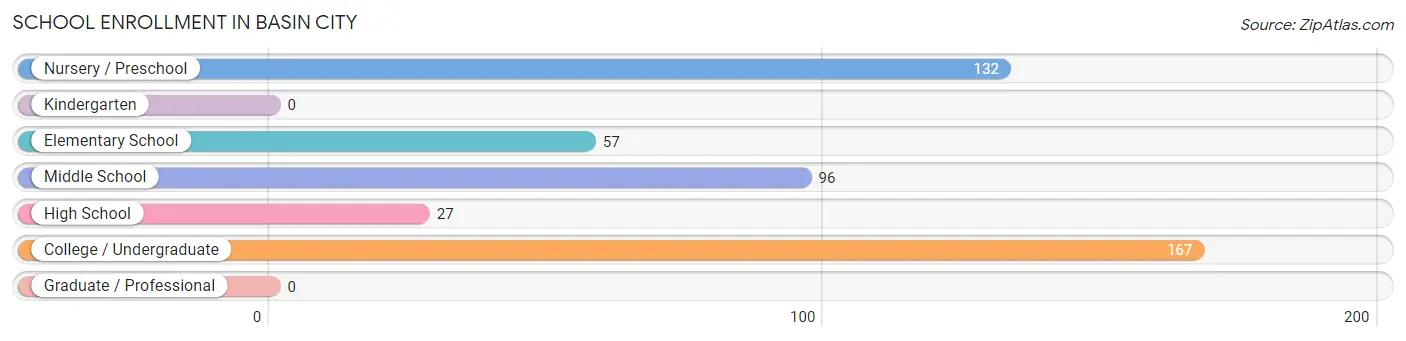
| School Level | # Students | % Students |
| Nursery / Preschool | 132 | 27.6% |
| Kindergarten | 0 | 0.0% |
| Elementary School | 57 | 11.9% |
| Middle School | 96 | 20.0% |
| High School | 27 | 5.6% |
| College / Undergraduate | 167 | 34.9% |
| Graduate / Professional | 0 | 0.0% |
| Total | 479 | 100.0% |
School Enrollment by Age by Funding Source in Basin City
Out of a total of 479 students who are enrolled in schools in Basin City, 9 (1.9%) attend a private institution, while the remaining 470 (98.1%) are enrolled in public schools. The age group of 5 to 9 year old has the highest likelihood of being enrolled in private schools, with 9 (15.8% in the age bracket) enrolled. Conversely, the age group of 3 to 4 year olds has the lowest likelihood of being enrolled in a private school, with 132 (100.0% in the age bracket) attending a public institution.
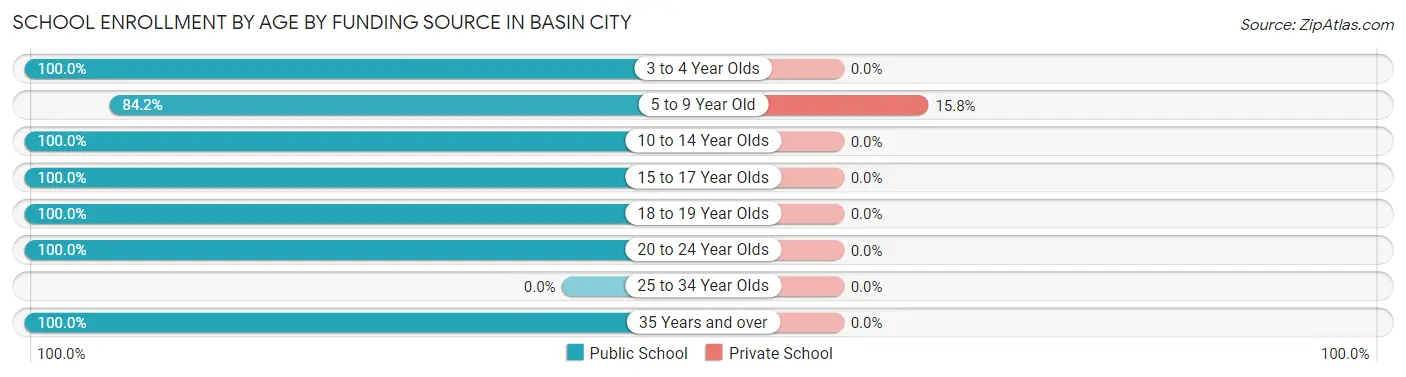
| Age Bracket | Public School | Private School |
| 3 to 4 Year Olds | 132 (100.0%) | 0 (0.0%) |
| 5 to 9 Year Old | 48 (84.2%) | 9 (15.8%) |
| 10 to 14 Year Olds | 96 (100.0%) | 0 (0.0%) |
| 15 to 17 Year Olds | 27 (100.0%) | 0 (0.0%) |
| 18 to 19 Year Olds | 29 (100.0%) | 0 (0.0%) |
| 20 to 24 Year Olds | 111 (100.0%) | 0 (0.0%) |
| 25 to 34 Year Olds | 0 (0.0%) | 0 (0.0%) |
| 35 Years and over | 27 (100.0%) | 0 (0.0%) |
| Total | 470 (98.1%) | 9 (1.9%) |
Educational Attainment by Field of Study in Basin City
Education (50 | 71.4%), business (11 | 15.7%), and science & technology (9 | 12.9%) are the most common fields of study among 70 individuals in Basin City who have obtained a bachelor's degree or higher.
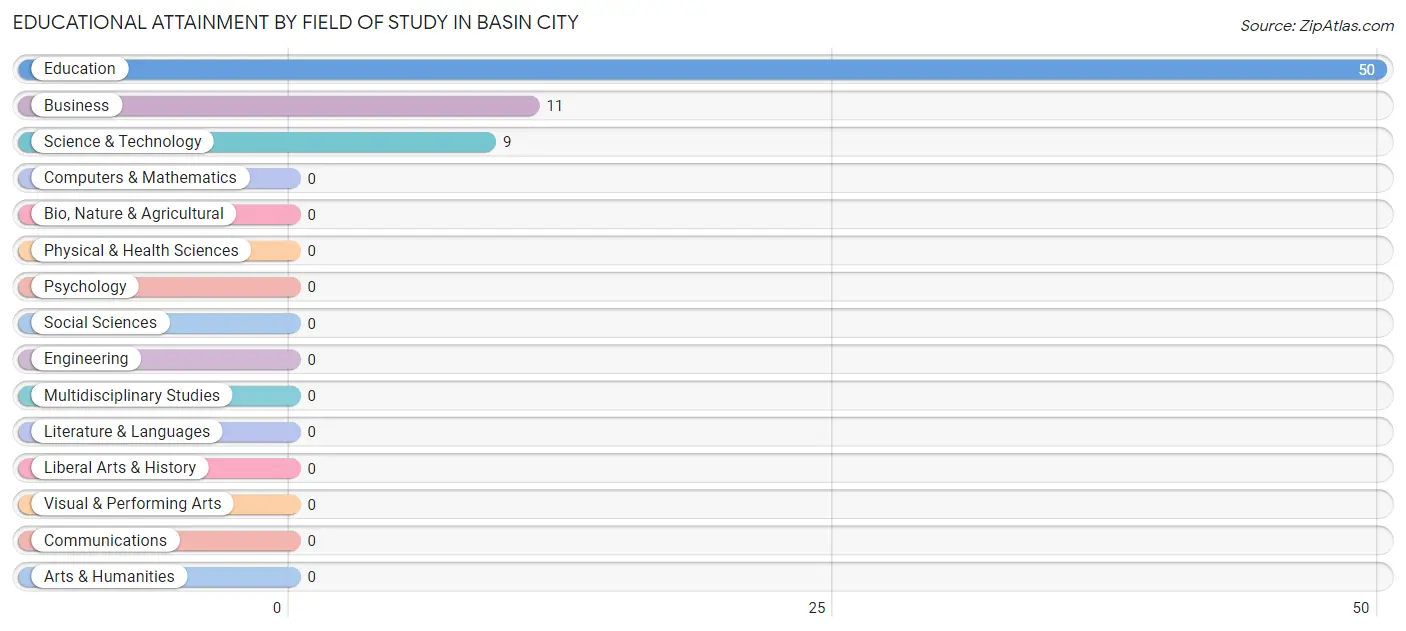
| Field of Study | # Graduates | % Graduates |
| Computers & Mathematics | 0 | 0.0% |
| Bio, Nature & Agricultural | 0 | 0.0% |
| Physical & Health Sciences | 0 | 0.0% |
| Psychology | 0 | 0.0% |
| Social Sciences | 0 | 0.0% |
| Engineering | 0 | 0.0% |
| Multidisciplinary Studies | 0 | 0.0% |
| Science & Technology | 9 | 12.9% |
| Business | 11 | 15.7% |
| Education | 50 | 71.4% |
| Literature & Languages | 0 | 0.0% |
| Liberal Arts & History | 0 | 0.0% |
| Visual & Performing Arts | 0 | 0.0% |
| Communications | 0 | 0.0% |
| Arts & Humanities | 0 | 0.0% |
| Total | 70 | 100.0% |
Transportation & Commute in Basin City
Vehicle Availability by Sex in Basin City
The most prevalent vehicle ownership categories in Basin City are males with 5 or more vehicles (168, accounting for 52.8%) and females with 5 or more vehicles (26, making up 52.2%).
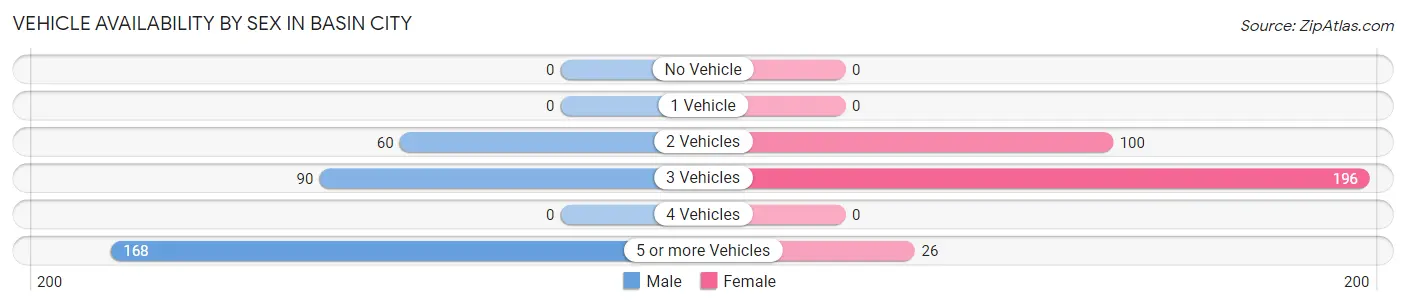
| Vehicles Available | Male | Female |
| No Vehicle | 0 (0.0%) | 0 (0.0%) |
| 1 Vehicle | 0 (0.0%) | 0 (0.0%) |
| 2 Vehicles | 60 (18.9%) | 100 (31.1%) |
| 3 Vehicles | 90 (28.3%) | 196 (60.9%) |
| 4 Vehicles | 0 (0.0%) | 0 (0.0%) |
| 5 or more Vehicles | 168 (52.8%) | 26 (8.1%) |
| Total | 318 (100.0%) | 322 (100.0%) |
Commute Time in Basin City
The most frequently occuring commute durations in Basin City are 15 to 19 minutes (136 commuters, 24.9%), 30 to 34 minutes (112 commuters, 20.5%), and 20 to 24 minutes (89 commuters, 16.3%).
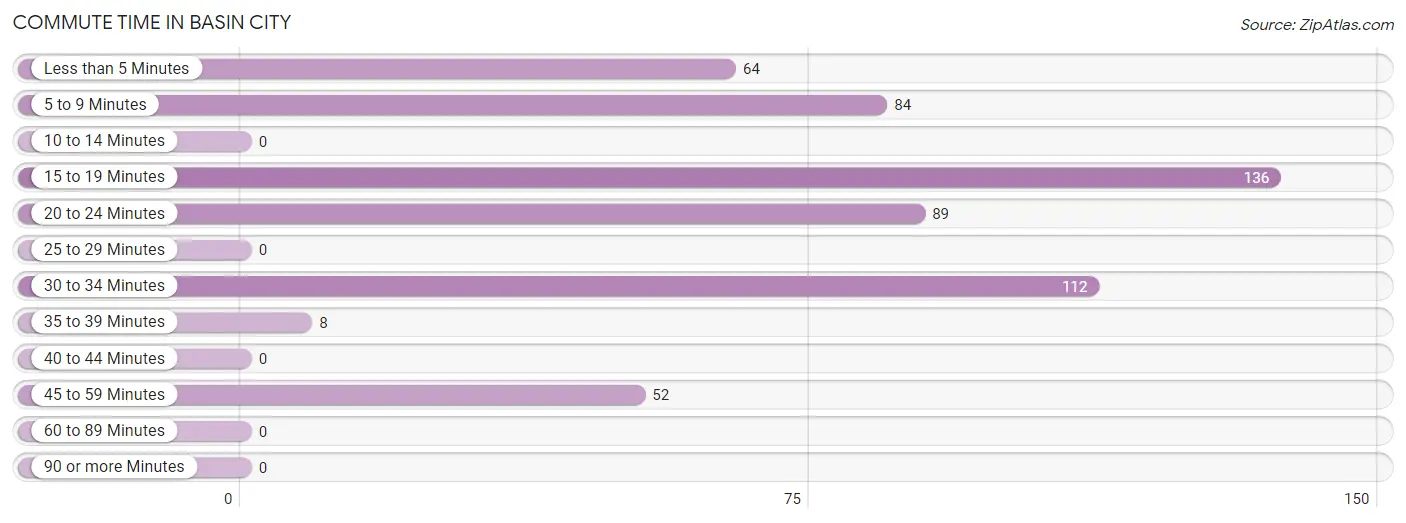
| Commute Time | # Commuters | % Commuters |
| Less than 5 Minutes | 64 | 11.7% |
| 5 to 9 Minutes | 84 | 15.4% |
| 10 to 14 Minutes | 0 | 0.0% |
| 15 to 19 Minutes | 136 | 24.9% |
| 20 to 24 Minutes | 89 | 16.3% |
| 25 to 29 Minutes | 0 | 0.0% |
| 30 to 34 Minutes | 112 | 20.5% |
| 35 to 39 Minutes | 8 | 1.5% |
| 40 to 44 Minutes | 0 | 0.0% |
| 45 to 59 Minutes | 52 | 9.5% |
| 60 to 89 Minutes | 0 | 0.0% |
| 90 or more Minutes | 0 | 0.0% |
Commute Time by Sex in Basin City
The most common commute times in Basin City are 30 to 34 minutes (112 commuters, 39.4%) for males and 20 to 24 minutes (89 commuters, 34.1%) for females.
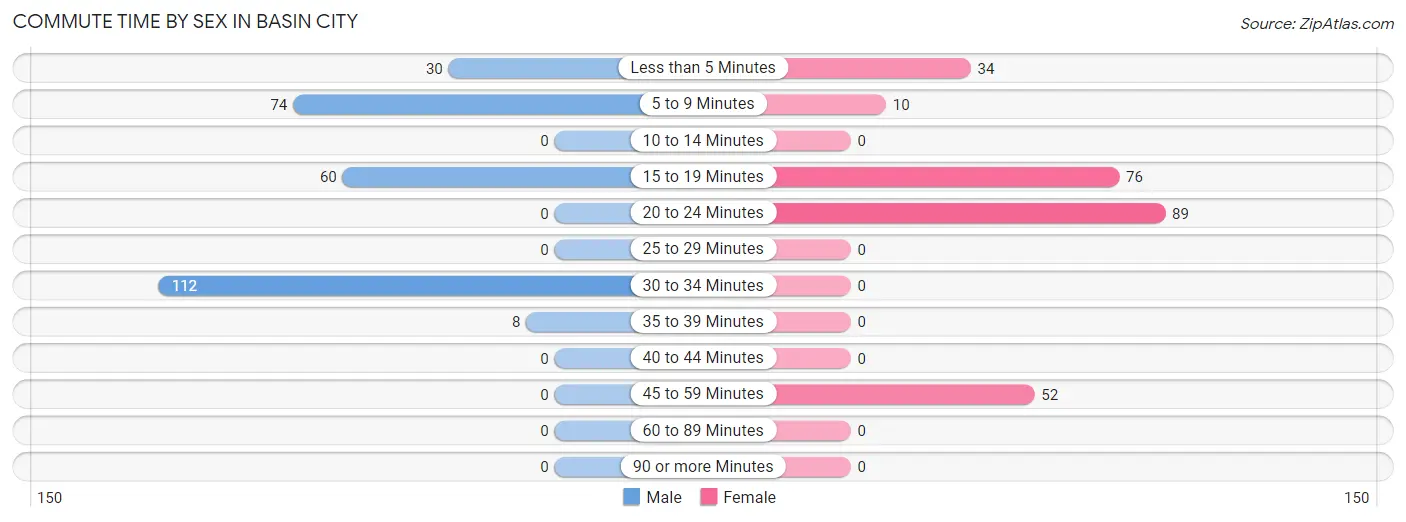
| Commute Time | Male | Female |
| Less than 5 Minutes | 30 (10.6%) | 34 (13.0%) |
| 5 to 9 Minutes | 74 (26.1%) | 10 (3.8%) |
| 10 to 14 Minutes | 0 (0.0%) | 0 (0.0%) |
| 15 to 19 Minutes | 60 (21.1%) | 76 (29.1%) |
| 20 to 24 Minutes | 0 (0.0%) | 89 (34.1%) |
| 25 to 29 Minutes | 0 (0.0%) | 0 (0.0%) |
| 30 to 34 Minutes | 112 (39.4%) | 0 (0.0%) |
| 35 to 39 Minutes | 8 (2.8%) | 0 (0.0%) |
| 40 to 44 Minutes | 0 (0.0%) | 0 (0.0%) |
| 45 to 59 Minutes | 0 (0.0%) | 52 (19.9%) |
| 60 to 89 Minutes | 0 (0.0%) | 0 (0.0%) |
| 90 or more Minutes | 0 (0.0%) | 0 (0.0%) |
Time of Departure to Work by Sex in Basin City
The most frequent times of departure to work in Basin City are 7:30 AM to 7:59 AM (71, 25.0%) for males and 7:00 AM to 7:29 AM (101, 38.7%) for females.
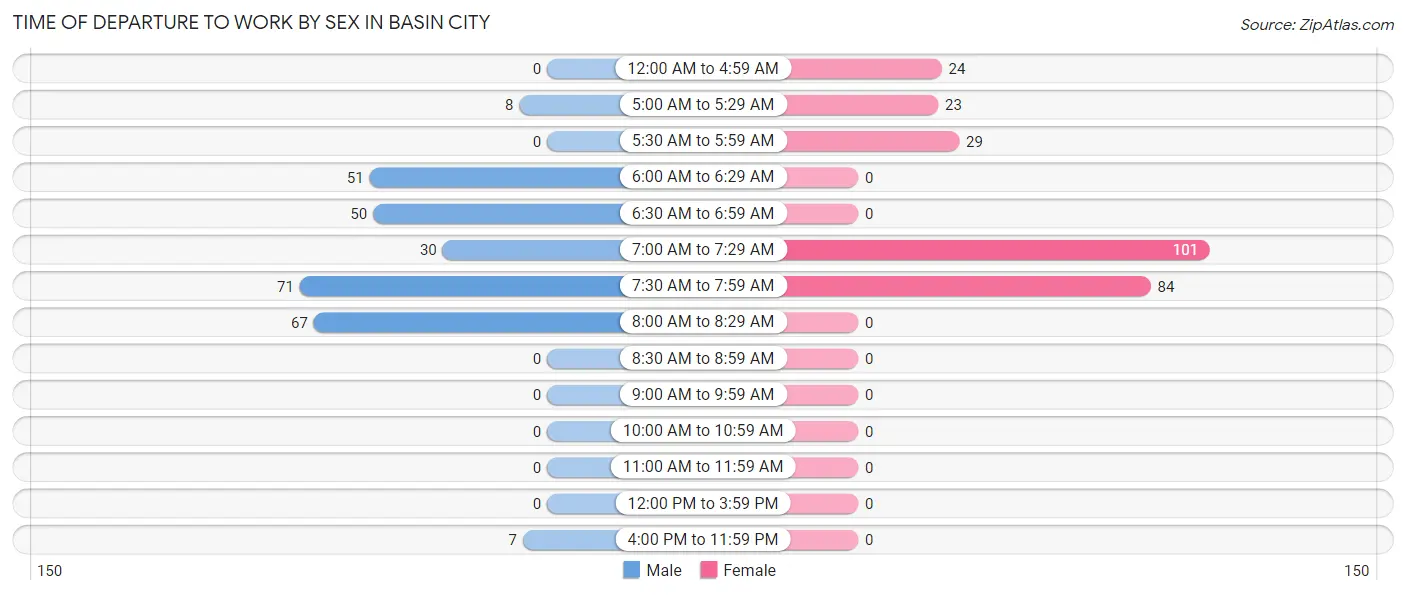
| Time of Departure | Male | Female |
| 12:00 AM to 4:59 AM | 0 (0.0%) | 24 (9.2%) |
| 5:00 AM to 5:29 AM | 8 (2.8%) | 23 (8.8%) |
| 5:30 AM to 5:59 AM | 0 (0.0%) | 29 (11.1%) |
| 6:00 AM to 6:29 AM | 51 (18.0%) | 0 (0.0%) |
| 6:30 AM to 6:59 AM | 50 (17.6%) | 0 (0.0%) |
| 7:00 AM to 7:29 AM | 30 (10.6%) | 101 (38.7%) |
| 7:30 AM to 7:59 AM | 71 (25.0%) | 84 (32.2%) |
| 8:00 AM to 8:29 AM | 67 (23.6%) | 0 (0.0%) |
| 8:30 AM to 8:59 AM | 0 (0.0%) | 0 (0.0%) |
| 9:00 AM to 9:59 AM | 0 (0.0%) | 0 (0.0%) |
| 10:00 AM to 10:59 AM | 0 (0.0%) | 0 (0.0%) |
| 11:00 AM to 11:59 AM | 0 (0.0%) | 0 (0.0%) |
| 12:00 PM to 3:59 PM | 0 (0.0%) | 0 (0.0%) |
| 4:00 PM to 11:59 PM | 7 (2.5%) | 0 (0.0%) |
| Total | 284 (100.0%) | 261 (100.0%) |
Housing Occupancy in Basin City
Occupancy by Ownership in Basin City
Of the total 337 dwellings in Basin City, owner-occupied units account for 264 (78.3%), while renter-occupied units make up 73 (21.7%).
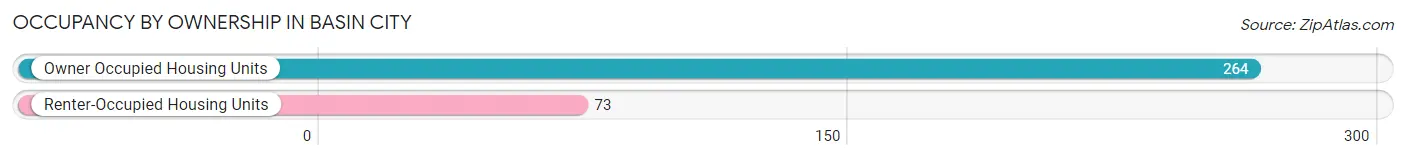
| Occupancy | # Housing Units | % Housing Units |
| Owner Occupied Housing Units | 264 | 78.3% |
| Renter-Occupied Housing Units | 73 | 21.7% |
| Total Occupied Housing Units | 337 | 100.0% |
Occupancy by Household Size in Basin City
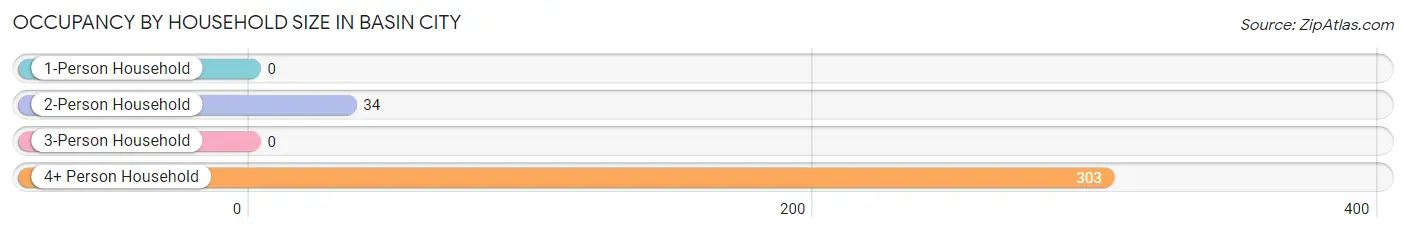
| Household Size | # Housing Units | % Housing Units |
| 1-Person Household | 0 | 0.0% |
| 2-Person Household | 34 | 10.1% |
| 3-Person Household | 0 | 0.0% |
| 4+ Person Household | 303 | 89.9% |
| Total Housing Units | 337 | 100.0% |
Occupancy by Ownership by Household Size in Basin City
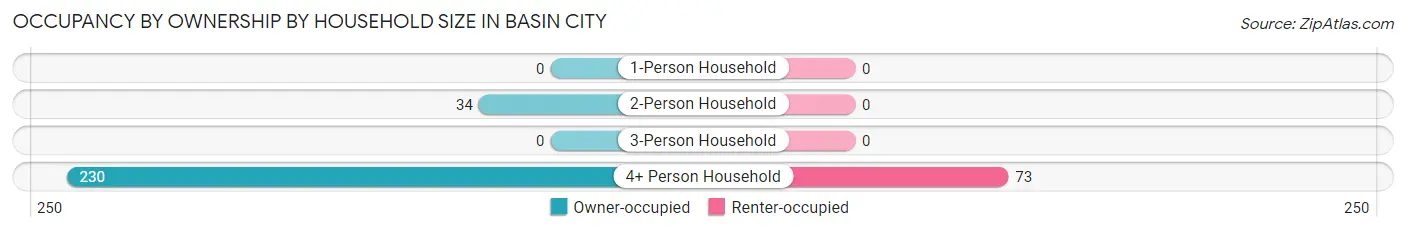
| Household Size | Owner-occupied | Renter-occupied |
| 1-Person Household | 0 (0.0%) | 0 (0.0%) |
| 2-Person Household | 34 (100.0%) | 0 (0.0%) |
| 3-Person Household | 0 (0.0%) | 0 (0.0%) |
| 4+ Person Household | 230 (75.9%) | 73 (24.1%) |
| Total Housing Units | 264 (78.3%) | 73 (21.7%) |
Occupancy by Educational Attainment in Basin City
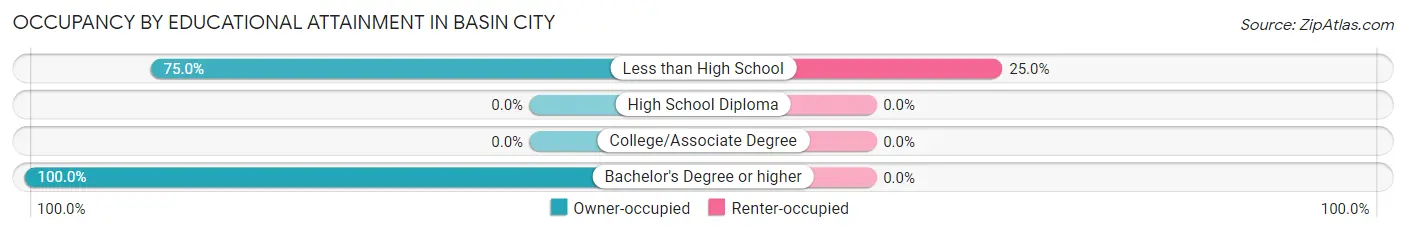
| Household Size | Owner-occupied | Renter-occupied |
| Less than High School | 219 (75.0%) | 73 (25.0%) |
| High School Diploma | 0 (0.0%) | 0 (0.0%) |
| College/Associate Degree | 0 (0.0%) | 0 (0.0%) |
| Bachelor's Degree or higher | 45 (100.0%) | 0 (0.0%) |
Occupancy by Age of Householder in Basin City
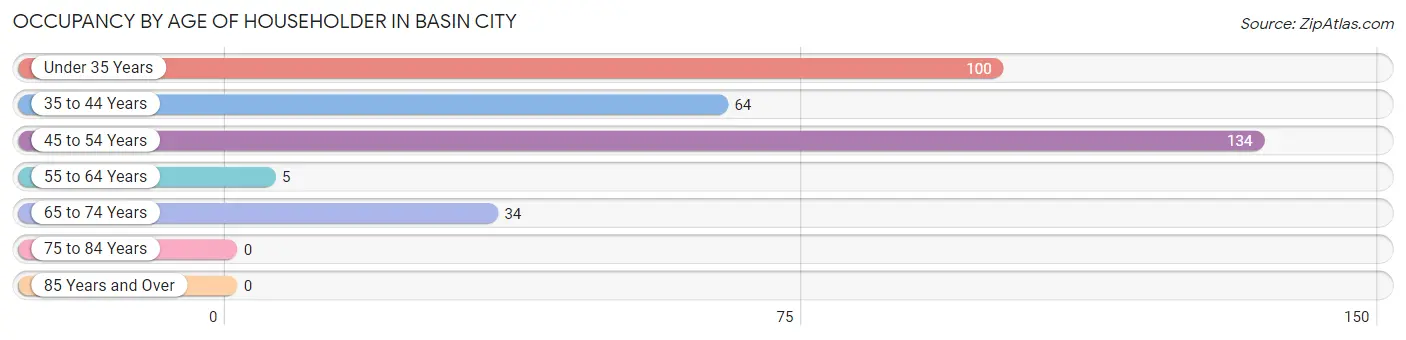
| Age Bracket | # Households | % Households |
| Under 35 Years | 100 | 29.7% |
| 35 to 44 Years | 64 | 19.0% |
| 45 to 54 Years | 134 | 39.8% |
| 55 to 64 Years | 5 | 1.5% |
| 65 to 74 Years | 34 | 10.1% |
| 75 to 84 Years | 0 | 0.0% |
| 85 Years and Over | 0 | 0.0% |
| Total | 337 | 100.0% |
Housing Finances in Basin City
Median Income by Occupancy in Basin City
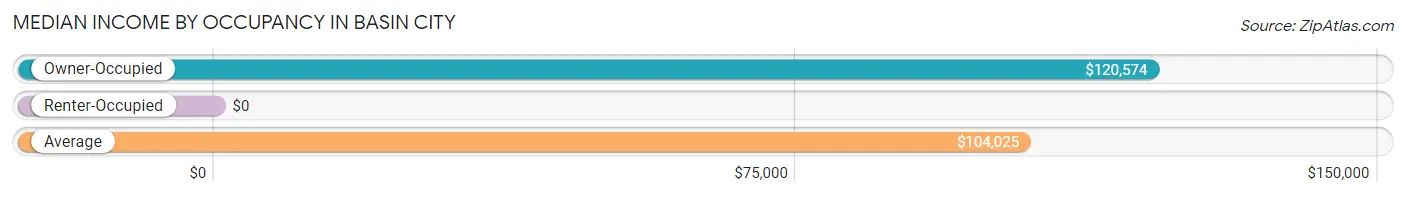
| Occupancy Type | # Households | Median Income |
| Owner-Occupied | 264 (78.3%) | $120,574 |
| Renter-Occupied | 73 (21.7%) | $0 |
| Average | 337 (100.0%) | $104,025 |
Occupancy by Householder Income Bracket in Basin City
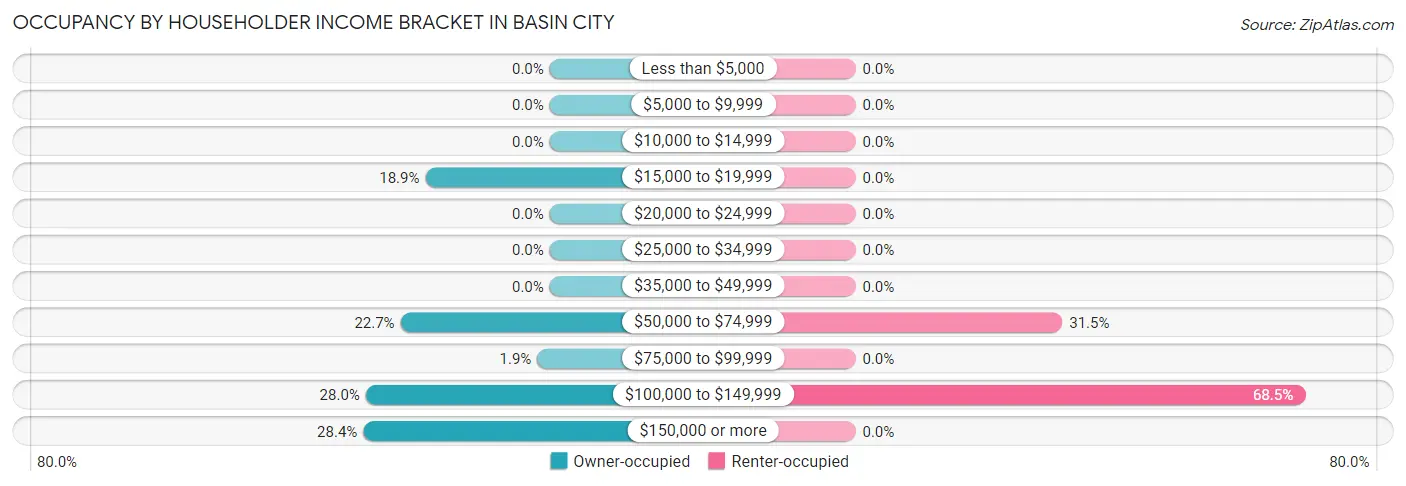
| Income Bracket | Owner-occupied | Renter-occupied |
| Less than $5,000 | 0 (0.0%) | 0 (0.0%) |
| $5,000 to $9,999 | 0 (0.0%) | 0 (0.0%) |
| $10,000 to $14,999 | 0 (0.0%) | 0 (0.0%) |
| $15,000 to $19,999 | 50 (18.9%) | 0 (0.0%) |
| $20,000 to $24,999 | 0 (0.0%) | 0 (0.0%) |
| $25,000 to $34,999 | 0 (0.0%) | 0 (0.0%) |
| $35,000 to $49,999 | 0 (0.0%) | 0 (0.0%) |
| $50,000 to $74,999 | 60 (22.7%) | 23 (31.5%) |
| $75,000 to $99,999 | 5 (1.9%) | 0 (0.0%) |
| $100,000 to $149,999 | 74 (28.0%) | 50 (68.5%) |
| $150,000 or more | 75 (28.4%) | 0 (0.0%) |
| Total | 264 (100.0%) | 73 (100.0%) |
Monthly Housing Cost Tiers in Basin City
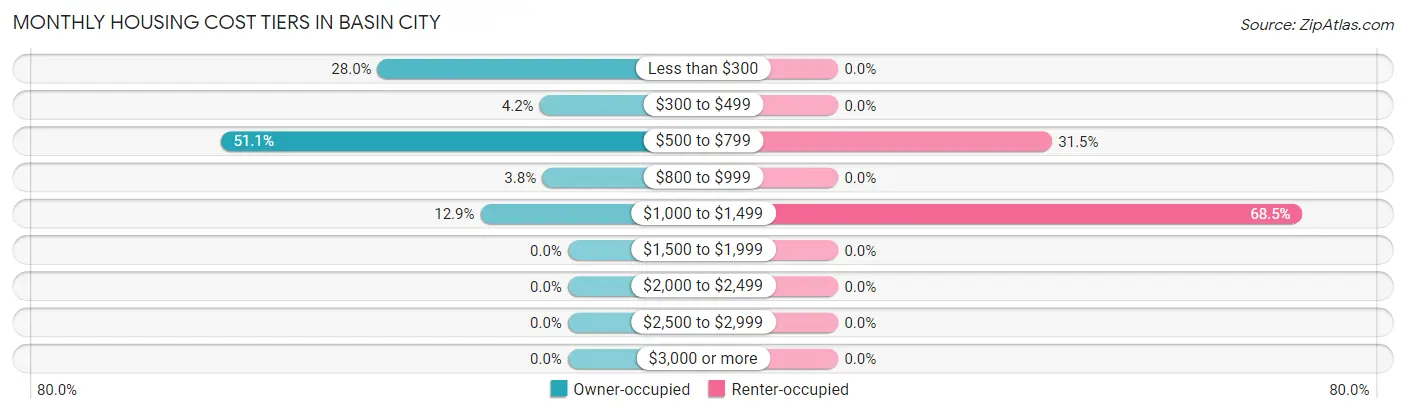
| Monthly Cost | Owner-occupied | Renter-occupied |
| Less than $300 | 74 (28.0%) | 0 (0.0%) |
| $300 to $499 | 11 (4.2%) | 0 (0.0%) |
| $500 to $799 | 135 (51.1%) | 23 (31.5%) |
| $800 to $999 | 10 (3.8%) | 0 (0.0%) |
| $1,000 to $1,499 | 34 (12.9%) | 50 (68.5%) |
| $1,500 to $1,999 | 0 (0.0%) | 0 (0.0%) |
| $2,000 to $2,499 | 0 (0.0%) | 0 (0.0%) |
| $2,500 to $2,999 | 0 (0.0%) | 0 (0.0%) |
| $3,000 or more | 0 (0.0%) | 0 (0.0%) |
| Total | 264 (100.0%) | 73 (100.0%) |
Physical Housing Characteristics in Basin City
Housing Structures in Basin City
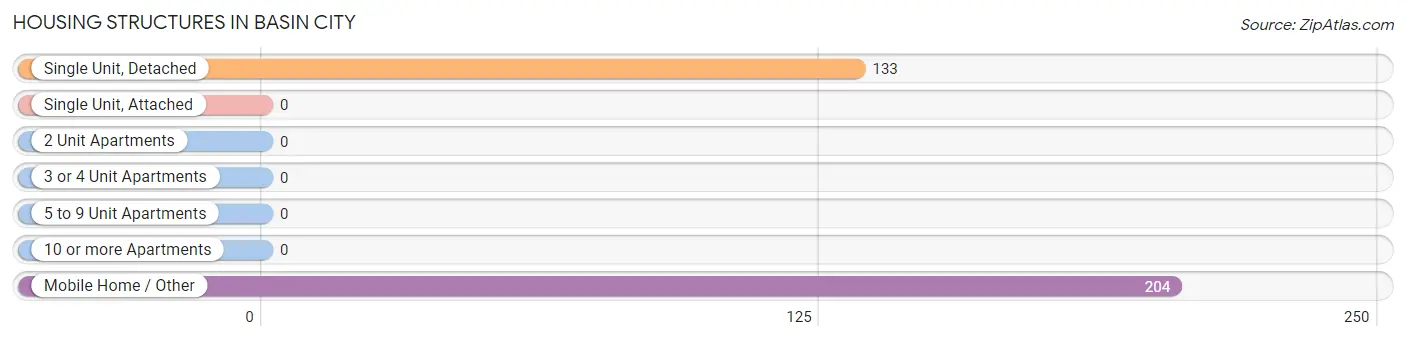
| Structure Type | # Housing Units | % Housing Units |
| Single Unit, Detached | 133 | 39.5% |
| Single Unit, Attached | 0 | 0.0% |
| 2 Unit Apartments | 0 | 0.0% |
| 3 or 4 Unit Apartments | 0 | 0.0% |
| 5 to 9 Unit Apartments | 0 | 0.0% |
| 10 or more Apartments | 0 | 0.0% |
| Mobile Home / Other | 204 | 60.5% |
| Total | 337 | 100.0% |
Housing Structures by Occupancy in Basin City
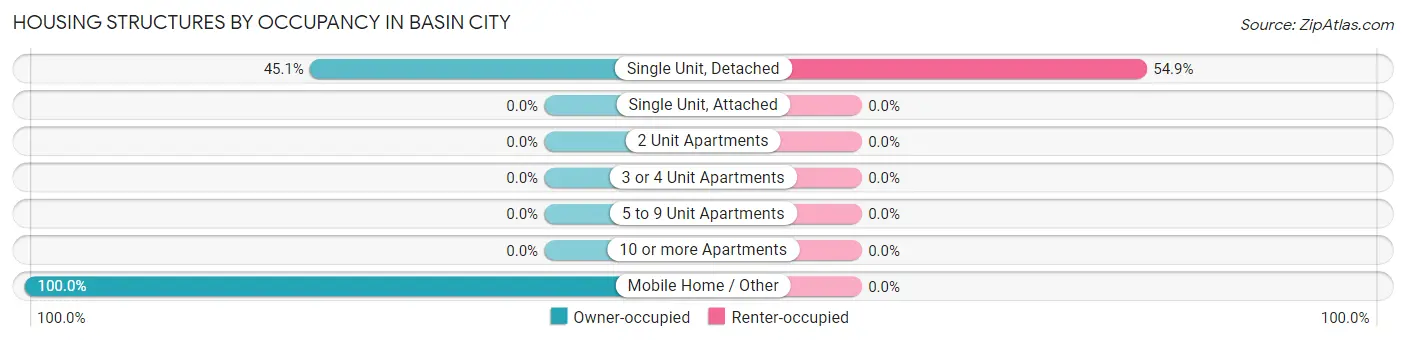
| Structure Type | Owner-occupied | Renter-occupied |
| Single Unit, Detached | 60 (45.1%) | 73 (54.9%) |
| Single Unit, Attached | 0 (0.0%) | 0 (0.0%) |
| 2 Unit Apartments | 0 (0.0%) | 0 (0.0%) |
| 3 or 4 Unit Apartments | 0 (0.0%) | 0 (0.0%) |
| 5 to 9 Unit Apartments | 0 (0.0%) | 0 (0.0%) |
| 10 or more Apartments | 0 (0.0%) | 0 (0.0%) |
| Mobile Home / Other | 204 (100.0%) | 0 (0.0%) |
| Total | 264 (78.3%) | 73 (21.7%) |
Housing Structures by Number of Rooms in Basin City
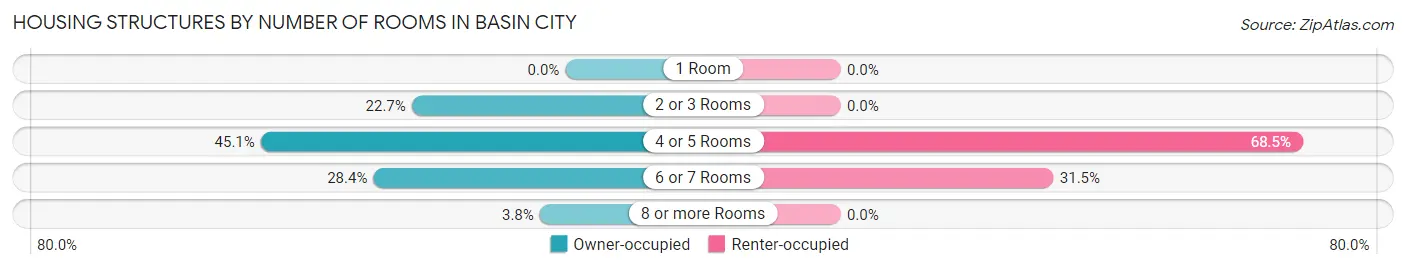
| Number of Rooms | Owner-occupied | Renter-occupied |
| 1 Room | 0 (0.0%) | 0 (0.0%) |
| 2 or 3 Rooms | 60 (22.7%) | 0 (0.0%) |
| 4 or 5 Rooms | 119 (45.1%) | 50 (68.5%) |
| 6 or 7 Rooms | 75 (28.4%) | 23 (31.5%) |
| 8 or more Rooms | 10 (3.8%) | 0 (0.0%) |
| Total | 264 (100.0%) | 73 (100.0%) |
Housing Structure by Heating Type in Basin City
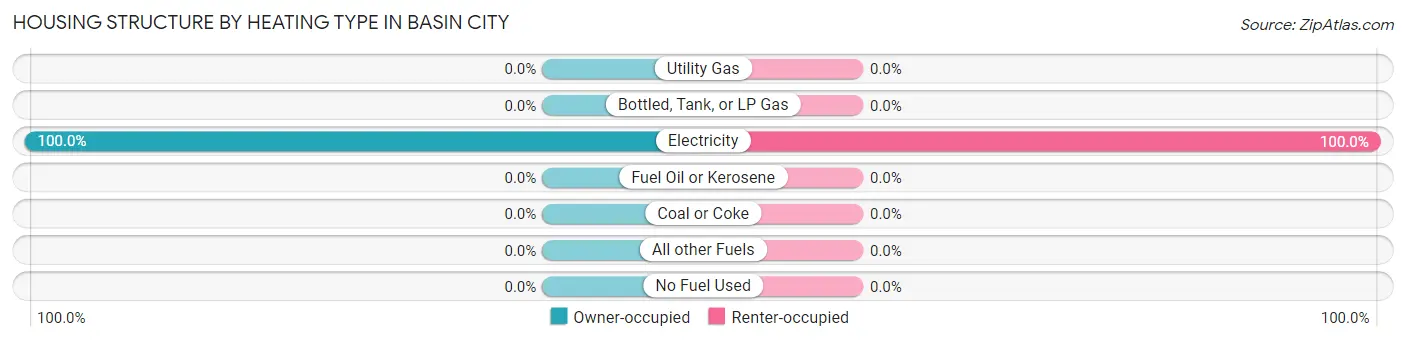
| Heating Type | Owner-occupied | Renter-occupied |
| Utility Gas | 0 (0.0%) | 0 (0.0%) |
| Bottled, Tank, or LP Gas | 0 (0.0%) | 0 (0.0%) |
| Electricity | 264 (100.0%) | 73 (100.0%) |
| Fuel Oil or Kerosene | 0 (0.0%) | 0 (0.0%) |
| Coal or Coke | 0 (0.0%) | 0 (0.0%) |
| All other Fuels | 0 (0.0%) | 0 (0.0%) |
| No Fuel Used | 0 (0.0%) | 0 (0.0%) |
| Total | 264 (100.0%) | 73 (100.0%) |
Household Vehicle Usage in Basin City
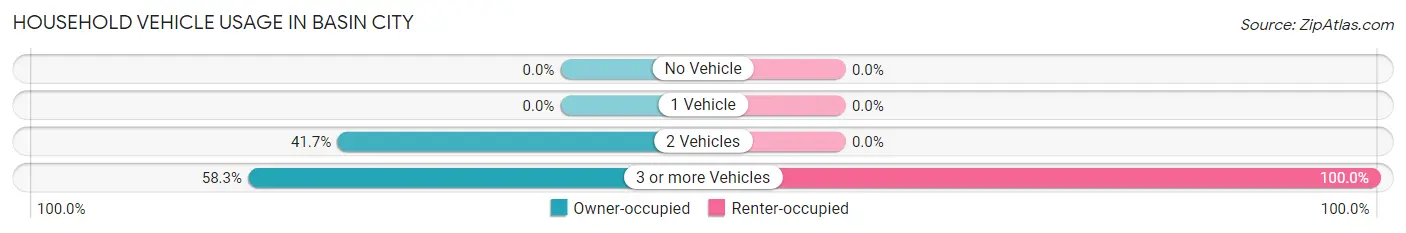
| Vehicles per Household | Owner-occupied | Renter-occupied |
| No Vehicle | 0 (0.0%) | 0 (0.0%) |
| 1 Vehicle | 0 (0.0%) | 0 (0.0%) |
| 2 Vehicles | 110 (41.7%) | 0 (0.0%) |
| 3 or more Vehicles | 154 (58.3%) | 73 (100.0%) |
| Total | 264 (100.0%) | 73 (100.0%) |
Real Estate & Mortgages in Basin City
Real Estate and Mortgage Overview in Basin City
| Characteristic | Without Mortgage | With Mortgage |
| Housing Units | 215 | 49 |
| Median Property Value | - | - |
| Median Household Income | - | - |
| Monthly Housing Costs | $538 | $0 |
| Real Estate Taxes | $199 | $0 |
Property Value by Mortgage Status in Basin City
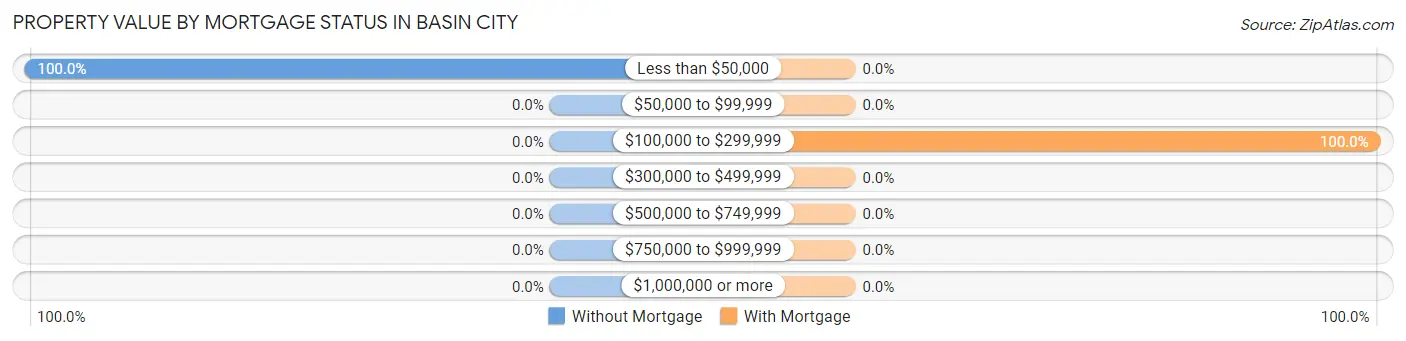
| Property Value | Without Mortgage | With Mortgage |
| Less than $50,000 | 215 (100.0%) | 0 (0.0%) |
| $50,000 to $99,999 | 0 (0.0%) | 0 (0.0%) |
| $100,000 to $299,999 | 0 (0.0%) | 49 (100.0%) |
| $300,000 to $499,999 | 0 (0.0%) | 0 (0.0%) |
| $500,000 to $749,999 | 0 (0.0%) | 0 (0.0%) |
| $750,000 to $999,999 | 0 (0.0%) | 0 (0.0%) |
| $1,000,000 or more | 0 (0.0%) | 0 (0.0%) |
| Total | 215 (100.0%) | 49 (100.0%) |
Household Income by Mortgage Status in Basin City
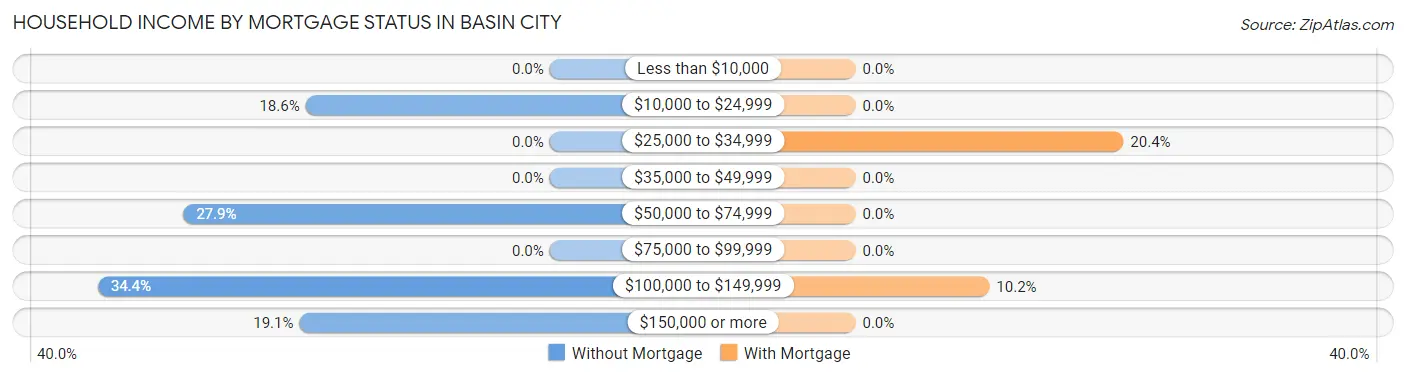
| Household Income | Without Mortgage | With Mortgage |
| Less than $10,000 | 0 (0.0%) | 0 (0.0%) |
| $10,000 to $24,999 | 40 (18.6%) | 0 (0.0%) |
| $25,000 to $34,999 | 0 (0.0%) | 10 (20.4%) |
| $35,000 to $49,999 | 0 (0.0%) | 0 (0.0%) |
| $50,000 to $74,999 | 60 (27.9%) | 0 (0.0%) |
| $75,000 to $99,999 | 0 (0.0%) | 0 (0.0%) |
| $100,000 to $149,999 | 74 (34.4%) | 5 (10.2%) |
| $150,000 or more | 41 (19.1%) | 0 (0.0%) |
| Total | 215 (100.0%) | 49 (100.0%) |
Property Value to Household Income Ratio in Basin City
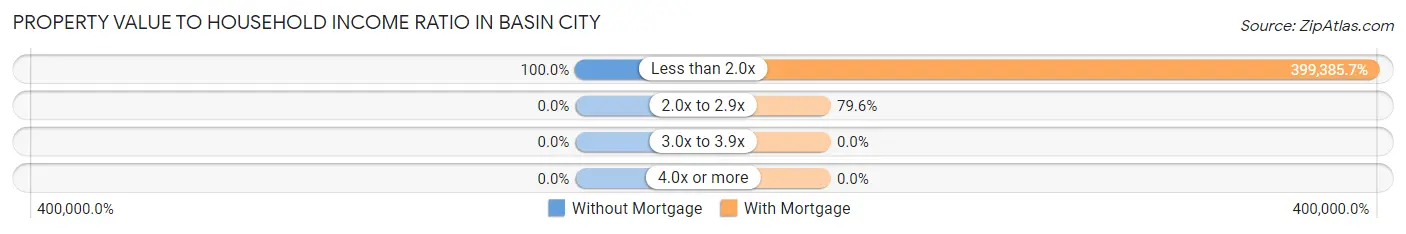
| Value-to-Income Ratio | Without Mortgage | With Mortgage |
| Less than 2.0x | 215 (100.0%) | 195,699 (399,385.7%) |
| 2.0x to 2.9x | 0 (0.0%) | 39 (79.6%) |
| 3.0x to 3.9x | 0 (0.0%) | 0 (0.0%) |
| 4.0x or more | 0 (0.0%) | 0 (0.0%) |
| Total | 215 (100.0%) | 49 (100.0%) |
Real Estate Taxes by Mortgage Status in Basin City
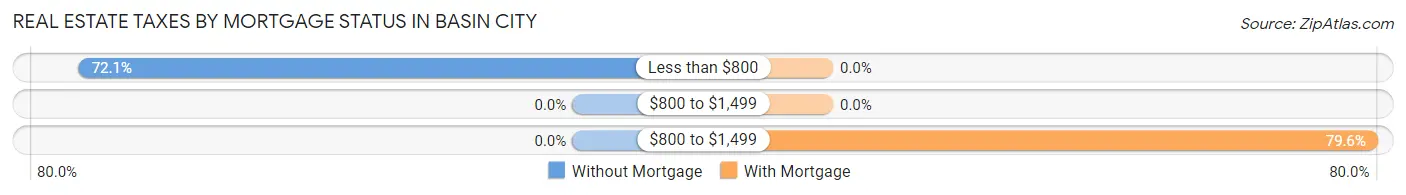
| Property Taxes | Without Mortgage | With Mortgage |
| Less than $800 | 155 (72.1%) | 0 (0.0%) |
| $800 to $1,499 | 0 (0.0%) | 0 (0.0%) |
| $800 to $1,499 | 0 (0.0%) | 39 (79.6%) |
| Total | 215 (100.0%) | 49 (100.0%) |
Health & Disability in Basin City
Health Insurance Coverage by Age in Basin City
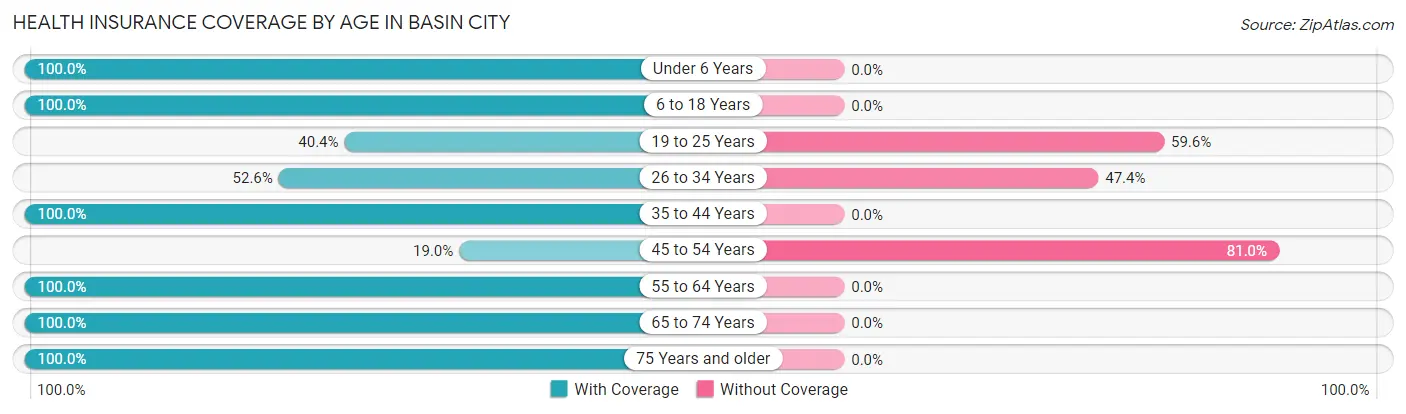
| Age Bracket | With Coverage | Without Coverage |
| Under 6 Years | 367 (100.0%) | 0 (0.0%) |
| 6 to 18 Years | 209 (100.0%) | 0 (0.0%) |
| 19 to 25 Years | 109 (40.4%) | 161 (59.6%) |
| 26 to 34 Years | 140 (52.6%) | 126 (47.4%) |
| 35 to 44 Years | 100 (100.0%) | 0 (0.0%) |
| 45 to 54 Years | 44 (19.0%) | 188 (81.0%) |
| 55 to 64 Years | 44 (100.0%) | 0 (0.0%) |
| 65 to 74 Years | 50 (100.0%) | 0 (0.0%) |
| 75 Years and older | 32 (100.0%) | 0 (0.0%) |
| Total | 1,095 (69.8%) | 475 (30.2%) |
Health Insurance Coverage by Citizenship Status in Basin City
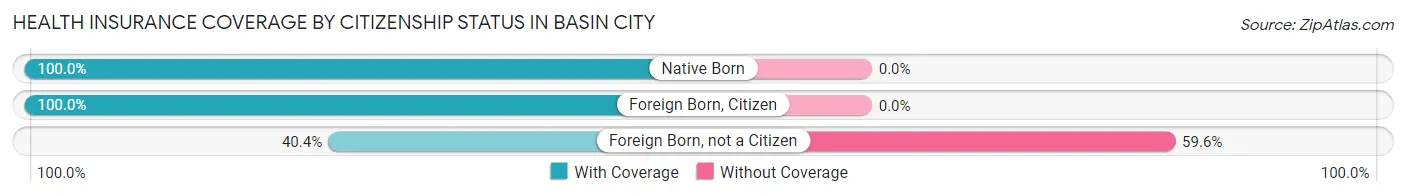
| Citizenship Status | With Coverage | Without Coverage |
| Native Born | 367 (100.0%) | 0 (0.0%) |
| Foreign Born, Citizen | 209 (100.0%) | 0 (0.0%) |
| Foreign Born, not a Citizen | 109 (40.4%) | 161 (59.6%) |
Health Insurance Coverage by Household Income in Basin City
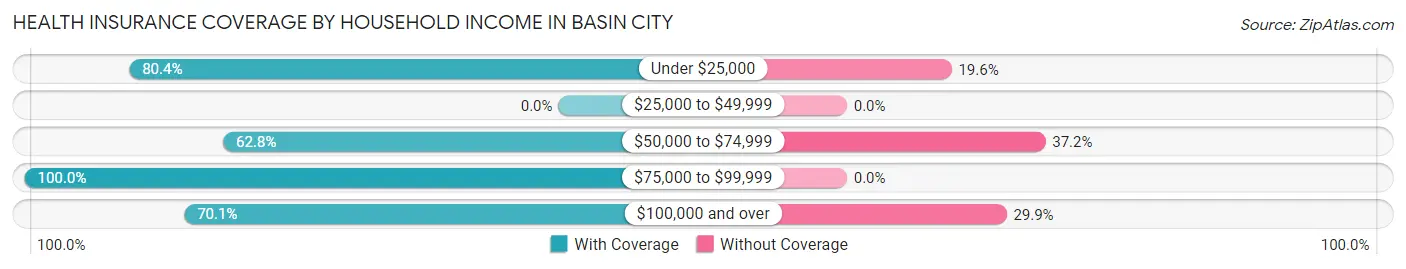
| Household Income | With Coverage | Without Coverage |
| Under $25,000 | 164 (80.4%) | 40 (19.6%) |
| $25,000 to $49,999 | 0 (0.0%) | 0 (0.0%) |
| $50,000 to $74,999 | 331 (62.8%) | 196 (37.2%) |
| $75,000 to $99,999 | 40 (100.0%) | 0 (0.0%) |
| $100,000 and over | 560 (70.1%) | 239 (29.9%) |
Public vs Private Health Insurance Coverage by Age in Basin City
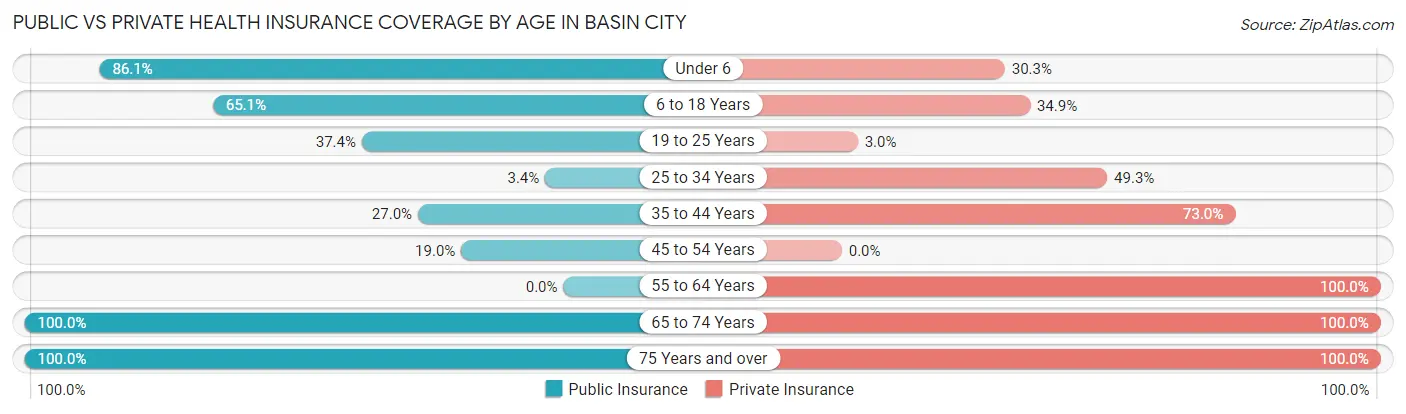
| Age Bracket | Public Insurance | Private Insurance |
| Under 6 | 316 (86.1%) | 111 (30.2%) |
| 6 to 18 Years | 136 (65.1%) | 73 (34.9%) |
| 19 to 25 Years | 101 (37.4%) | 8 (3.0%) |
| 25 to 34 Years | 9 (3.4%) | 131 (49.2%) |
| 35 to 44 Years | 27 (27.0%) | 73 (73.0%) |
| 45 to 54 Years | 44 (19.0%) | 0 (0.0%) |
| 55 to 64 Years | 0 (0.0%) | 44 (100.0%) |
| 65 to 74 Years | 50 (100.0%) | 50 (100.0%) |
| 75 Years and over | 32 (100.0%) | 32 (100.0%) |
| Total | 715 (45.5%) | 522 (33.3%) |
Disability Status by Sex by Age in Basin City
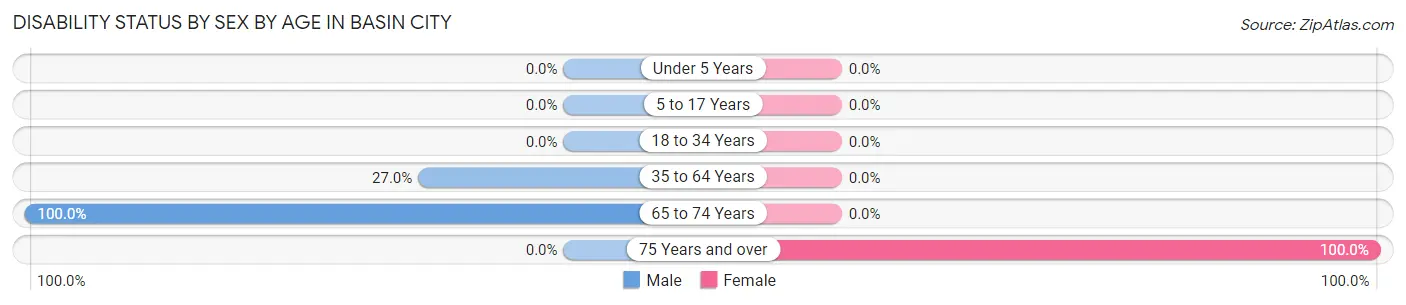
| Age Bracket | Male | Female |
| Under 5 Years | 0 (0.0%) | 0 (0.0%) |
| 5 to 17 Years | 0 (0.0%) | 0 (0.0%) |
| 18 to 34 Years | 0 (0.0%) | 0 (0.0%) |
| 35 to 64 Years | 55 (27.0%) | 0 (0.0%) |
| 65 to 74 Years | 16 (100.0%) | 0 (0.0%) |
| 75 Years and over | 0 (0.0%) | 32 (100.0%) |
Disability Class by Sex by Age in Basin City
Disability Class: Hearing Difficulty
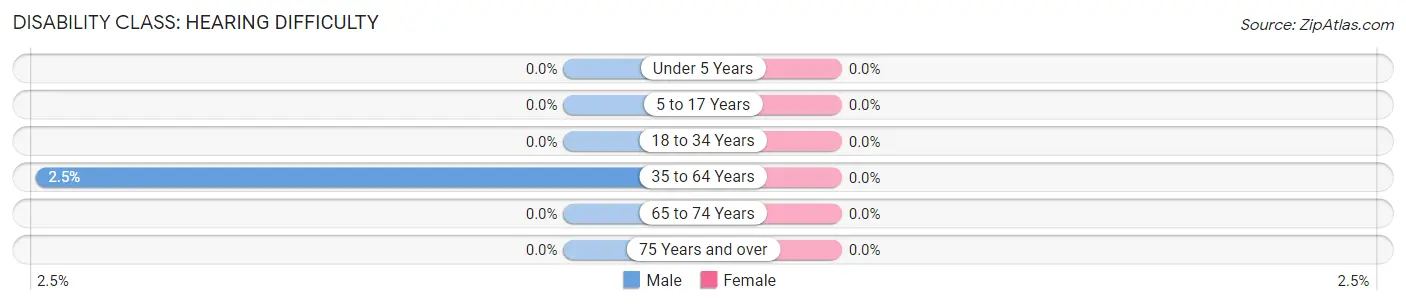
| Age Bracket | Male | Female |
| Under 5 Years | 0 (0.0%) | 0 (0.0%) |
| 5 to 17 Years | 0 (0.0%) | 0 (0.0%) |
| 18 to 34 Years | 0 (0.0%) | 0 (0.0%) |
| 35 to 64 Years | 5 (2.5%) | 0 (0.0%) |
| 65 to 74 Years | 0 (0.0%) | 0 (0.0%) |
| 75 Years and over | 0 (0.0%) | 0 (0.0%) |
Disability Class: Vision Difficulty
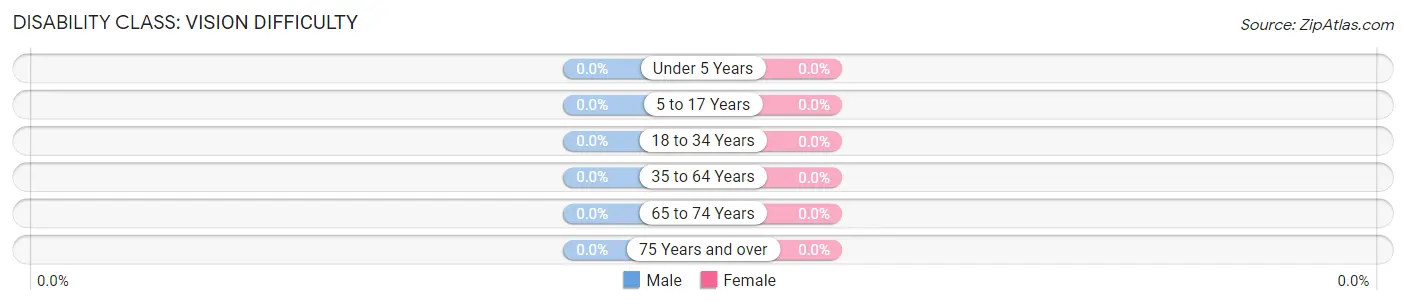
| Age Bracket | Male | Female |
| Under 5 Years | 0 (0.0%) | 0 (0.0%) |
| 5 to 17 Years | 0 (0.0%) | 0 (0.0%) |
| 18 to 34 Years | 0 (0.0%) | 0 (0.0%) |
| 35 to 64 Years | 0 (0.0%) | 0 (0.0%) |
| 65 to 74 Years | 0 (0.0%) | 0 (0.0%) |
| 75 Years and over | 0 (0.0%) | 0 (0.0%) |
Disability Class: Cognitive Difficulty
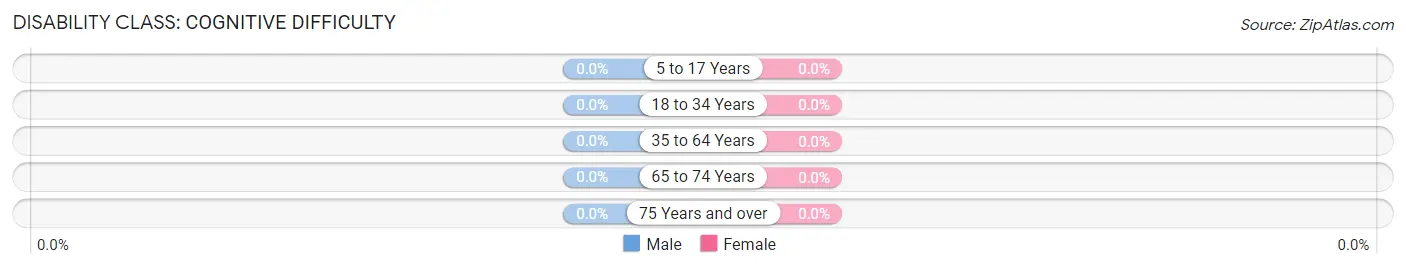
| Age Bracket | Male | Female |
| 5 to 17 Years | 0 (0.0%) | 0 (0.0%) |
| 18 to 34 Years | 0 (0.0%) | 0 (0.0%) |
| 35 to 64 Years | 0 (0.0%) | 0 (0.0%) |
| 65 to 74 Years | 0 (0.0%) | 0 (0.0%) |
| 75 Years and over | 0 (0.0%) | 0 (0.0%) |
Disability Class: Ambulatory Difficulty
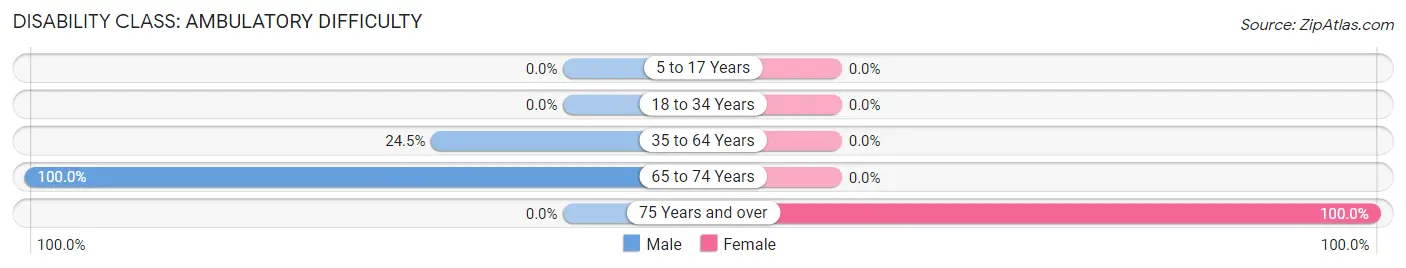
| Age Bracket | Male | Female |
| 5 to 17 Years | 0 (0.0%) | 0 (0.0%) |
| 18 to 34 Years | 0 (0.0%) | 0 (0.0%) |
| 35 to 64 Years | 50 (24.5%) | 0 (0.0%) |
| 65 to 74 Years | 16 (100.0%) | 0 (0.0%) |
| 75 Years and over | 0 (0.0%) | 32 (100.0%) |
Disability Class: Self-Care Difficulty
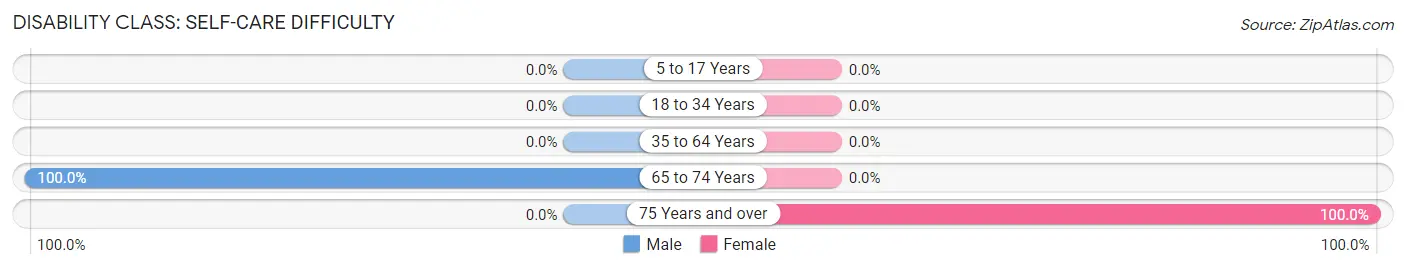
| Age Bracket | Male | Female |
| 5 to 17 Years | 0 (0.0%) | 0 (0.0%) |
| 18 to 34 Years | 0 (0.0%) | 0 (0.0%) |
| 35 to 64 Years | 0 (0.0%) | 0 (0.0%) |
| 65 to 74 Years | 16 (100.0%) | 0 (0.0%) |
| 75 Years and over | 0 (0.0%) | 32 (100.0%) |
Technology Access in Basin City
Computing Device Access in Basin City
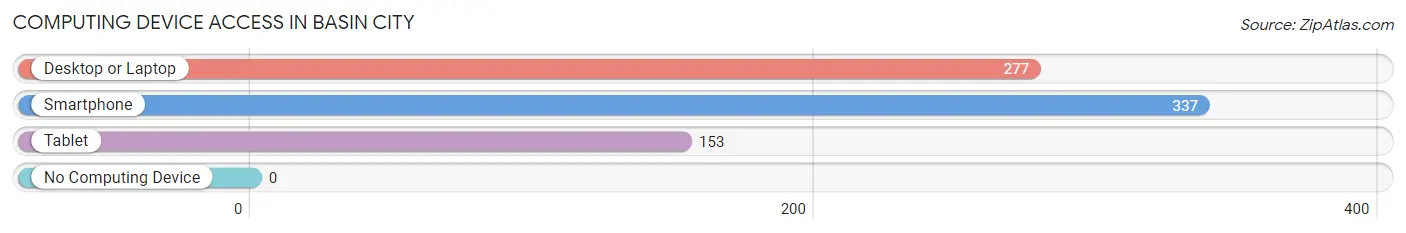
| Device Type | # Households | % Households |
| Desktop or Laptop | 277 | 82.2% |
| Smartphone | 337 | 100.0% |
| Tablet | 153 | 45.4% |
| No Computing Device | 0 | 0.0% |
| Total | 337 | 100.0% |
Internet Access in Basin City
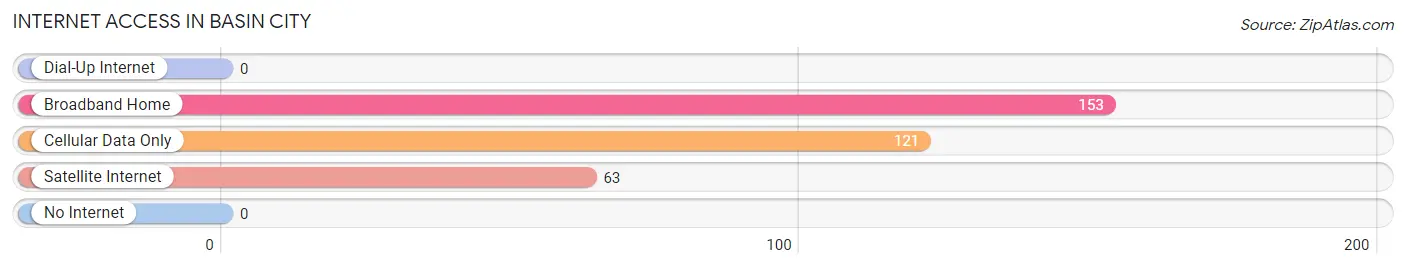
| Internet Type | # Households | % Households |
| Dial-Up Internet | 0 | 0.0% |
| Broadband Home | 153 | 45.4% |
| Cellular Data Only | 121 | 35.9% |
| Satellite Internet | 63 | 18.7% |
| No Internet | 0 | 0.0% |
| Total | 337 | 100.0% |
Basin City Summary
Basin City is a small town located in the state of Washington, United States. It is situated in the south-central part of the state, in Franklin County. The town is located on the banks of the Columbia River, and is surrounded by the Columbia Basin. The population of Basin City was 1,845 at the 2010 census.
History
Basin City was founded in 1883 by a group of settlers from the Midwest. The town was originally called "Basin City" because of its location in the Columbia Basin. The settlers were attracted to the area by the abundance of natural resources, including timber, fish, and water. The town quickly grew and became an important center for the timber industry.
In the early 1900s, Basin City was a thriving community with a population of over 1,000. The town had a variety of businesses, including a sawmill, a flour mill, a hotel, and a general store. The town also had a school, a post office, and a newspaper.
In the 1920s, the timber industry began to decline, and the population of Basin City began to decline as well. The town was hit hard by the Great Depression, and many of the businesses closed. The population of Basin City dropped to just over 500 by 1940.
In the 1950s, the timber industry began to recover, and the population of Basin City began to increase again. The town was incorporated in 1959, and the population grew to 1,845 by the 2010 census.
Geography
Basin City is located in the south-central part of Washington, in Franklin County. The town is situated on the banks of the Columbia River, and is surrounded by the Columbia Basin. The town is located at an elevation of 1,845 feet (562 m).
The climate in Basin City is semi-arid, with hot summers and cold winters. The average annual temperature is 48°F (9°C). The average annual precipitation is 8.5 inches (216 mm).
Economy
The economy of Basin City is largely based on agriculture and tourism. The town is home to several farms, which produce a variety of crops, including wheat, corn, and hay. The town is also home to several wineries, which produce a variety of wines.
Tourism is an important part of the economy of Basin City. The town is home to several attractions, including the Columbia River, the Columbia Basin, and the nearby Cascade Mountains. The town is also home to several parks, including the Basin City State Park.
Demographics
As of the 2010 census, the population of Basin City was 1,845. The racial makeup of the town was 94.3% White, 0.7% African American, 0.7% Native American, 0.7% Asian, 0.2% Pacific Islander, and 2.6% from other races. The median household income was $37,917, and the median family income was $45,313.
Conclusion
Basin City is a small town located in the state of Washington, United States. It is situated in the south-central part of the state, in Franklin County. The town is located on the banks of the Columbia River, and is surrounded by the Columbia Basin. The population of Basin City was 1,845 at the 2010 census. The economy of Basin City is largely based on agriculture and tourism. The town is home to several farms, which produce a variety of crops, including wheat, corn, and hay. The town is also home to several wineries, which produce a variety of wines. Tourism is an important part of the economy of Basin City. The town is home to several attractions, including the Columbia River, the Columbia Basin, and the nearby Cascade Mountains. The town is also home to several parks, including the Basin City State Park. As of the 2010 census, the population of Basin City was 1,845. The racial makeup of the town was 94.3% White, 0.7% African American, 0.7% Native American, 0.7% Asian, 0.2% Pacific Islander, and 2.6% from other races. The median household income was $37,917, and the median family income was $45,313.
Common Questions
What is Per Capita Income in Basin City?
Per Capita income in Basin City is $22,413.
What is the Median Family Income in Basin City?
Median Family Income in Basin City is $104,025.
What is the Median Household income in Basin City?
Median Household Income in Basin City is $104,025.
What is Income or Wage Gap in Basin City?
Income or Wage Gap in Basin City is 26.6%.
Women in Basin City earn 73.4 cents for every dollar earned by a man.
What is Inequality or Gini Index in Basin City?
Inequality or Gini Index in Basin City is 0.36.
What is the Total Population of Basin City?
Total Population of Basin City is 1,570.
What is the Total Male Population of Basin City?
Total Male Population of Basin City is 671.
What is the Total Female Population of Basin City?
Total Female Population of Basin City is 899.
What is the Ratio of Males per 100 Females in Basin City?
There are 74.64 Males per 100 Females in Basin City.
What is the Ratio of Females per 100 Males in Basin City?
There are 133.98 Females per 100 Males in Basin City.
What is the Median Population Age in Basin City?
Median Population Age in Basin City is 23.0 Years.
What is the Average Family Size in Basin City
Average Family Size in Basin City is 4.7 People.
What is the Average Household Size in Basin City
Average Household Size in Basin City is 4.7 People.
How Large is the Labor Force in Basin City?
There are 640 People in the Labor Forcein in Basin City.
What is the Percentage of People in the Labor Force in Basin City?
62.1% of People are in the Labor Force in Basin City.