Napavine, WA Map & Demographics
Napavine Map
Napavine Overview
$31,873
PER CAPITA INCOME
$90,729
AVG FAMILY INCOME
$70,833
AVG HOUSEHOLD INCOME
32.9%
WAGE / INCOME GAP [ % ]
67.1¢/ $1
WAGE / INCOME GAP [ $ ]
0.37
INEQUALITY / GINI INDEX
1,700
TOTAL POPULATION
891
MALE POPULATION
809
FEMALE POPULATION
110.14
MALES / 100 FEMALES
90.80
FEMALES / 100 MALES
34.6
MEDIAN AGE
3.0
AVG FAMILY SIZE
2.6
AVG HOUSEHOLD SIZE
869
LABOR FORCE [ PEOPLE ]
63.7%
PERCENT IN LABOR FORCE
7.2%
UNEMPLOYMENT RATE
Napavine Zip Codes
Napavine Area Codes
Income in Napavine
Income Overview in Napavine
Per Capita Income in Napavine is $31,873, while median incomes of families and households are $90,729 and $70,833 respectively.
| Characteristic | Number | Measure |
| Per Capita Income | 1,700 | $31,873 |
| Median Family Income | 487 | $90,729 |
| Mean Family Income | 487 | $92,784 |
| Median Household Income | 642 | $70,833 |
| Mean Household Income | 642 | $83,671 |
| Income Deficit | 487 | $0 |
| Wage / Income Gap (%) | 1,700 | 32.93% |
| Wage / Income Gap ($) | 1,700 | 67.07¢ per $1 |
| Gini / Inequality Index | 1,700 | 0.37 |
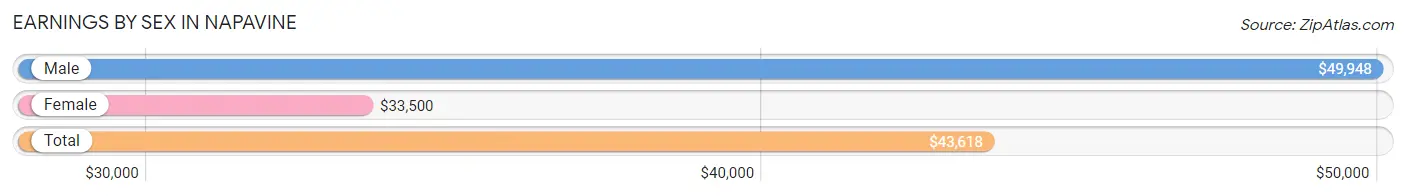
Earnings by Sex in Napavine
Average Earnings in Napavine are $43,618, $49,948 for men and $33,500 for women, a difference of 32.9%.
| Sex | Number | Average Earnings |
| Male | 543 (59.7%) | $49,948 |
| Female | 366 (40.3%) | $33,500 |
| Total | 909 (100.0%) | $43,618 |
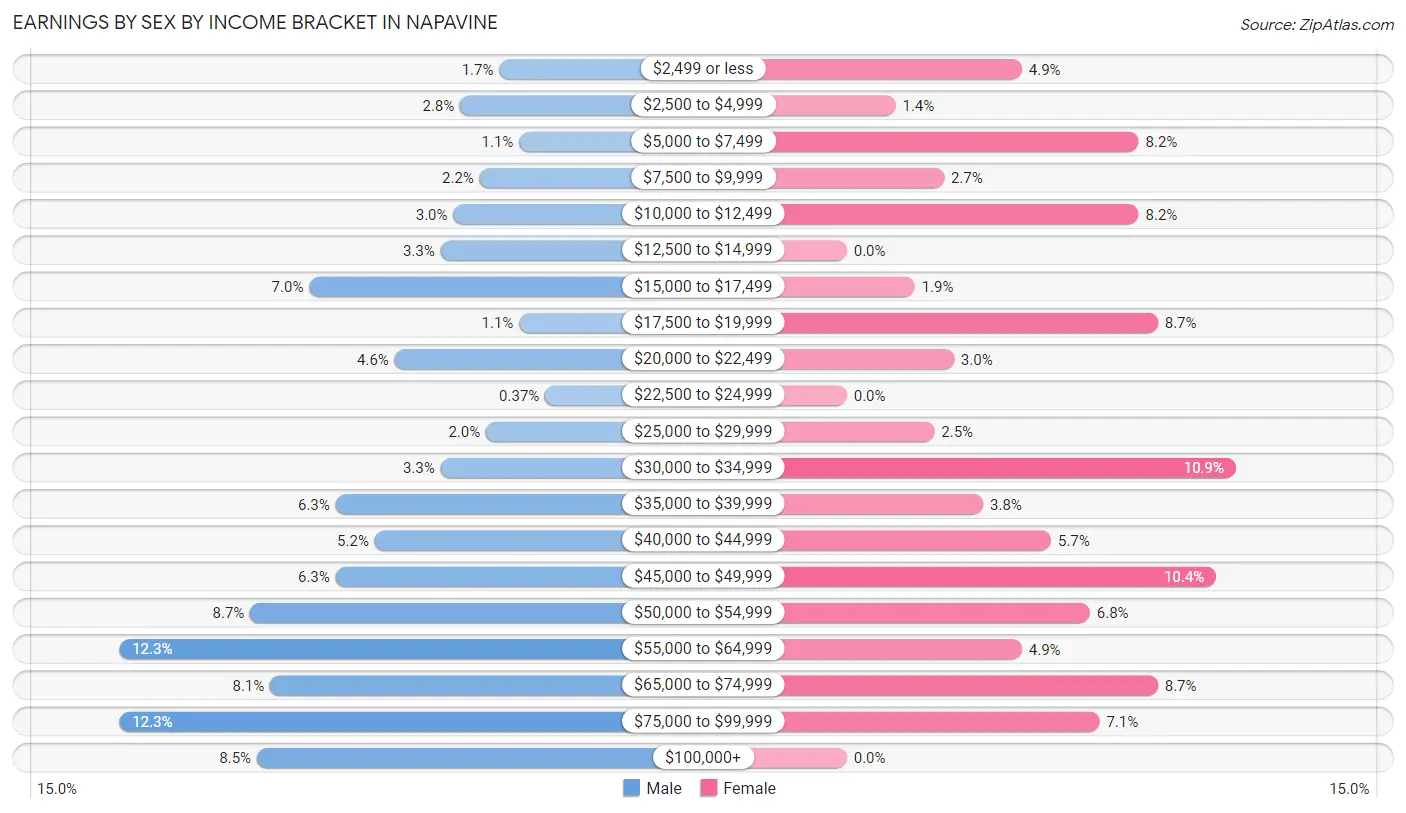
Earnings by Sex by Income Bracket in Napavine
The most common earnings brackets in Napavine are $55,000 to $64,999 for men (67 | 12.3%) and $30,000 to $34,999 for women (40 | 10.9%).
| Income | Male | Female |
| $2,499 or less | 9 (1.7%) | 18 (4.9%) |
| $2,500 to $4,999 | 15 (2.8%) | 5 (1.4%) |
| $5,000 to $7,499 | 6 (1.1%) | 30 (8.2%) |
| $7,500 to $9,999 | 12 (2.2%) | 10 (2.7%) |
| $10,000 to $12,499 | 16 (2.9%) | 30 (8.2%) |
| $12,500 to $14,999 | 18 (3.3%) | 0 (0.0%) |
| $15,000 to $17,499 | 38 (7.0%) | 7 (1.9%) |
| $17,500 to $19,999 | 6 (1.1%) | 32 (8.7%) |
| $20,000 to $22,499 | 25 (4.6%) | 11 (3.0%) |
| $22,500 to $24,999 | 2 (0.4%) | 0 (0.0%) |
| $25,000 to $29,999 | 11 (2.0%) | 9 (2.5%) |
| $30,000 to $34,999 | 18 (3.3%) | 40 (10.9%) |
| $35,000 to $39,999 | 34 (6.3%) | 14 (3.8%) |
| $40,000 to $44,999 | 28 (5.2%) | 21 (5.7%) |
| $45,000 to $49,999 | 34 (6.3%) | 38 (10.4%) |
| $50,000 to $54,999 | 47 (8.7%) | 25 (6.8%) |
| $55,000 to $64,999 | 67 (12.3%) | 18 (4.9%) |
| $65,000 to $74,999 | 44 (8.1%) | 32 (8.7%) |
| $75,000 to $99,999 | 67 (12.3%) | 26 (7.1%) |
| $100,000+ | 46 (8.5%) | 0 (0.0%) |
| Total | 543 (100.0%) | 366 (100.0%) |
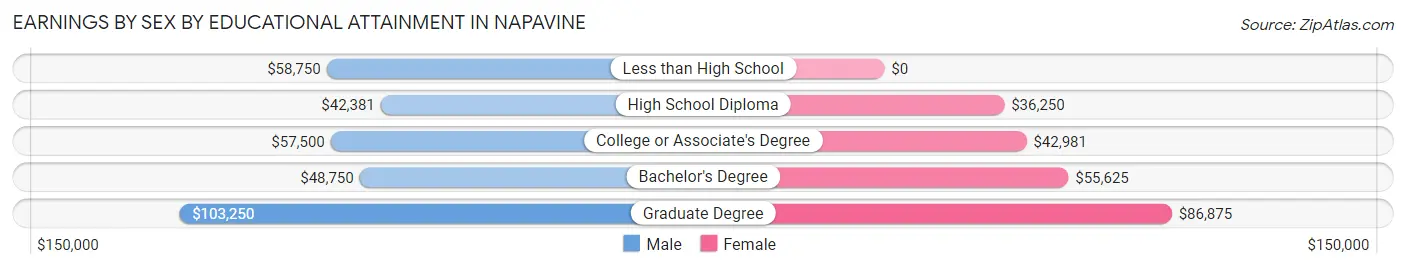
Earnings by Sex by Educational Attainment in Napavine
Average earnings in Napavine are $51,971 for men and $43,984 for women, a difference of 15.4%. Men with an educational attainment of graduate degree enjoy the highest average annual earnings of $103,250, while those with high school diploma education earn the least with $42,381. Women with an educational attainment of graduate degree earn the most with the average annual earnings of $86,875, while those with high school diploma education have the smallest earnings of $36,250.
| Educational Attainment | Male Income | Female Income |
| Less than High School | $58,750 | $0 |
| High School Diploma | $42,381 | $36,250 |
| College or Associate's Degree | $57,500 | $42,981 |
| Bachelor's Degree | $48,750 | $55,625 |
| Graduate Degree | $103,250 | $86,875 |
| Total | $51,971 | $43,984 |
Family Income in Napavine
Family Income Brackets in Napavine
According to the Napavine family income data, there are 168 families falling into the $100,000 to $149,999 income range, which is the most common income bracket and makes up 34.5% of all families.
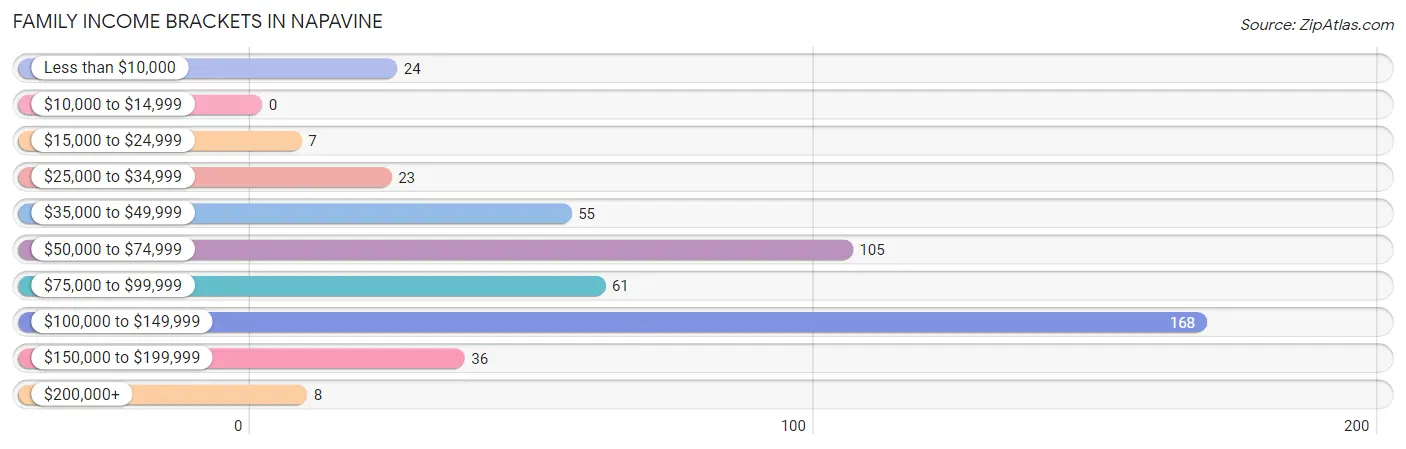
| Income Bracket | # Families | % Families |
| Less than $10,000 | 24 | 4.9% |
| $10,000 to $14,999 | 0 | 0.0% |
| $15,000 to $24,999 | 7 | 1.4% |
| $25,000 to $34,999 | 23 | 4.7% |
| $35,000 to $49,999 | 55 | 11.3% |
| $50,000 to $74,999 | 105 | 21.6% |
| $75,000 to $99,999 | 61 | 12.5% |
| $100,000 to $149,999 | 168 | 34.5% |
| $150,000 to $199,999 | 36 | 7.4% |
| $200,000+ | 8 | 1.6% |
Family Income by Famaliy Size in Napavine
4-person families (73 | 15.0%) account for the highest median family income in Napavine with $112,750 per family, while 2-person families (195 | 40.0%) have the highest median income of $34,716 per family member.
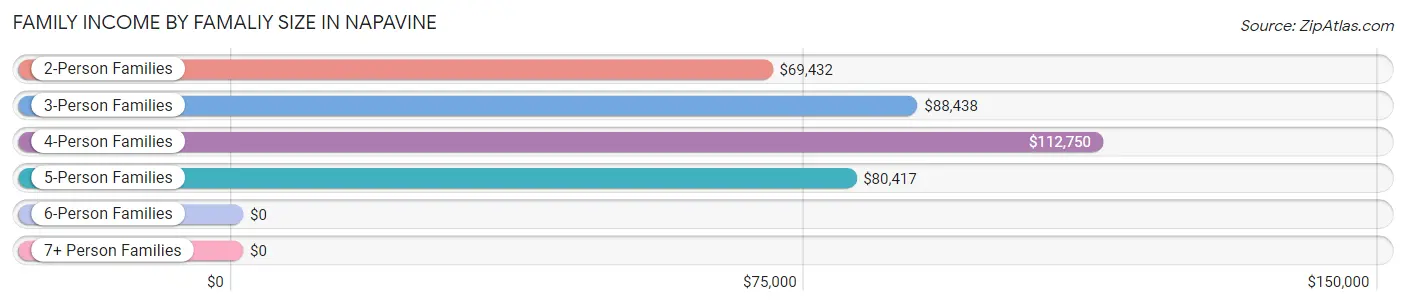
| Income Bracket | # Families | Median Income |
| 2-Person Families | 195 (40.0%) | $69,432 |
| 3-Person Families | 177 (36.3%) | $88,438 |
| 4-Person Families | 73 (15.0%) | $112,750 |
| 5-Person Families | 28 (5.8%) | $80,417 |
| 6-Person Families | 14 (2.9%) | $0 |
| 7+ Person Families | 0 (0.0%) | $0 |
| Total | 487 (100.0%) | $90,729 |
Family Income by Number of Earners in Napavine
The median family income in Napavine is $90,729, with families comprising 3+ earners (55) having the highest median family income of $141,597, while families with no earners (57) have the lowest median family income of $34,375, accounting for 11.3% and 11.7% of families, respectively.
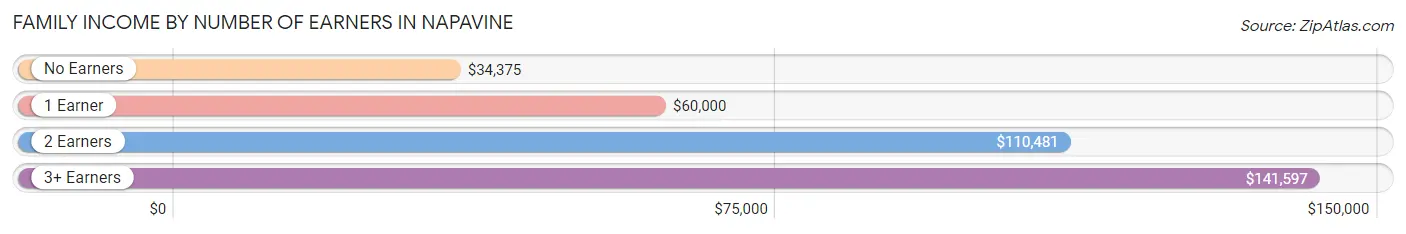
| Number of Earners | # Families | Median Income |
| No Earners | 57 (11.7%) | $34,375 |
| 1 Earner | 150 (30.8%) | $60,000 |
| 2 Earners | 225 (46.2%) | $110,481 |
| 3+ Earners | 55 (11.3%) | $141,597 |
| Total | 487 (100.0%) | $90,729 |
Household Income in Napavine
Household Income Brackets in Napavine
With 195 households falling in the category, the $100,000 to $149,999 income range is the most frequent in Napavine, accounting for 30.4% of all households. In contrast, only 10 households (1.6%) fall into the $10,000 to $14,999 income bracket, making it the least populous group.
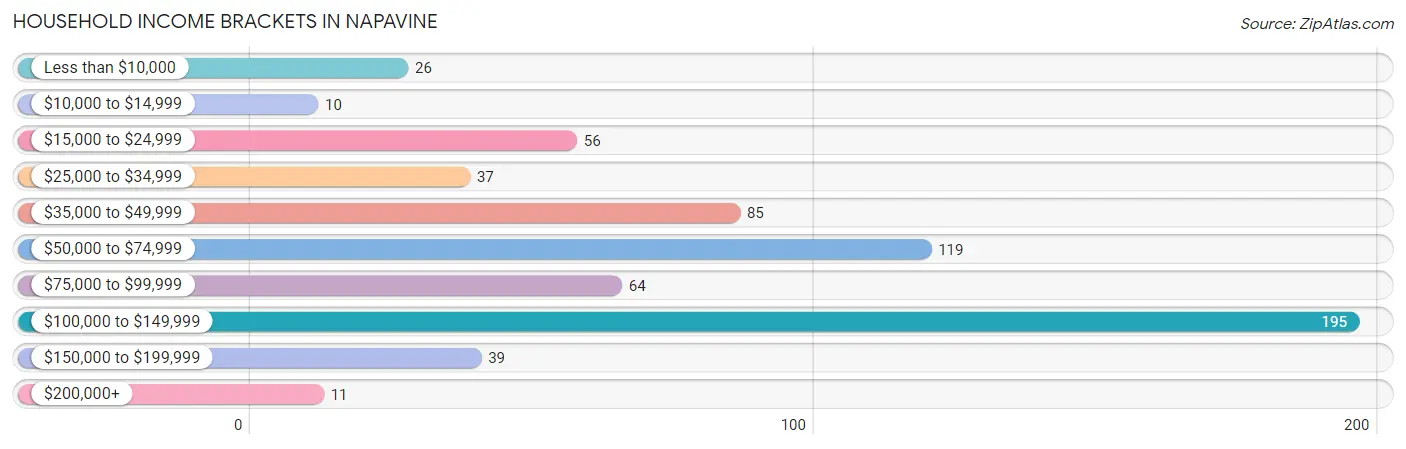
| Income Bracket | # Households | % Households |
| Less than $10,000 | 26 | 4.0% |
| $10,000 to $14,999 | 10 | 1.6% |
| $15,000 to $24,999 | 56 | 8.7% |
| $25,000 to $34,999 | 37 | 5.8% |
| $35,000 to $49,999 | 85 | 13.2% |
| $50,000 to $74,999 | 119 | 18.5% |
| $75,000 to $99,999 | 64 | 10.0% |
| $100,000 to $149,999 | 195 | 30.4% |
| $150,000 to $199,999 | 39 | 6.1% |
| $200,000+ | 11 | 1.7% |
Household Income by Householder Age in Napavine
The median household income in Napavine is $70,833, with the highest median household income of $118,068 found in the 15 to 24 years age bracket for the primary householder. A total of 45 households (7.0%) fall into this category. Meanwhile, the 65+ years age bracket for the primary householder has the lowest median household income of $41,667, with 174 households (27.1%) in this group.
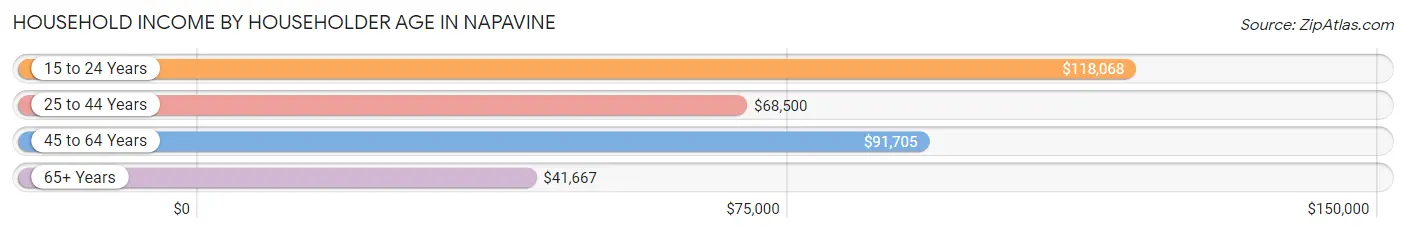
| Income Bracket | # Households | Median Income |
| 15 to 24 Years | 45 (7.0%) | $118,068 |
| 25 to 44 Years | 250 (38.9%) | $68,500 |
| 45 to 64 Years | 173 (27.0%) | $91,705 |
| 65+ Years | 174 (27.1%) | $41,667 |
| Total | 642 (100.0%) | $70,833 |
Poverty in Napavine
Income Below Poverty by Sex and Age in Napavine
With 5.3% poverty level for males and 10.6% for females among the residents of Napavine, 6 to 11 year old males and 12 to 14 year old females are the most vulnerable to poverty, with 12 males (17.4%) and 13 females (34.2%) in their respective age groups living below the poverty level.
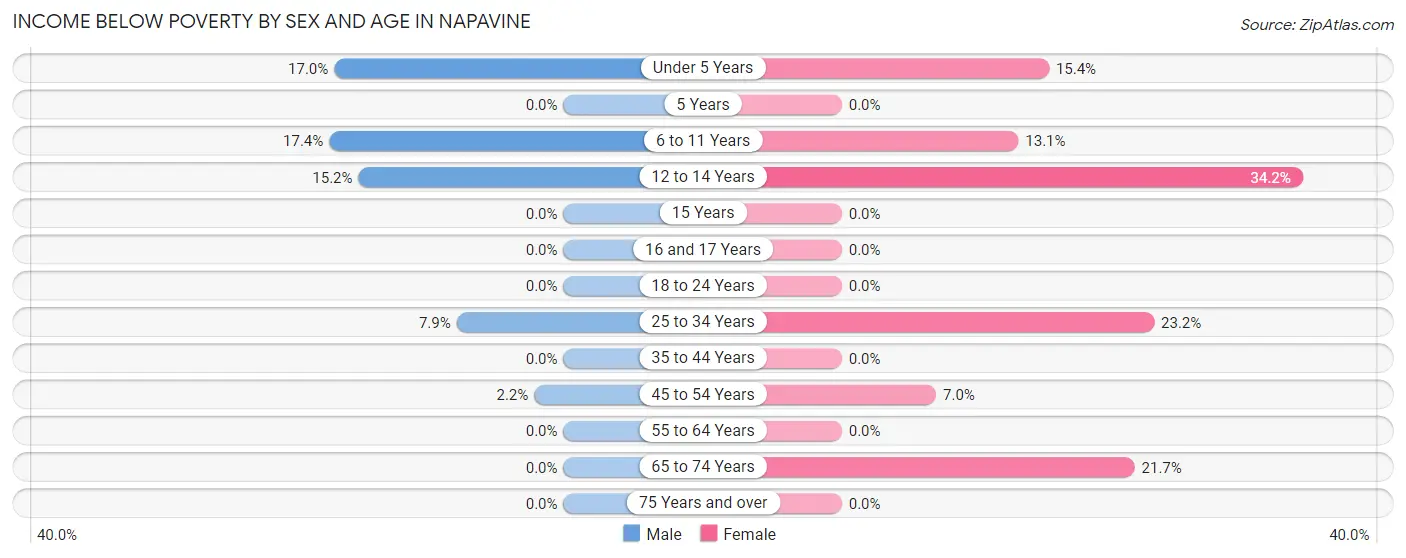
| Age Bracket | Male | Female |
| Under 5 Years | 8 (17.0%) | 6 (15.4%) |
| 5 Years | 0 (0.0%) | 0 (0.0%) |
| 6 to 11 Years | 12 (17.4%) | 8 (13.1%) |
| 12 to 14 Years | 7 (15.2%) | 13 (34.2%) |
| 15 Years | 0 (0.0%) | 0 (0.0%) |
| 16 and 17 Years | 0 (0.0%) | 0 (0.0%) |
| 18 to 24 Years | 0 (0.0%) | 0 (0.0%) |
| 25 to 34 Years | 18 (7.9%) | 32 (23.2%) |
| 35 to 44 Years | 0 (0.0%) | 0 (0.0%) |
| 45 to 54 Years | 2 (2.2%) | 7 (7.0%) |
| 55 to 64 Years | 0 (0.0%) | 0 (0.0%) |
| 65 to 74 Years | 0 (0.0%) | 20 (21.7%) |
| 75 Years and over | 0 (0.0%) | 0 (0.0%) |
| Total | 47 (5.3%) | 86 (10.6%) |
Income Above Poverty by Sex and Age in Napavine
According to the poverty statistics in Napavine, males aged 5 years and females aged 5 years are the age groups that are most secure financially, with 100.0% of males and 100.0% of females in these age groups living above the poverty line.
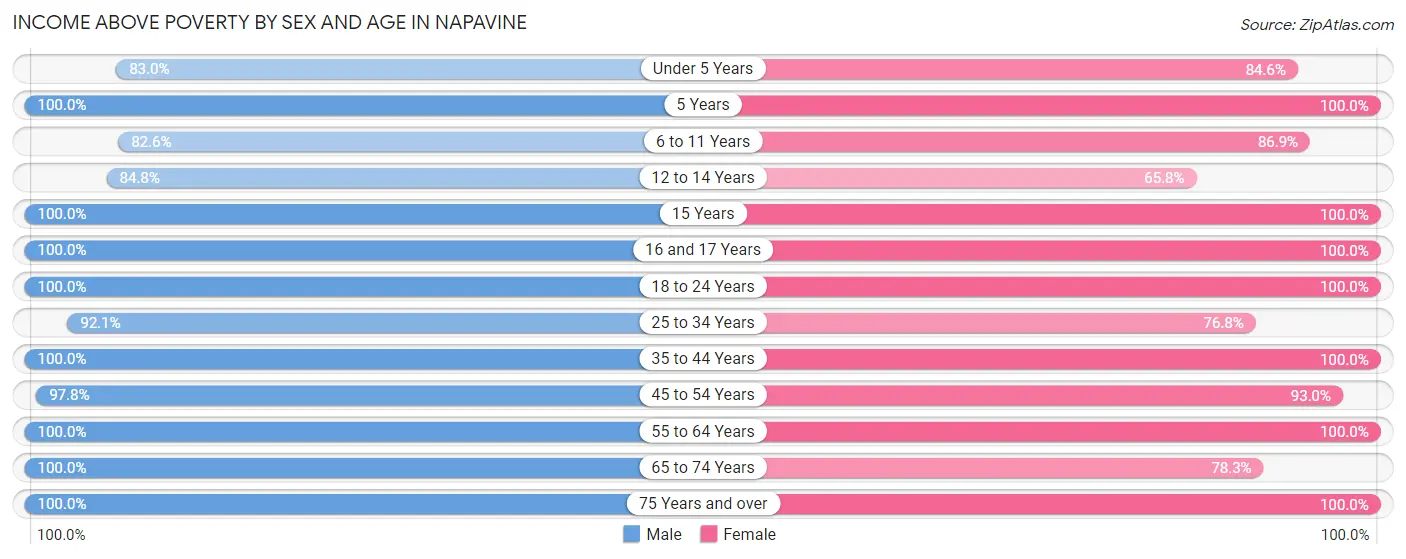
| Age Bracket | Male | Female |
| Under 5 Years | 39 (83.0%) | 33 (84.6%) |
| 5 Years | 12 (100.0%) | 8 (100.0%) |
| 6 to 11 Years | 57 (82.6%) | 53 (86.9%) |
| 12 to 14 Years | 39 (84.8%) | 25 (65.8%) |
| 15 Years | 10 (100.0%) | 6 (100.0%) |
| 16 and 17 Years | 4 (100.0%) | 14 (100.0%) |
| 18 to 24 Years | 75 (100.0%) | 90 (100.0%) |
| 25 to 34 Years | 209 (92.1%) | 106 (76.8%) |
| 35 to 44 Years | 122 (100.0%) | 123 (100.0%) |
| 45 to 54 Years | 90 (97.8%) | 93 (93.0%) |
| 55 to 64 Years | 85 (100.0%) | 49 (100.0%) |
| 65 to 74 Years | 68 (100.0%) | 72 (78.3%) |
| 75 Years and over | 34 (100.0%) | 51 (100.0%) |
| Total | 844 (94.7%) | 723 (89.4%) |
Income Below Poverty Among Married-Couple Families in Napavine
The poverty statistics for married-couple families in Napavine show that 2.2% or 8 of the total 356 families live below the poverty line. Families with 1 or 2 children have the highest poverty rate of 6.1%, comprising of 8 families. On the other hand, families with no children have the lowest poverty rate of 0.0%, which includes 0 families.
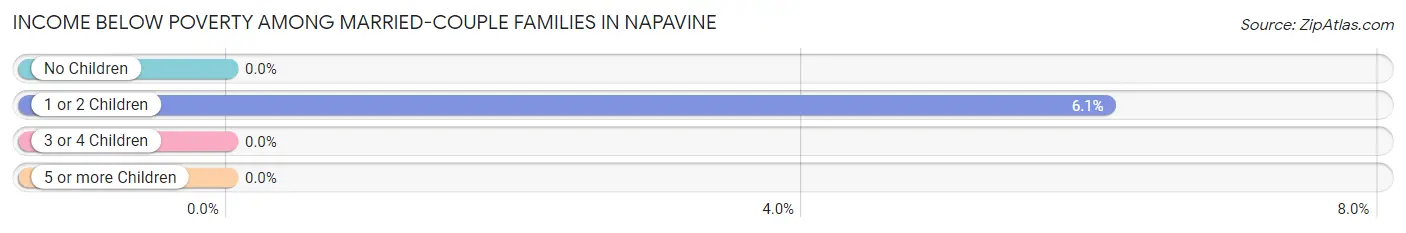
| Children | Above Poverty | Below Poverty |
| No Children | 194 (100.0%) | 0 (0.0%) |
| 1 or 2 Children | 123 (93.9%) | 8 (6.1%) |
| 3 or 4 Children | 31 (100.0%) | 0 (0.0%) |
| 5 or more Children | 0 (0.0%) | 0 (0.0%) |
| Total | 348 (97.8%) | 8 (2.2%) |
Income Below Poverty Among Single-Parent Households in Napavine
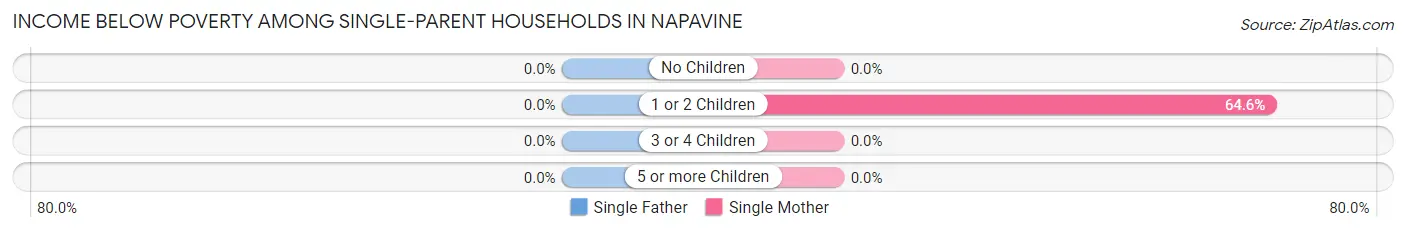
| Children | Single Father | Single Mother |
| No Children | 0 (0.0%) | 0 (0.0%) |
| 1 or 2 Children | 0 (0.0%) | 31 (64.6%) |
| 3 or 4 Children | 0 (0.0%) | 0 (0.0%) |
| 5 or more Children | 0 (0.0%) | 0 (0.0%) |
| Total | 0 (0.0%) | 31 (42.5%) |
Income Below Poverty Among Married-Couple vs Single-Parent Households in Napavine
The poverty data for Napavine shows that 8 of the married-couple family households (2.2%) and 31 of the single-parent households (23.7%) are living below the poverty level. Within the married-couple family households, those with 1 or 2 children have the highest poverty rate, with 8 households (6.1%) falling below the poverty line. Among the single-parent households, those with 1 or 2 children have the highest poverty rate, with 31 household (42.5%) living below poverty.
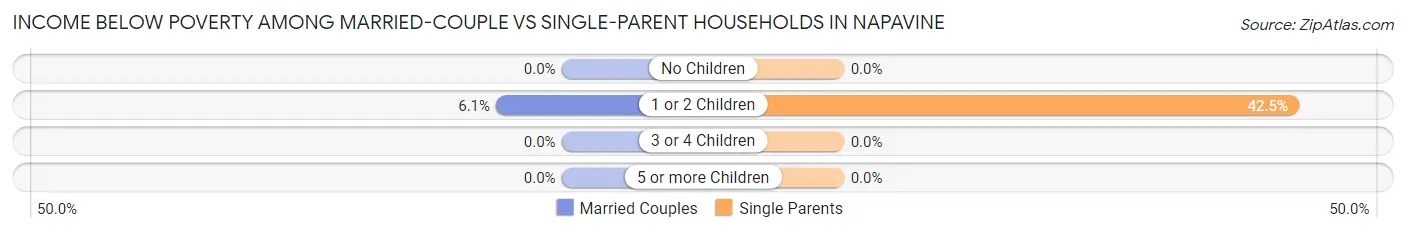
| Children | Married-Couple Families | Single-Parent Households |
| No Children | 0 (0.0%) | 0 (0.0%) |
| 1 or 2 Children | 8 (6.1%) | 31 (42.5%) |
| 3 or 4 Children | 0 (0.0%) | 0 (0.0%) |
| 5 or more Children | 0 (0.0%) | 0 (0.0%) |
| Total | 8 (2.2%) | 31 (23.7%) |
Race in Napavine
The most populous races in Napavine are White / Caucasian (1,504 | 88.5%), Two or more Races (149 | 8.8%), and Hispanic or Latino (65 | 3.8%).
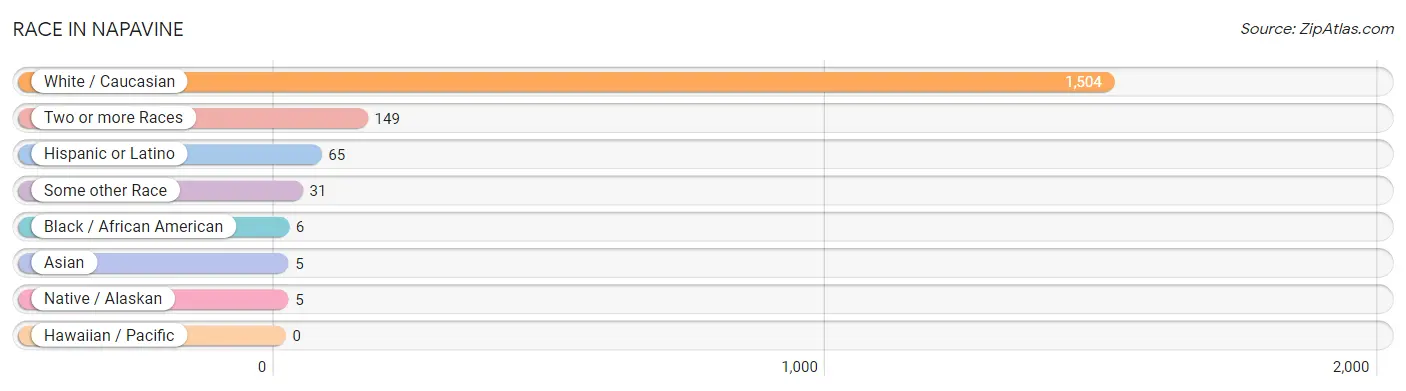
| Race | # Population | % Population |
| Asian | 5 | 0.3% |
| Black / African American | 6 | 0.4% |
| Hawaiian / Pacific | 0 | 0.0% |
| Hispanic or Latino | 65 | 3.8% |
| Native / Alaskan | 5 | 0.3% |
| White / Caucasian | 1,504 | 88.5% |
| Two or more Races | 149 | 8.8% |
| Some other Race | 31 | 1.8% |
| Total | 1,700 | 100.0% |
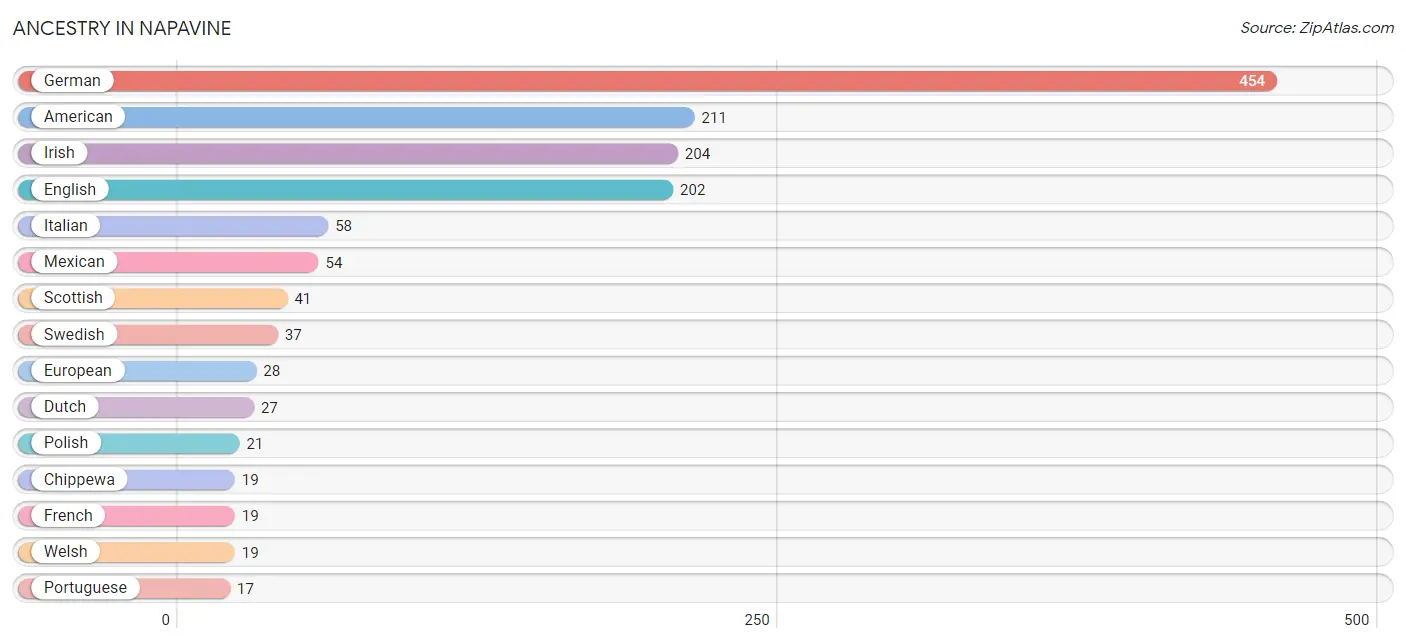
Ancestry in Napavine
The most populous ancestries reported in Napavine are German (454 | 26.7%), American (211 | 12.4%), Irish (204 | 12.0%), English (202 | 11.9%), and Italian (58 | 3.4%), together accounting for 66.4% of all Napavine residents.
| Ancestry | # Population | % Population |
| Alaska Native | 6 | 0.4% |
| American | 211 | 12.4% |
| Arab | 6 | 0.4% |
| Blackfeet | 12 | 0.7% |
| British | 8 | 0.5% |
| Cherokee | 1 | 0.1% |
| Chippewa | 19 | 1.1% |
| Choctaw | 10 | 0.6% |
| Danish | 13 | 0.8% |
| Dutch | 27 | 1.6% |
| Egyptian | 6 | 0.4% |
| English | 202 | 11.9% |
| Ethiopian | 6 | 0.4% |
| European | 28 | 1.7% |
| Finnish | 4 | 0.2% |
| French | 19 | 1.1% |
| French Canadian | 3 | 0.2% |
| German | 454 | 26.7% |
| Greek | 4 | 0.2% |
| Indian (Asian) | 2 | 0.1% |
| Irish | 204 | 12.0% |
| Italian | 58 | 3.4% |
| Korean | 6 | 0.4% |
| Mexican | 54 | 3.2% |
| Norwegian | 15 | 0.9% |
| Pakistani | 4 | 0.2% |
| Polish | 21 | 1.2% |
| Portuguese | 17 | 1.0% |
| Potawatomi | 2 | 0.1% |
| Puget Sound Salish | 15 | 0.9% |
| Romanian | 2 | 0.1% |
| Russian | 13 | 0.8% |
| Scotch-Irish | 7 | 0.4% |
| Scottish | 41 | 2.4% |
| Spaniard | 11 | 0.6% |
| Subsaharan African | 6 | 0.4% |
| Swedish | 37 | 2.2% |
| Welsh | 19 | 1.1% |
| Yakama | 6 | 0.4% | View All 39 Rows |
Immigrants in Napavine
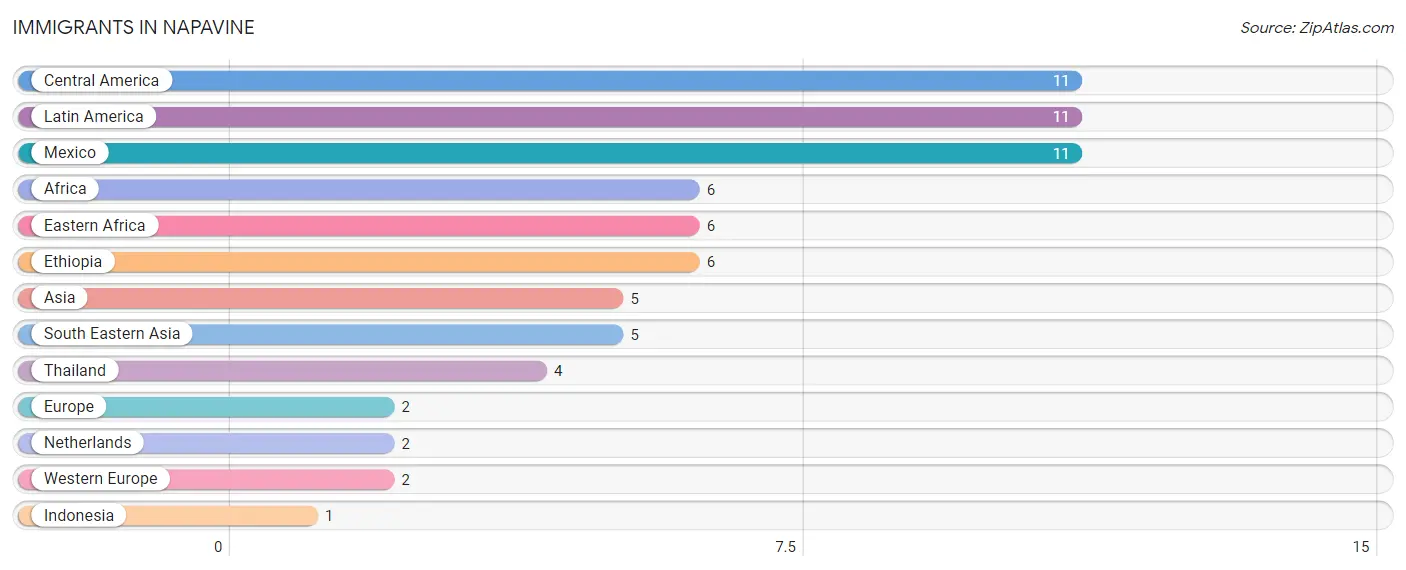
The most numerous immigrant groups reported in Napavine came from Central America (11 | 0.6%), Latin America (11 | 0.6%), Mexico (11 | 0.6%), Africa (6 | 0.4%), and Eastern Africa (6 | 0.4%), together accounting for 2.6% of all Napavine residents.
| Immigration Origin | # Population | % Population |
| Africa | 6 | 0.4% |
| Asia | 5 | 0.3% |
| Central America | 11 | 0.6% |
| Eastern Africa | 6 | 0.4% |
| Ethiopia | 6 | 0.4% |
| Europe | 2 | 0.1% |
| Indonesia | 1 | 0.1% |
| Latin America | 11 | 0.6% |
| Mexico | 11 | 0.6% |
| Netherlands | 2 | 0.1% |
| South Eastern Asia | 5 | 0.3% |
| Thailand | 4 | 0.2% |
| Western Europe | 2 | 0.1% | View All 13 Rows |
Sex and Age in Napavine
Sex and Age in Napavine
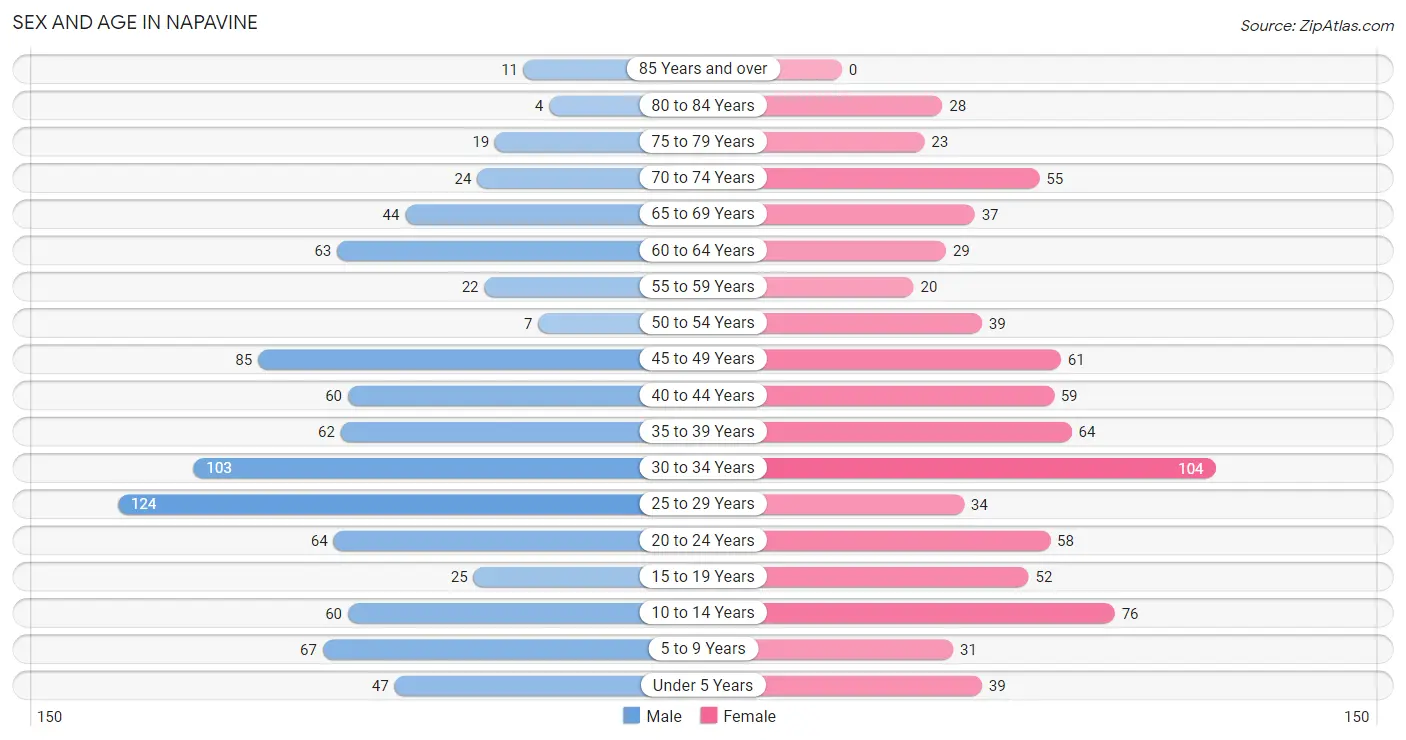
The most populous age groups in Napavine are 25 to 29 Years (124 | 13.9%) for men and 30 to 34 Years (104 | 12.9%) for women.
| Age Bracket | Male | Female |
| Under 5 Years | 47 (5.3%) | 39 (4.8%) |
| 5 to 9 Years | 67 (7.5%) | 31 (3.8%) |
| 10 to 14 Years | 60 (6.7%) | 76 (9.4%) |
| 15 to 19 Years | 25 (2.8%) | 52 (6.4%) |
| 20 to 24 Years | 64 (7.2%) | 58 (7.2%) |
| 25 to 29 Years | 124 (13.9%) | 34 (4.2%) |
| 30 to 34 Years | 103 (11.6%) | 104 (12.9%) |
| 35 to 39 Years | 62 (7.0%) | 64 (7.9%) |
| 40 to 44 Years | 60 (6.7%) | 59 (7.3%) |
| 45 to 49 Years | 85 (9.5%) | 61 (7.5%) |
| 50 to 54 Years | 7 (0.8%) | 39 (4.8%) |
| 55 to 59 Years | 22 (2.5%) | 20 (2.5%) |
| 60 to 64 Years | 63 (7.1%) | 29 (3.6%) |
| 65 to 69 Years | 44 (4.9%) | 37 (4.6%) |
| 70 to 74 Years | 24 (2.7%) | 55 (6.8%) |
| 75 to 79 Years | 19 (2.1%) | 23 (2.8%) |
| 80 to 84 Years | 4 (0.4%) | 28 (3.5%) |
| 85 Years and over | 11 (1.2%) | 0 (0.0%) |
| Total | 891 (100.0%) | 809 (100.0%) |
Families and Households in Napavine
Median Family Size in Napavine
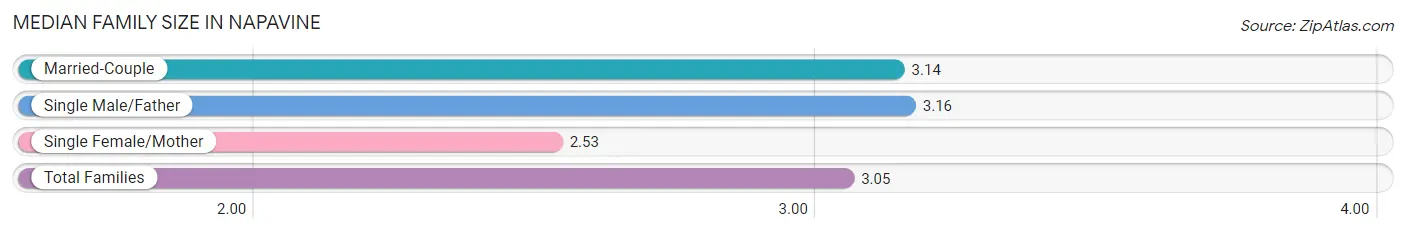
The median family size in Napavine is 3.05 persons per family, with single male/father families (58 | 11.9%) accounting for the largest median family size of 3.16 persons per family. On the other hand, single female/mother families (73 | 15.0%) represent the smallest median family size with 2.53 persons per family.
| Family Type | # Families | Family Size |
| Married-Couple | 356 (73.1%) | 3.14 |
| Single Male/Father | 58 (11.9%) | 3.16 |
| Single Female/Mother | 73 (15.0%) | 2.53 |
| Total Families | 487 (100.0%) | 3.05 |
Median Household Size in Napavine
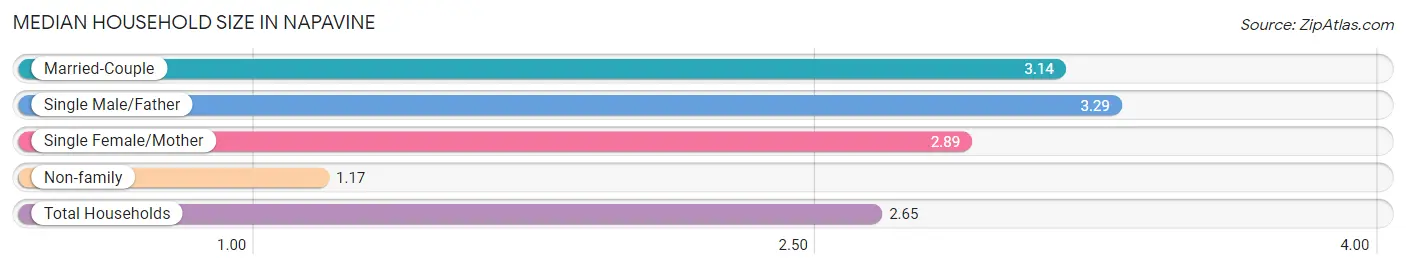
The median household size in Napavine is 2.65 persons per household, with single male/father households (58 | 9.0%) accounting for the largest median household size of 3.29 persons per household. non-family households (155 | 24.1%) represent the smallest median household size with 1.17 persons per household.
| Household Type | # Households | Household Size |
| Married-Couple | 356 (55.4%) | 3.14 |
| Single Male/Father | 58 (9.0%) | 3.29 |
| Single Female/Mother | 73 (11.4%) | 2.89 |
| Non-family | 155 (24.1%) | 1.17 |
| Total Households | 642 (100.0%) | 2.65 |
Household Size by Marriage Status in Napavine
Out of a total of 642 households in Napavine, 487 (75.9%) are family households, while 155 (24.1%) are nonfamily households. The most numerous type of family households are 2-person households, comprising 185, and the most common type of nonfamily households are 1-person households, comprising 120.
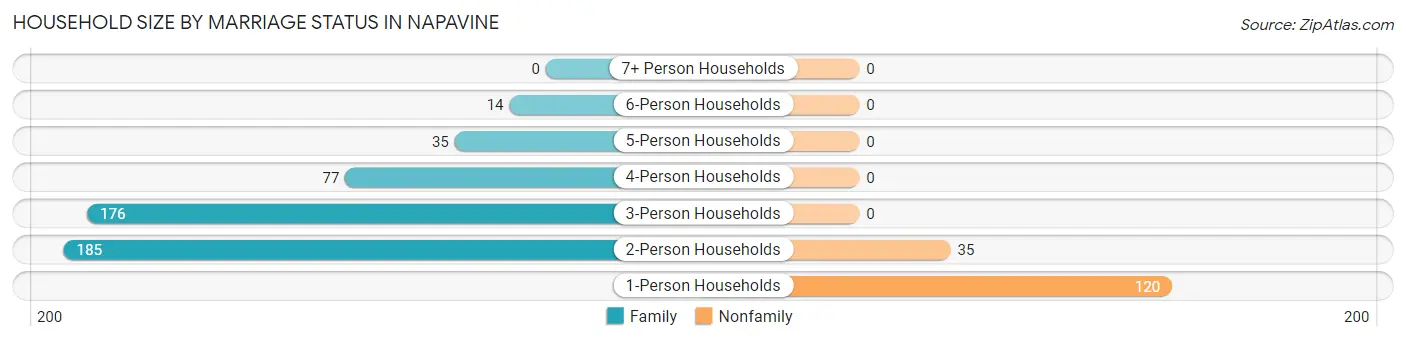
| Household Size | Family Households | Nonfamily Households |
| 1-Person Households | - | 120 (18.7%) |
| 2-Person Households | 185 (28.8%) | 35 (5.4%) |
| 3-Person Households | 176 (27.4%) | 0 (0.0%) |
| 4-Person Households | 77 (12.0%) | 0 (0.0%) |
| 5-Person Households | 35 (5.4%) | 0 (0.0%) |
| 6-Person Households | 14 (2.2%) | 0 (0.0%) |
| 7+ Person Households | 0 (0.0%) | 0 (0.0%) |
| Total | 487 (75.9%) | 155 (24.1%) |
Female Fertility in Napavine
Fertility by Age in Napavine
Average fertility rate in Napavine is 47.0 births per 1,000 women. Women in the age bracket of 20 to 34 years have the highest fertility rate with 107.0 births per 1,000 women. Women in the age bracket of 20 to 34 years acount for 100.0% of all women with births.
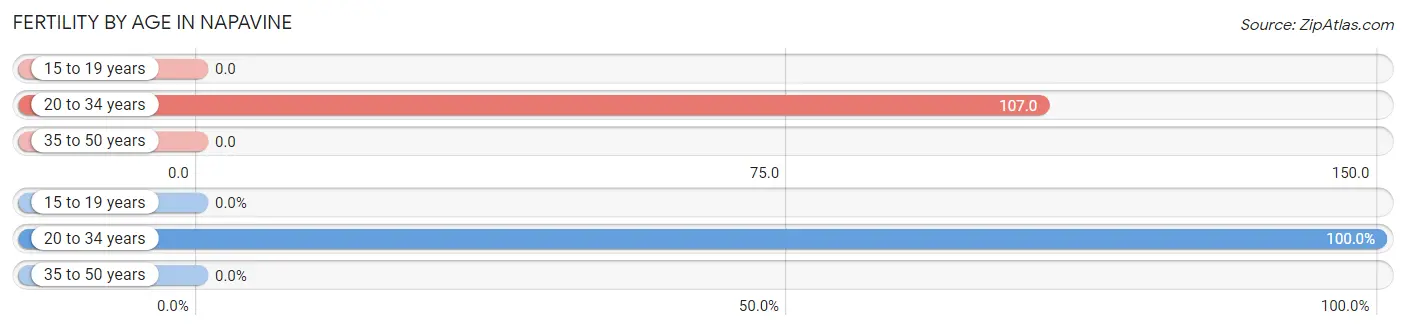
| Age Bracket | Women with Births | Births / 1,000 Women |
| 15 to 19 years | 0 (0.0%) | 0.0 |
| 20 to 34 years | 21 (100.0%) | 107.0 |
| 35 to 50 years | 0 (0.0%) | 0.0 |
| Total | 21 (100.0%) | 47.0 |
Fertility by Age by Marriage Status in Napavine
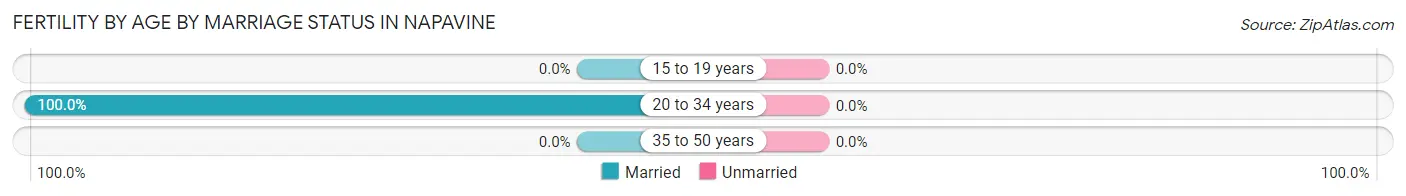
| Age Bracket | Married | Unmarried |
| 15 to 19 years | 0 (0.0%) | 0 (0.0%) |
| 20 to 34 years | 21 (100.0%) | 0 (0.0%) |
| 35 to 50 years | 0 (0.0%) | 0 (0.0%) |
| Total | 21 (100.0%) | 0 (0.0%) |
Fertility by Education in Napavine
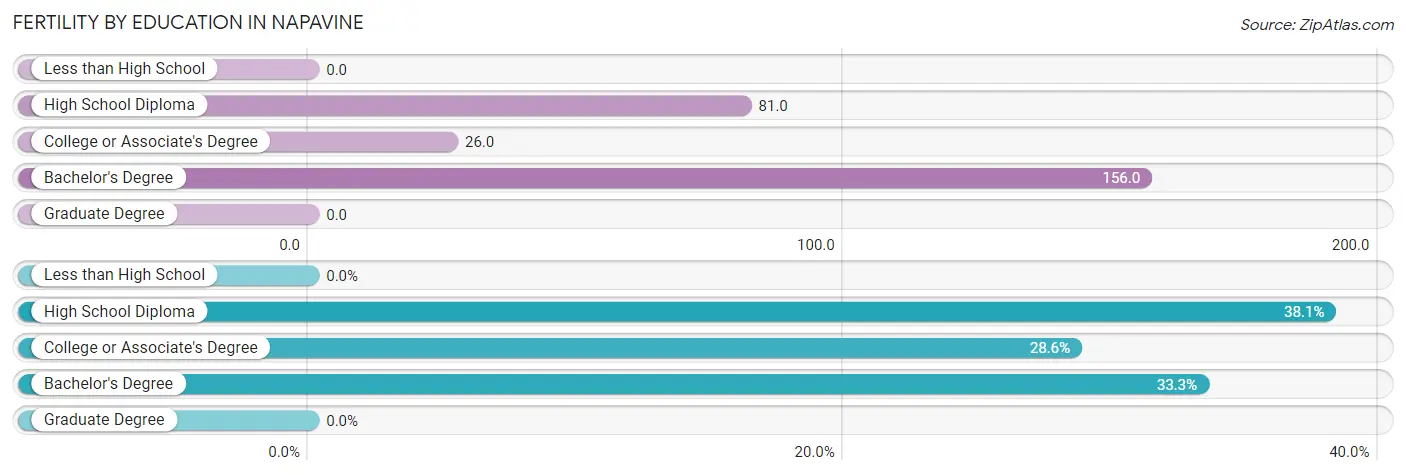
| Educational Attainment | Women with Births | Births / 1,000 Women |
| Less than High School | 0 (0.0%) | 0.0 |
| High School Diploma | 8 (38.1%) | 81.0 |
| College or Associate's Degree | 6 (28.6%) | 26.0 |
| Bachelor's Degree | 7 (33.3%) | 156.0 |
| Graduate Degree | 0 (0.0%) | 0.0 |
| Total | 21 (100.0%) | 47.0 |
Fertility by Education by Marriage Status in Napavine

| Educational Attainment | Married | Unmarried |
| Less than High School | 0 (0.0%) | 0 (0.0%) |
| High School Diploma | 8 (100.0%) | 0 (0.0%) |
| College or Associate's Degree | 6 (100.0%) | 0 (0.0%) |
| Bachelor's Degree | 7 (100.0%) | 0 (0.0%) |
| Graduate Degree | 0 (0.0%) | 0 (0.0%) |
| Total | 21 (100.0%) | 0 (0.0%) |
Employment Characteristics in Napavine
Employment by Class of Employer in Napavine
Among the 783 employed individuals in Napavine, private company employees (562 | 71.8%), state government employees (99 | 12.6%), and local government employees (47 | 6.0%) make up the most common classes of employment.
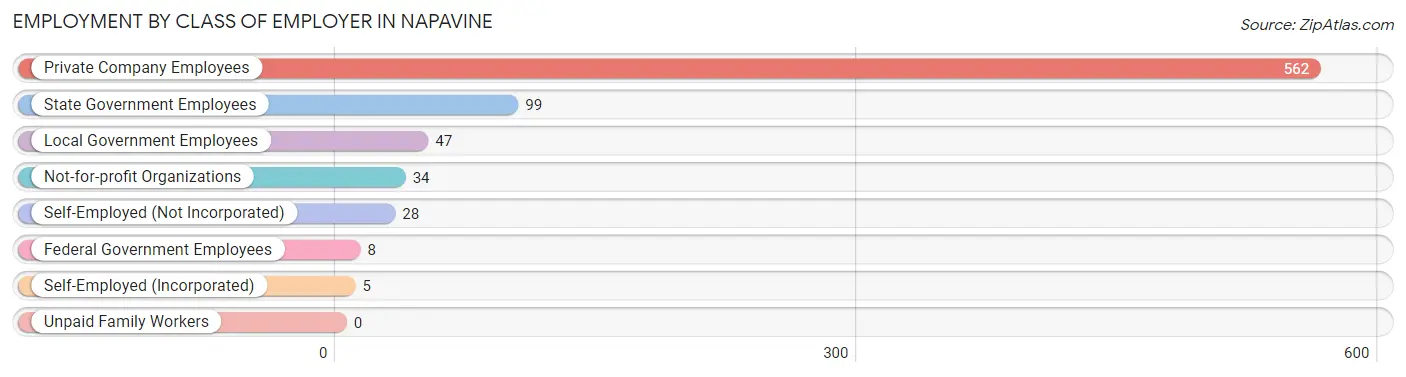
| Employer Class | # Employees | % Employees |
| Private Company Employees | 562 | 71.8% |
| Self-Employed (Incorporated) | 5 | 0.6% |
| Self-Employed (Not Incorporated) | 28 | 3.6% |
| Not-for-profit Organizations | 34 | 4.3% |
| Local Government Employees | 47 | 6.0% |
| State Government Employees | 99 | 12.6% |
| Federal Government Employees | 8 | 1.0% |
| Unpaid Family Workers | 0 | 0.0% |
| Total | 783 | 100.0% |
Employment Status by Age in Napavine
According to the labor force statistics for Napavine, out of the total population over 16 years of age (1,364), 63.7% or 869 individuals are in the labor force, with 7.2% or 63 of them unemployed. The age group with the highest labor force participation rate is 55 to 59 years, with 88.1% or 37 individuals in the labor force. Within the labor force, the 60 to 64 years age range has the highest percentage of unemployed individuals, with 26.7% or 12 of them being unemployed.
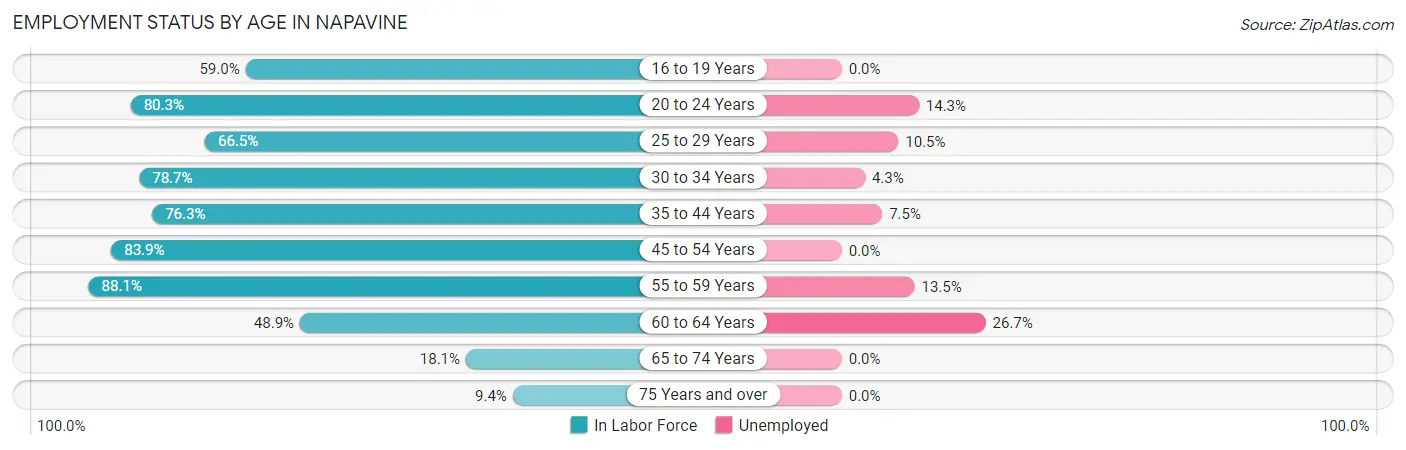
| Age Bracket | In Labor Force | Unemployed |
| 16 to 19 Years | 36 (59.0%) | 0 (0.0%) |
| 20 to 24 Years | 98 (80.3%) | 14 (14.3%) |
| 25 to 29 Years | 105 (66.5%) | 11 (10.5%) |
| 30 to 34 Years | 163 (78.7%) | 7 (4.3%) |
| 35 to 44 Years | 187 (76.3%) | 14 (7.5%) |
| 45 to 54 Years | 161 (83.9%) | 0 (0.0%) |
| 55 to 59 Years | 37 (88.1%) | 5 (13.5%) |
| 60 to 64 Years | 45 (48.9%) | 12 (26.7%) |
| 65 to 74 Years | 29 (18.1%) | 0 (0.0%) |
| 75 Years and over | 8 (9.4%) | 0 (0.0%) |
| Total | 869 (63.7%) | 63 (7.2%) |
Employment Status by Educational Attainment in Napavine
According to labor force statistics for Napavine, 74.6% of individuals (698) out of the total population between 25 and 64 years of age (936) are in the labor force, with 7.0% or 49 of them being unemployed. The group with the highest labor force participation rate are those with the educational attainment of bachelor's degree or higher, with 80.0% or 80 individuals in the labor force. Within the labor force, individuals with high school diploma education have the highest percentage of unemployment, with 11.2% or 29 of them being unemployed.
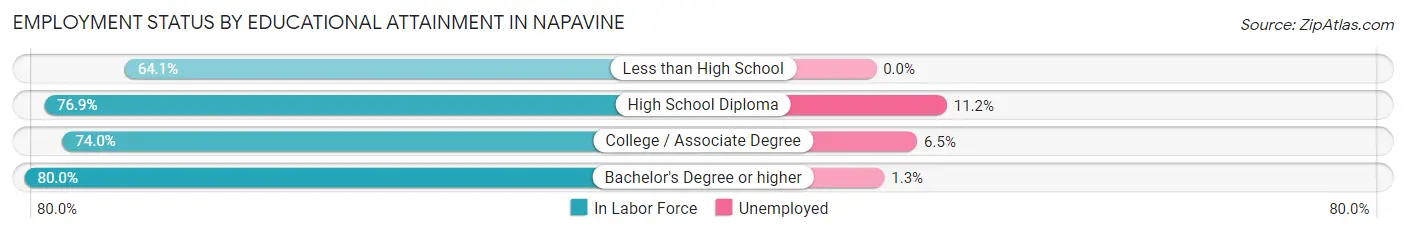
| Educational Attainment | In Labor Force | Unemployed |
| Less than High School | 66 (64.1%) | 0 (0.0%) |
| High School Diploma | 259 (76.9%) | 38 (11.2%) |
| College / Associate Degree | 293 (74.0%) | 26 (6.5%) |
| Bachelor's Degree or higher | 80 (80.0%) | 1 (1.3%) |
| Total | 698 (74.6%) | 66 (7.0%) |
Employment Occupations by Sex in Napavine
Management, Business, Science and Arts Occupations
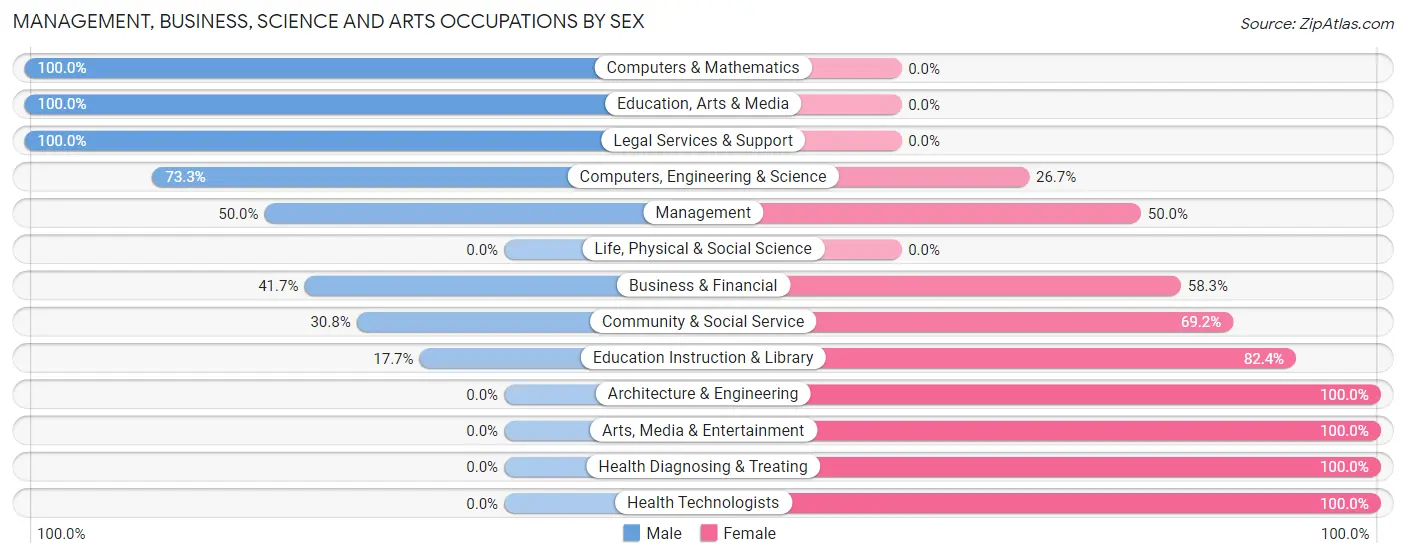
The most common Management, Business, Science and Arts occupations in Napavine are Community & Social Service (52 | 6.5%), Management (48 | 6.0%), Health Diagnosing & Treating (47 | 5.8%), Education Instruction & Library (34 | 4.2%), and Health Technologists (19 | 2.4%).
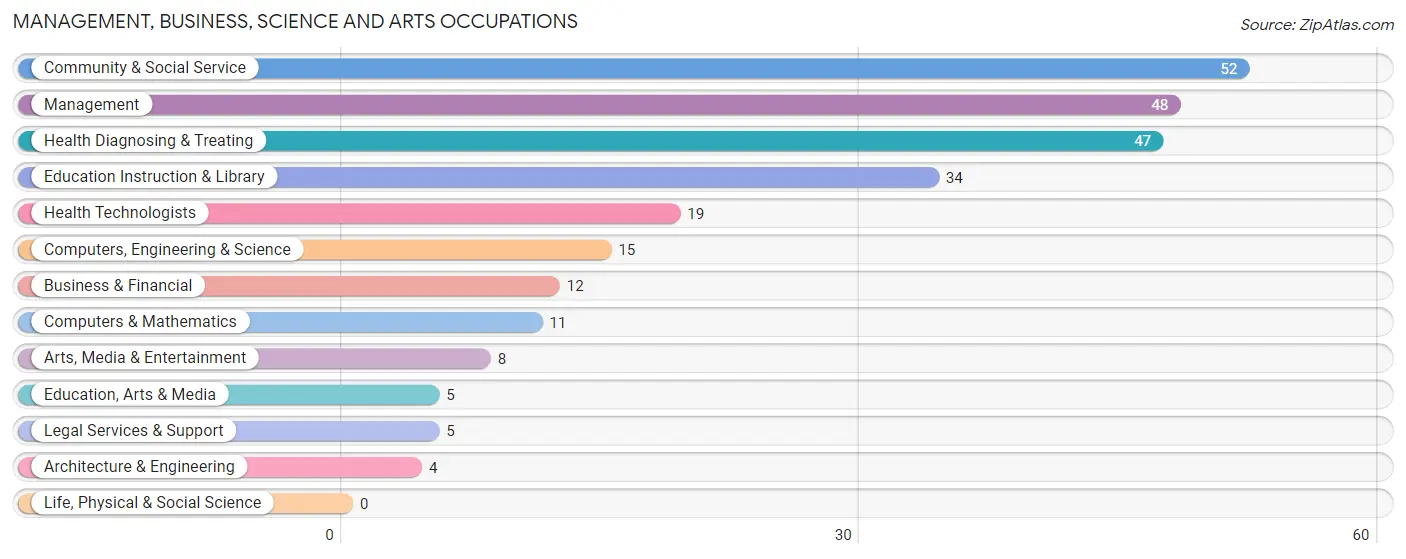
Management, Business, Science and Arts Occupations by Sex
Within the Management, Business, Science and Arts occupations in Napavine, the most male-oriented occupations are Computers & Mathematics (100.0%), Education, Arts & Media (100.0%), and Legal Services & Support (100.0%), while the most female-oriented occupations are Architecture & Engineering (100.0%), Arts, Media & Entertainment (100.0%), and Health Diagnosing & Treating (100.0%).
| Occupation | Male | Female |
| Management | 24 (50.0%) | 24 (50.0%) |
| Business & Financial | 5 (41.7%) | 7 (58.3%) |
| Computers, Engineering & Science | 11 (73.3%) | 4 (26.7%) |
| Computers & Mathematics | 11 (100.0%) | 0 (0.0%) |
| Architecture & Engineering | 0 (0.0%) | 4 (100.0%) |
| Life, Physical & Social Science | 0 (0.0%) | 0 (0.0%) |
| Community & Social Service | 16 (30.8%) | 36 (69.2%) |
| Education, Arts & Media | 5 (100.0%) | 0 (0.0%) |
| Legal Services & Support | 5 (100.0%) | 0 (0.0%) |
| Education Instruction & Library | 6 (17.6%) | 28 (82.4%) |
| Arts, Media & Entertainment | 0 (0.0%) | 8 (100.0%) |
| Health Diagnosing & Treating | 0 (0.0%) | 47 (100.0%) |
| Health Technologists | 0 (0.0%) | 19 (100.0%) |
| Total (Category) | 56 (32.2%) | 118 (67.8%) |
| Total (Overall) | 469 (58.2%) | 337 (41.8%) |
Services Occupations
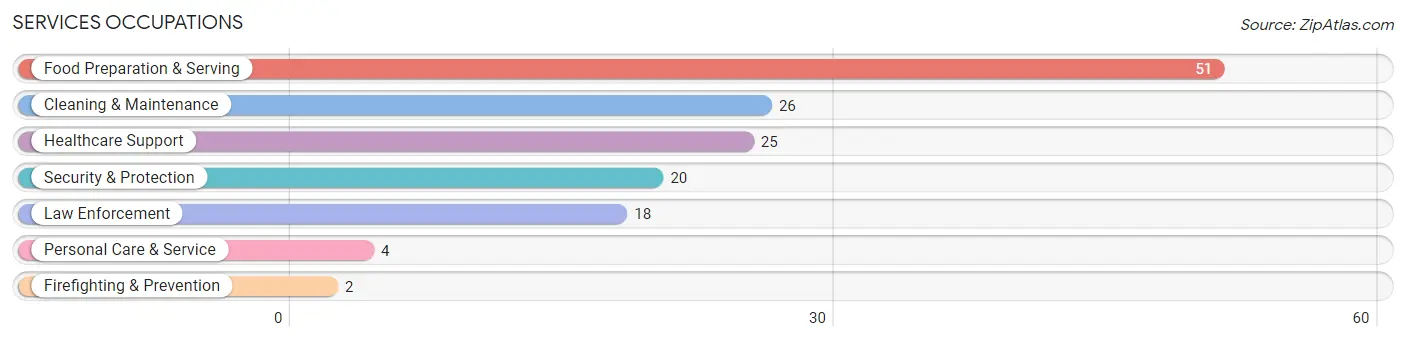
The most common Services occupations in Napavine are Food Preparation & Serving (51 | 6.3%), Cleaning & Maintenance (26 | 3.2%), Healthcare Support (25 | 3.1%), Security & Protection (20 | 2.5%), and Law Enforcement (18 | 2.2%).
Services Occupations by Sex
Within the Services occupations in Napavine, the most male-oriented occupations are Security & Protection (100.0%), Firefighting & Prevention (100.0%), and Law Enforcement (100.0%), while the most female-oriented occupations are Healthcare Support (100.0%), Personal Care & Service (100.0%), and Food Preparation & Serving (51.0%).
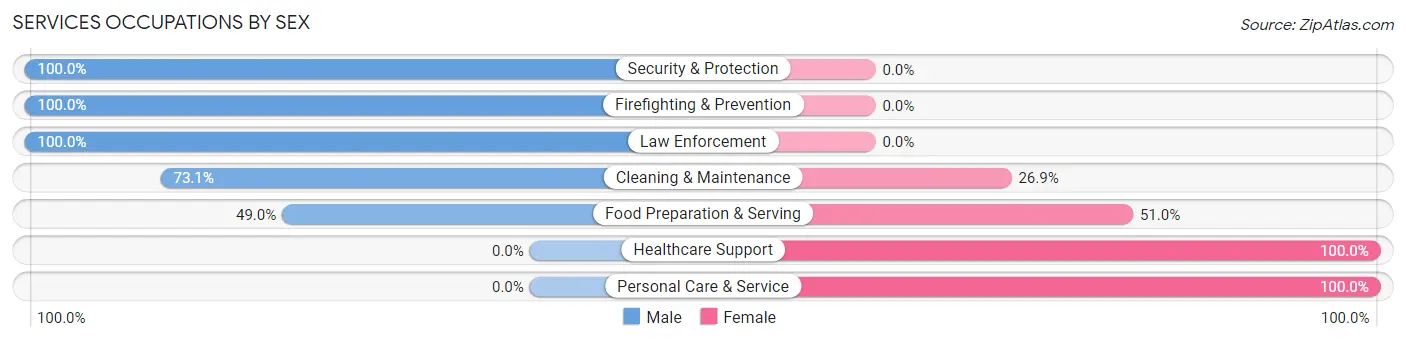
| Occupation | Male | Female |
| Healthcare Support | 0 (0.0%) | 25 (100.0%) |
| Security & Protection | 20 (100.0%) | 0 (0.0%) |
| Firefighting & Prevention | 2 (100.0%) | 0 (0.0%) |
| Law Enforcement | 18 (100.0%) | 0 (0.0%) |
| Food Preparation & Serving | 25 (49.0%) | 26 (51.0%) |
| Cleaning & Maintenance | 19 (73.1%) | 7 (26.9%) |
| Personal Care & Service | 0 (0.0%) | 4 (100.0%) |
| Total (Category) | 64 (50.8%) | 62 (49.2%) |
| Total (Overall) | 469 (58.2%) | 337 (41.8%) |
Sales and Office Occupations
The most common Sales and Office occupations in Napavine are Office & Administration (154 | 19.1%), and Sales & Related (42 | 5.2%).

Sales and Office Occupations by Sex

| Occupation | Male | Female |
| Sales & Related | 25 (59.5%) | 17 (40.5%) |
| Office & Administration | 25 (16.2%) | 129 (83.8%) |
| Total (Category) | 50 (25.5%) | 146 (74.5%) |
| Total (Overall) | 469 (58.2%) | 337 (41.8%) |
Natural Resources, Construction and Maintenance Occupations
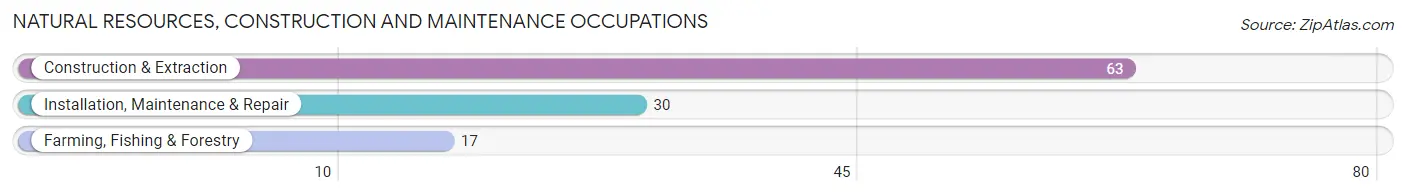
The most common Natural Resources, Construction and Maintenance occupations in Napavine are Construction & Extraction (63 | 7.8%), Installation, Maintenance & Repair (30 | 3.7%), and Farming, Fishing & Forestry (17 | 2.1%).
Natural Resources, Construction and Maintenance Occupations by Sex
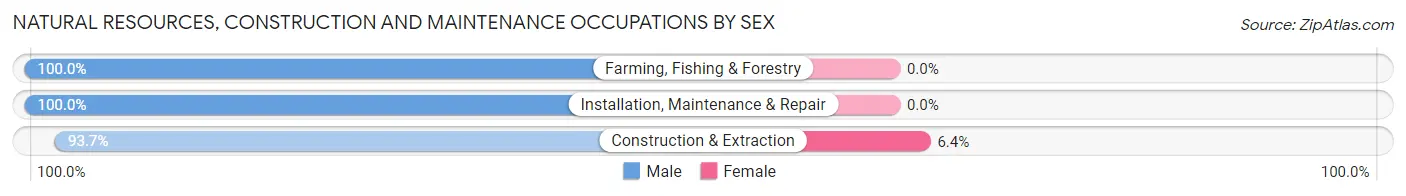
| Occupation | Male | Female |
| Farming, Fishing & Forestry | 17 (100.0%) | 0 (0.0%) |
| Construction & Extraction | 59 (93.6%) | 4 (6.4%) |
| Installation, Maintenance & Repair | 30 (100.0%) | 0 (0.0%) |
| Total (Category) | 106 (96.4%) | 4 (3.6%) |
| Total (Overall) | 469 (58.2%) | 337 (41.8%) |
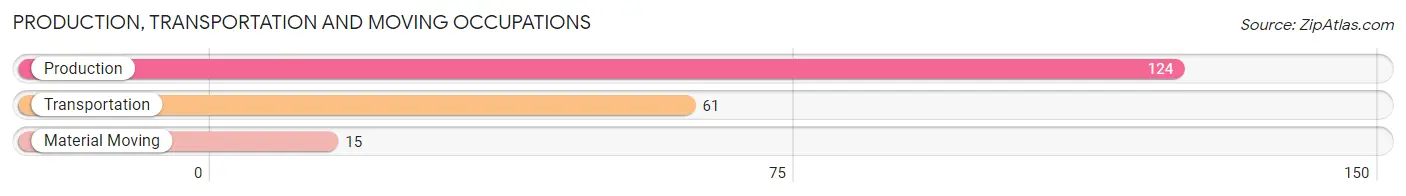
Production, Transportation and Moving Occupations
The most common Production, Transportation and Moving occupations in Napavine are Production (124 | 15.4%), Transportation (61 | 7.6%), and Material Moving (15 | 1.9%).
Production, Transportation and Moving Occupations by Sex
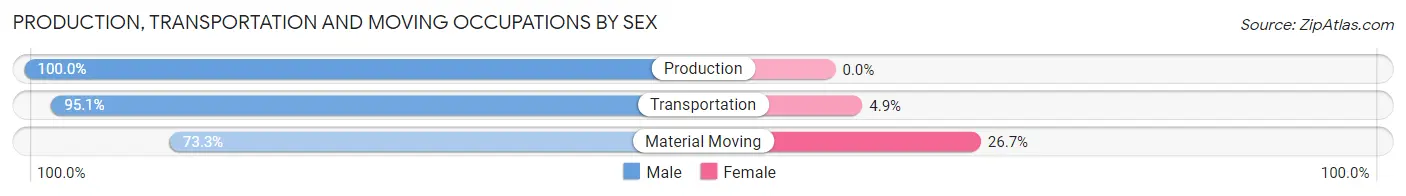
| Occupation | Male | Female |
| Production | 124 (100.0%) | 0 (0.0%) |
| Transportation | 58 (95.1%) | 3 (4.9%) |
| Material Moving | 11 (73.3%) | 4 (26.7%) |
| Total (Category) | 193 (96.5%) | 7 (3.5%) |
| Total (Overall) | 469 (58.2%) | 337 (41.8%) |
Employment Industries by Sex in Napavine
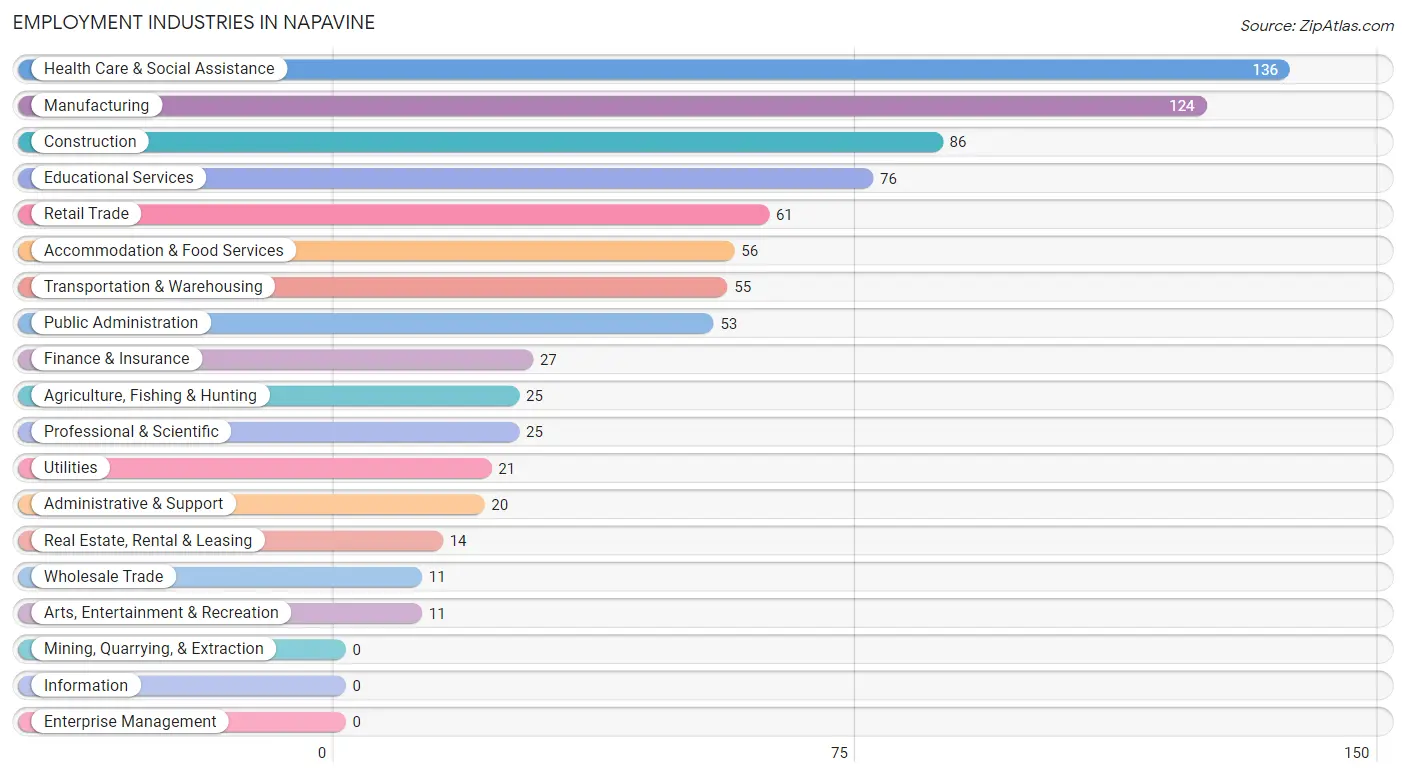
Employment Industries in Napavine
The major employment industries in Napavine include Health Care & Social Assistance (136 | 16.9%), Manufacturing (124 | 15.4%), Construction (86 | 10.7%), Educational Services (76 | 9.4%), and Retail Trade (61 | 7.6%).
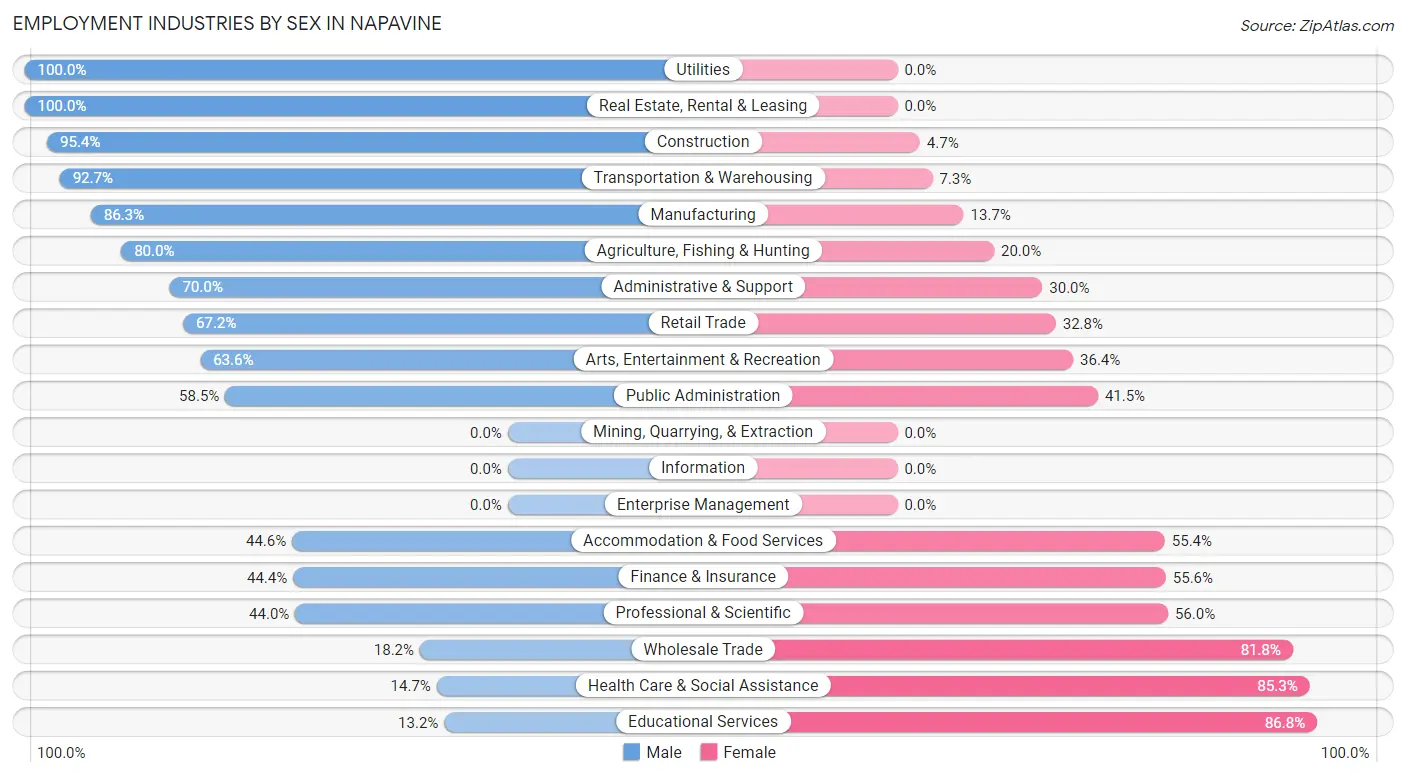
Employment Industries by Sex in Napavine
The Napavine industries that see more men than women are Utilities (100.0%), Real Estate, Rental & Leasing (100.0%), and Construction (95.4%), whereas the industries that tend to have a higher number of women are Educational Services (86.8%), Health Care & Social Assistance (85.3%), and Wholesale Trade (81.8%).
| Industry | Male | Female |
| Agriculture, Fishing & Hunting | 20 (80.0%) | 5 (20.0%) |
| Mining, Quarrying, & Extraction | 0 (0.0%) | 0 (0.0%) |
| Construction | 82 (95.4%) | 4 (4.6%) |
| Manufacturing | 107 (86.3%) | 17 (13.7%) |
| Wholesale Trade | 2 (18.2%) | 9 (81.8%) |
| Retail Trade | 41 (67.2%) | 20 (32.8%) |
| Transportation & Warehousing | 51 (92.7%) | 4 (7.3%) |
| Utilities | 21 (100.0%) | 0 (0.0%) |
| Information | 0 (0.0%) | 0 (0.0%) |
| Finance & Insurance | 12 (44.4%) | 15 (55.6%) |
| Real Estate, Rental & Leasing | 14 (100.0%) | 0 (0.0%) |
| Professional & Scientific | 11 (44.0%) | 14 (56.0%) |
| Enterprise Management | 0 (0.0%) | 0 (0.0%) |
| Administrative & Support | 14 (70.0%) | 6 (30.0%) |
| Educational Services | 10 (13.2%) | 66 (86.8%) |
| Health Care & Social Assistance | 20 (14.7%) | 116 (85.3%) |
| Arts, Entertainment & Recreation | 7 (63.6%) | 4 (36.4%) |
| Accommodation & Food Services | 25 (44.6%) | 31 (55.4%) |
| Public Administration | 31 (58.5%) | 22 (41.5%) |
| Total | 469 (58.2%) | 337 (41.8%) |
Education in Napavine
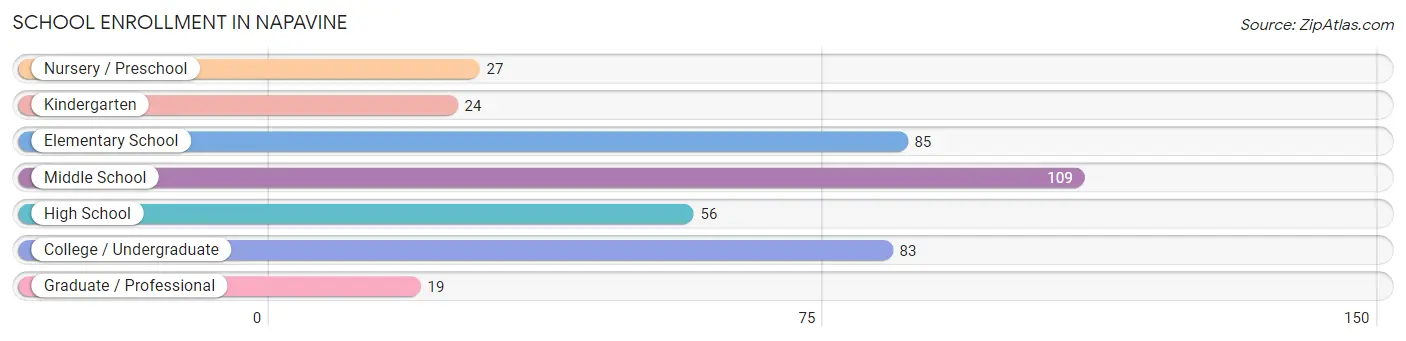
School Enrollment in Napavine
The most common levels of schooling among the 403 students in Napavine are middle school (109 | 27.1%), elementary school (85 | 21.1%), and college / undergraduate (83 | 20.6%).
| School Level | # Students | % Students |
| Nursery / Preschool | 27 | 6.7% |
| Kindergarten | 24 | 6.0% |
| Elementary School | 85 | 21.1% |
| Middle School | 109 | 27.1% |
| High School | 56 | 13.9% |
| College / Undergraduate | 83 | 20.6% |
| Graduate / Professional | 19 | 4.7% |
| Total | 403 | 100.0% |
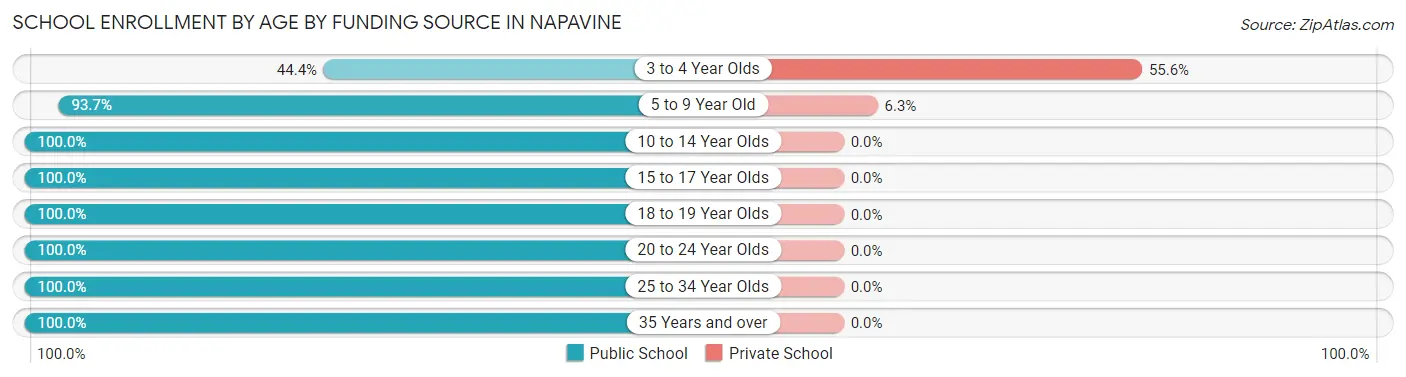
School Enrollment by Age by Funding Source in Napavine
Out of a total of 403 students who are enrolled in schools in Napavine, 16 (4.0%) attend a private institution, while the remaining 387 (96.0%) are enrolled in public schools. The age group of 3 to 4 year olds has the highest likelihood of being enrolled in private schools, with 10 (55.6% in the age bracket) enrolled. Conversely, the age group of 10 to 14 year olds has the lowest likelihood of being enrolled in a private school, with 132 (100.0% in the age bracket) attending a public institution.
| Age Bracket | Public School | Private School |
| 3 to 4 Year Olds | 8 (44.4%) | 10 (55.6%) |
| 5 to 9 Year Old | 89 (93.7%) | 6 (6.3%) |
| 10 to 14 Year Olds | 132 (100.0%) | 0 (0.0%) |
| 15 to 17 Year Olds | 34 (100.0%) | 0 (0.0%) |
| 18 to 19 Year Olds | 33 (100.0%) | 0 (0.0%) |
| 20 to 24 Year Olds | 32 (100.0%) | 0 (0.0%) |
| 25 to 34 Year Olds | 31 (100.0%) | 0 (0.0%) |
| 35 Years and over | 28 (100.0%) | 0 (0.0%) |
| Total | 387 (96.0%) | 16 (4.0%) |
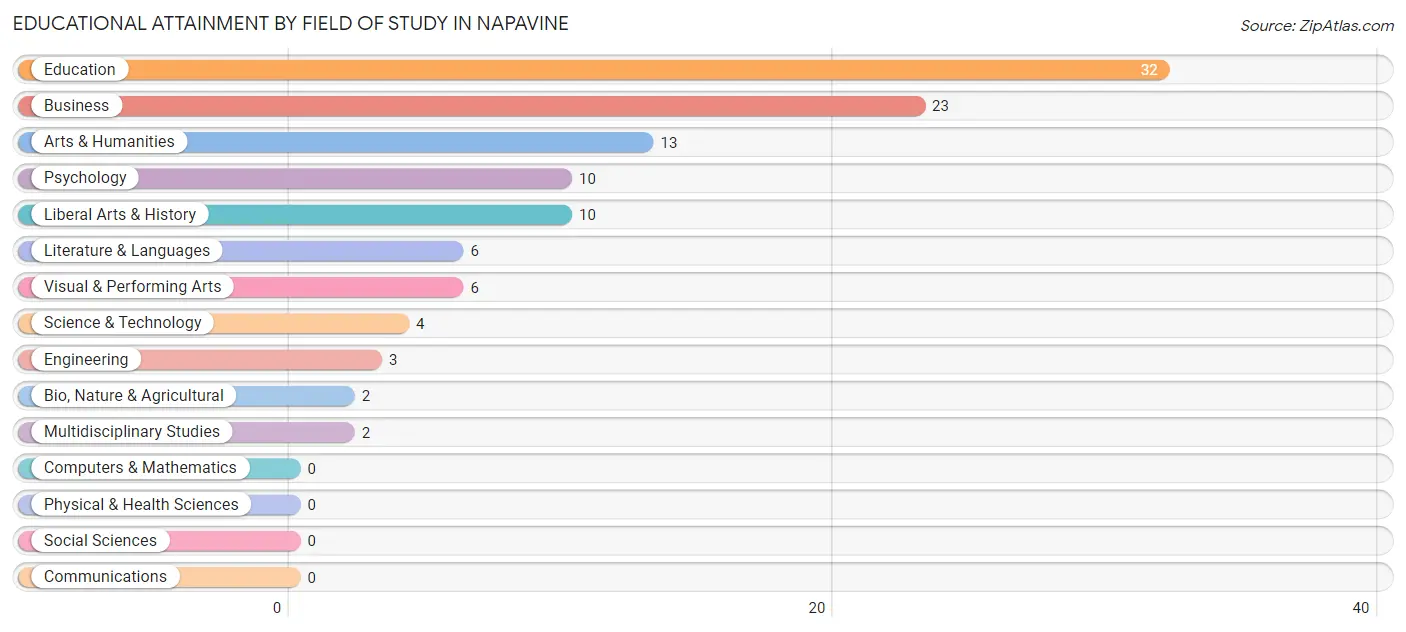
Educational Attainment by Field of Study in Napavine
Education (32 | 28.8%), business (23 | 20.7%), arts & humanities (13 | 11.7%), psychology (10 | 9.0%), and liberal arts & history (10 | 9.0%) are the most common fields of study among 111 individuals in Napavine who have obtained a bachelor's degree or higher.
| Field of Study | # Graduates | % Graduates |
| Computers & Mathematics | 0 | 0.0% |
| Bio, Nature & Agricultural | 2 | 1.8% |
| Physical & Health Sciences | 0 | 0.0% |
| Psychology | 10 | 9.0% |
| Social Sciences | 0 | 0.0% |
| Engineering | 3 | 2.7% |
| Multidisciplinary Studies | 2 | 1.8% |
| Science & Technology | 4 | 3.6% |
| Business | 23 | 20.7% |
| Education | 32 | 28.8% |
| Literature & Languages | 6 | 5.4% |
| Liberal Arts & History | 10 | 9.0% |
| Visual & Performing Arts | 6 | 5.4% |
| Communications | 0 | 0.0% |
| Arts & Humanities | 13 | 11.7% |
| Total | 111 | 100.0% |
Transportation & Commute in Napavine
Vehicle Availability by Sex in Napavine
The most prevalent vehicle ownership categories in Napavine are males with 3 vehicles (116, accounting for 26.0%) and females with 3 vehicles (97, making up 34.4%).
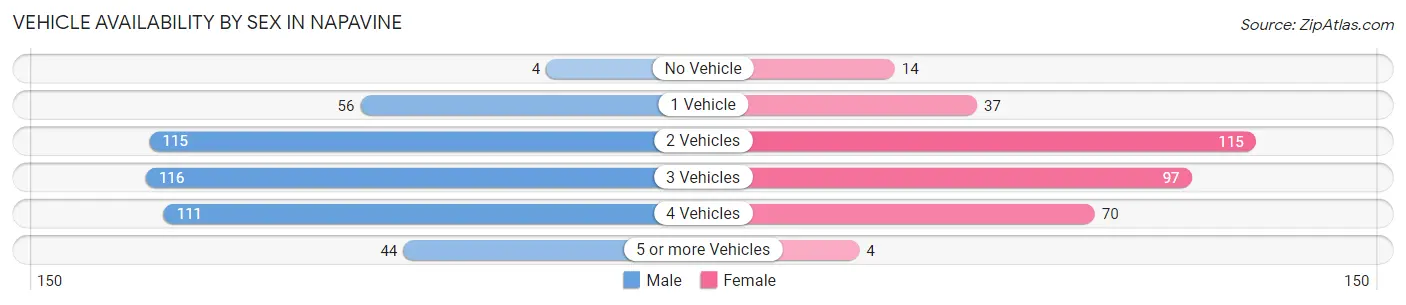
| Vehicles Available | Male | Female |
| No Vehicle | 4 (0.9%) | 14 (4.2%) |
| 1 Vehicle | 56 (12.6%) | 37 (11.0%) |
| 2 Vehicles | 115 (25.8%) | 115 (34.1%) |
| 3 Vehicles | 116 (26.0%) | 97 (28.8%) |
| 4 Vehicles | 111 (24.9%) | 70 (20.8%) |
| 5 or more Vehicles | 44 (9.9%) | 4 (1.2%) |
| Total | 446 (100.0%) | 337 (100.0%) |
Commute Time in Napavine
The most frequently occuring commute durations in Napavine are 15 to 19 minutes (213 commuters, 28.4%), 5 to 9 minutes (92 commuters, 12.3%), and 45 to 59 minutes (88 commuters, 11.7%).
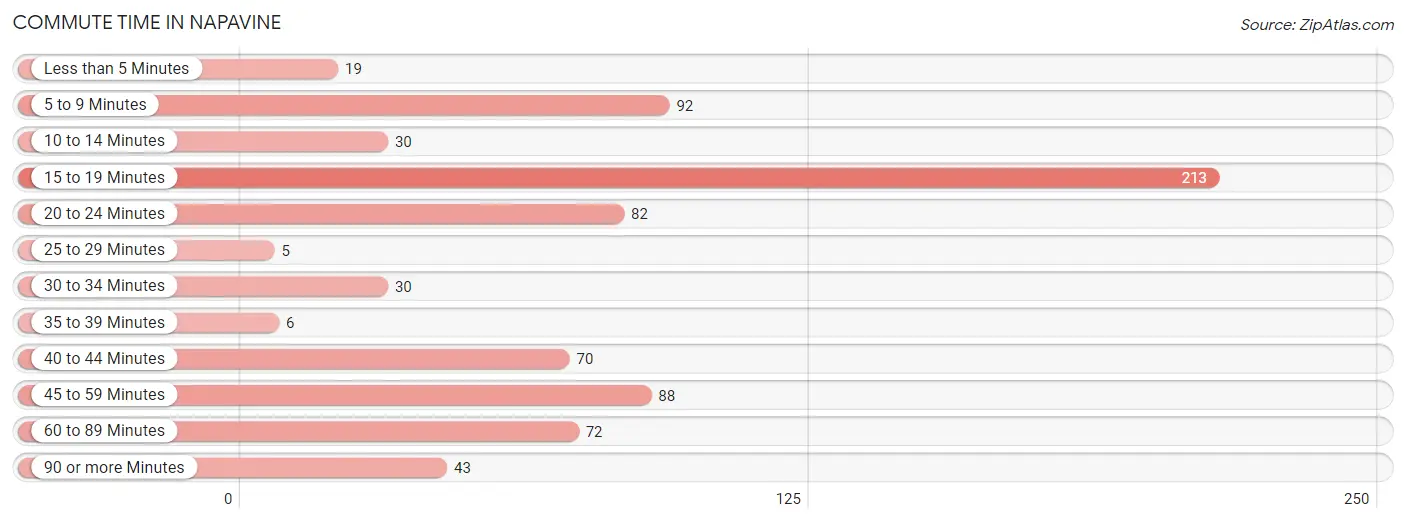
| Commute Time | # Commuters | % Commuters |
| Less than 5 Minutes | 19 | 2.5% |
| 5 to 9 Minutes | 92 | 12.3% |
| 10 to 14 Minutes | 30 | 4.0% |
| 15 to 19 Minutes | 213 | 28.4% |
| 20 to 24 Minutes | 82 | 10.9% |
| 25 to 29 Minutes | 5 | 0.7% |
| 30 to 34 Minutes | 30 | 4.0% |
| 35 to 39 Minutes | 6 | 0.8% |
| 40 to 44 Minutes | 70 | 9.3% |
| 45 to 59 Minutes | 88 | 11.7% |
| 60 to 89 Minutes | 72 | 9.6% |
| 90 or more Minutes | 43 | 5.7% |
Commute Time by Sex in Napavine
The most common commute times in Napavine are 15 to 19 minutes (91 commuters, 20.6%) for males and 15 to 19 minutes (122 commuters, 39.5%) for females.
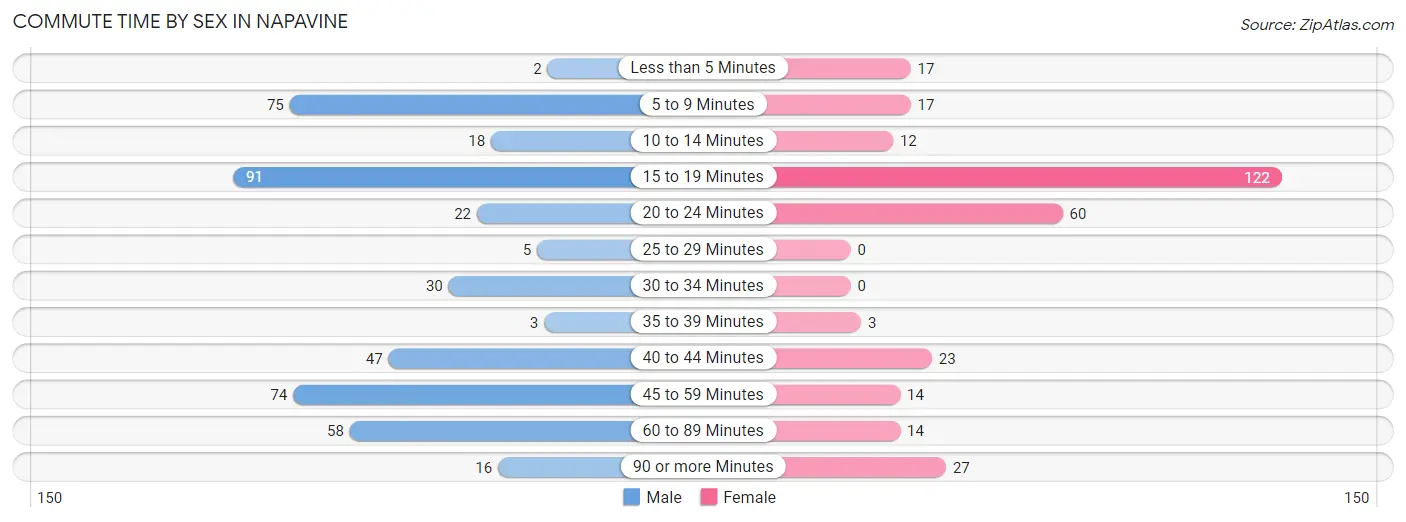
| Commute Time | Male | Female |
| Less than 5 Minutes | 2 (0.4%) | 17 (5.5%) |
| 5 to 9 Minutes | 75 (17.0%) | 17 (5.5%) |
| 10 to 14 Minutes | 18 (4.1%) | 12 (3.9%) |
| 15 to 19 Minutes | 91 (20.6%) | 122 (39.5%) |
| 20 to 24 Minutes | 22 (5.0%) | 60 (19.4%) |
| 25 to 29 Minutes | 5 (1.1%) | 0 (0.0%) |
| 30 to 34 Minutes | 30 (6.8%) | 0 (0.0%) |
| 35 to 39 Minutes | 3 (0.7%) | 3 (1.0%) |
| 40 to 44 Minutes | 47 (10.7%) | 23 (7.4%) |
| 45 to 59 Minutes | 74 (16.8%) | 14 (4.5%) |
| 60 to 89 Minutes | 58 (13.2%) | 14 (4.5%) |
| 90 or more Minutes | 16 (3.6%) | 27 (8.7%) |
Time of Departure to Work by Sex in Napavine
The most frequent times of departure to work in Napavine are 6:30 AM to 6:59 AM (69, 15.7%) for males and 6:30 AM to 6:59 AM (71, 23.0%) for females.
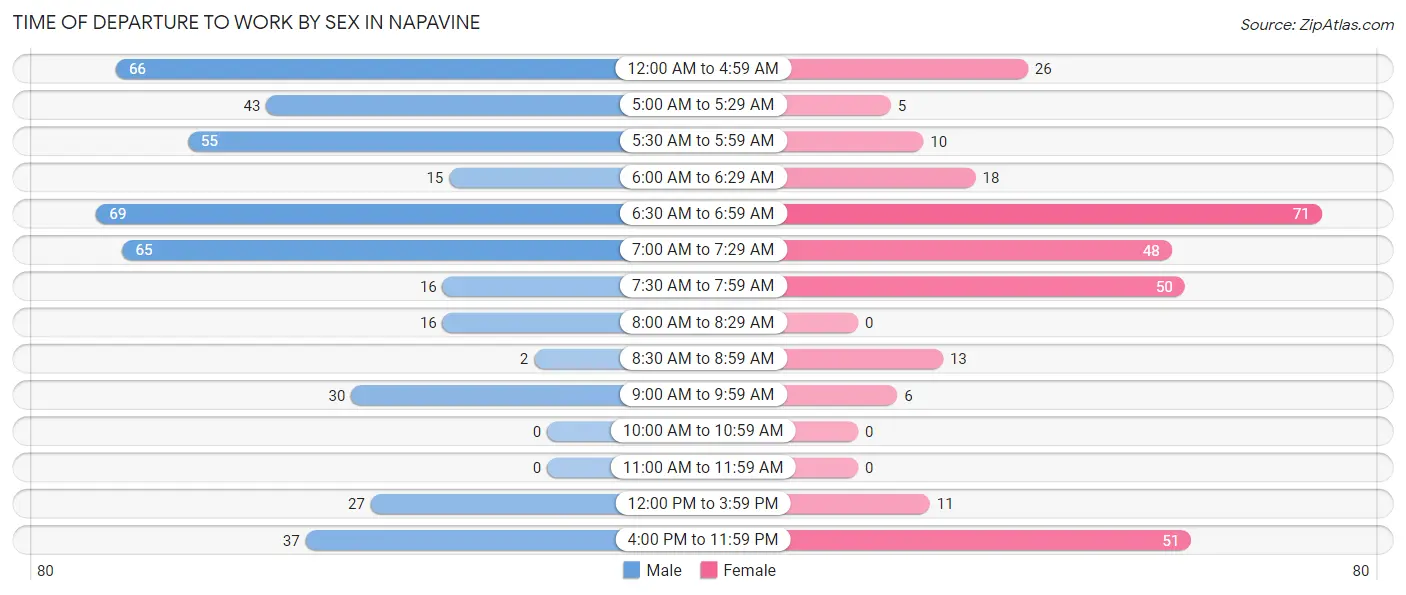
| Time of Departure | Male | Female |
| 12:00 AM to 4:59 AM | 66 (15.0%) | 26 (8.4%) |
| 5:00 AM to 5:29 AM | 43 (9.8%) | 5 (1.6%) |
| 5:30 AM to 5:59 AM | 55 (12.5%) | 10 (3.2%) |
| 6:00 AM to 6:29 AM | 15 (3.4%) | 18 (5.8%) |
| 6:30 AM to 6:59 AM | 69 (15.7%) | 71 (23.0%) |
| 7:00 AM to 7:29 AM | 65 (14.7%) | 48 (15.5%) |
| 7:30 AM to 7:59 AM | 16 (3.6%) | 50 (16.2%) |
| 8:00 AM to 8:29 AM | 16 (3.6%) | 0 (0.0%) |
| 8:30 AM to 8:59 AM | 2 (0.4%) | 13 (4.2%) |
| 9:00 AM to 9:59 AM | 30 (6.8%) | 6 (1.9%) |
| 10:00 AM to 10:59 AM | 0 (0.0%) | 0 (0.0%) |
| 11:00 AM to 11:59 AM | 0 (0.0%) | 0 (0.0%) |
| 12:00 PM to 3:59 PM | 27 (6.1%) | 11 (3.6%) |
| 4:00 PM to 11:59 PM | 37 (8.4%) | 51 (16.5%) |
| Total | 441 (100.0%) | 309 (100.0%) |
Housing Occupancy in Napavine
Occupancy by Ownership in Napavine
Of the total 642 dwellings in Napavine, owner-occupied units account for 505 (78.7%), while renter-occupied units make up 137 (21.3%).
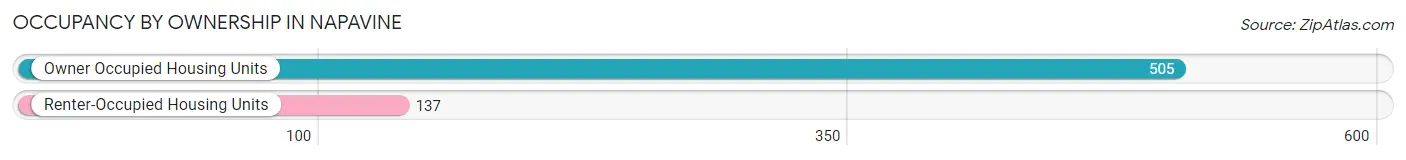
| Occupancy | # Housing Units | % Housing Units |
| Owner Occupied Housing Units | 505 | 78.7% |
| Renter-Occupied Housing Units | 137 | 21.3% |
| Total Occupied Housing Units | 642 | 100.0% |
Occupancy by Household Size in Napavine
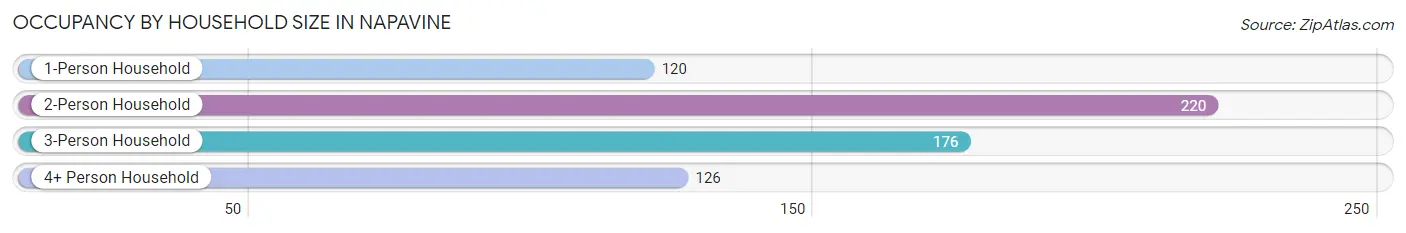
| Household Size | # Housing Units | % Housing Units |
| 1-Person Household | 120 | 18.7% |
| 2-Person Household | 220 | 34.3% |
| 3-Person Household | 176 | 27.4% |
| 4+ Person Household | 126 | 19.6% |
| Total Housing Units | 642 | 100.0% |
Occupancy by Ownership by Household Size in Napavine
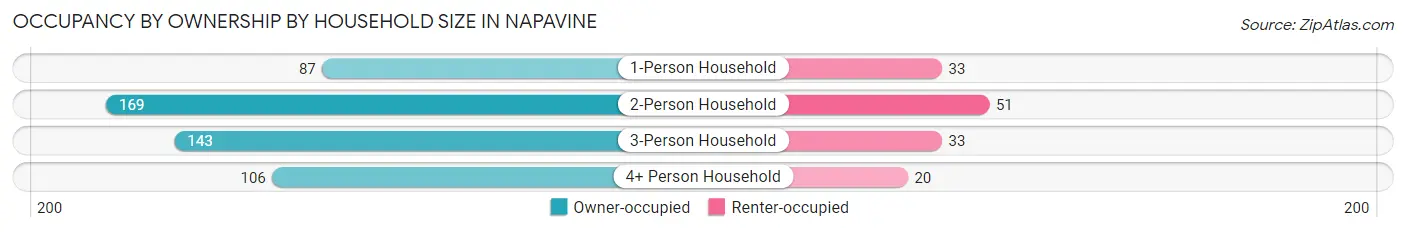
| Household Size | Owner-occupied | Renter-occupied |
| 1-Person Household | 87 (72.5%) | 33 (27.5%) |
| 2-Person Household | 169 (76.8%) | 51 (23.2%) |
| 3-Person Household | 143 (81.2%) | 33 (18.8%) |
| 4+ Person Household | 106 (84.1%) | 20 (15.9%) |
| Total Housing Units | 505 (78.7%) | 137 (21.3%) |
Occupancy by Educational Attainment in Napavine
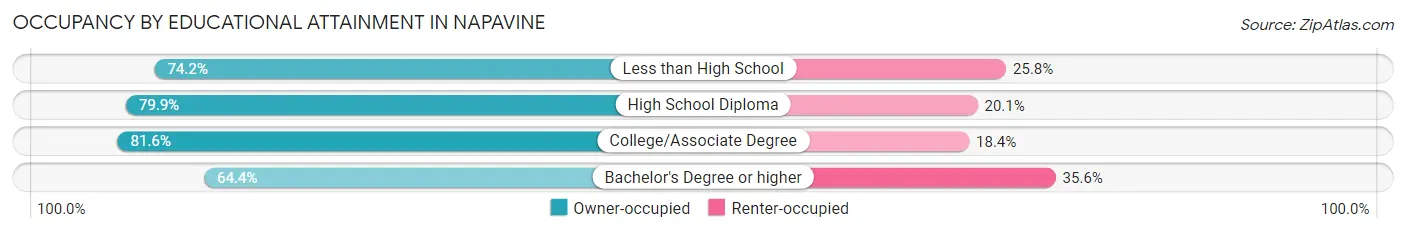
| Household Size | Owner-occupied | Renter-occupied |
| Less than High School | 49 (74.2%) | 17 (25.8%) |
| High School Diploma | 179 (79.9%) | 45 (20.1%) |
| College/Associate Degree | 239 (81.6%) | 54 (18.4%) |
| Bachelor's Degree or higher | 38 (64.4%) | 21 (35.6%) |
Occupancy by Age of Householder in Napavine
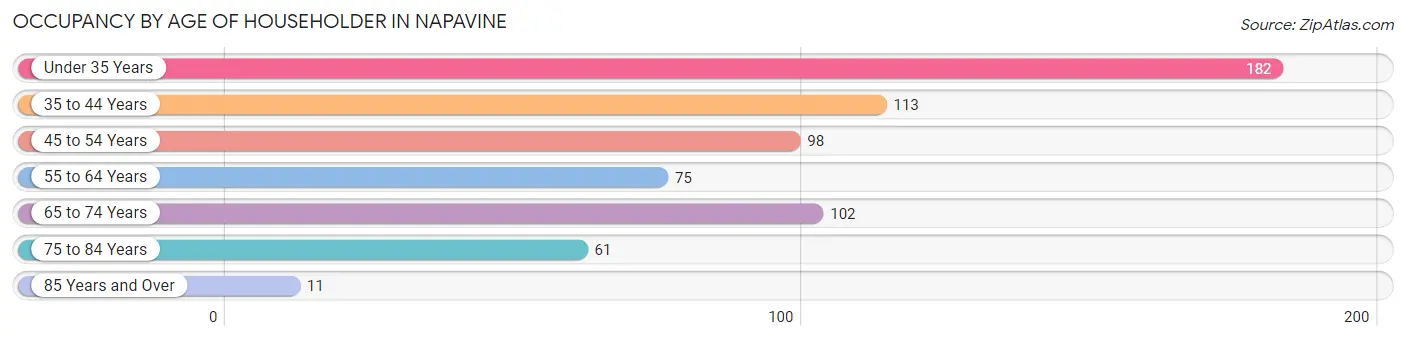
| Age Bracket | # Households | % Households |
| Under 35 Years | 182 | 28.3% |
| 35 to 44 Years | 113 | 17.6% |
| 45 to 54 Years | 98 | 15.3% |
| 55 to 64 Years | 75 | 11.7% |
| 65 to 74 Years | 102 | 15.9% |
| 75 to 84 Years | 61 | 9.5% |
| 85 Years and Over | 11 | 1.7% |
| Total | 642 | 100.0% |
Housing Finances in Napavine
Median Income by Occupancy in Napavine
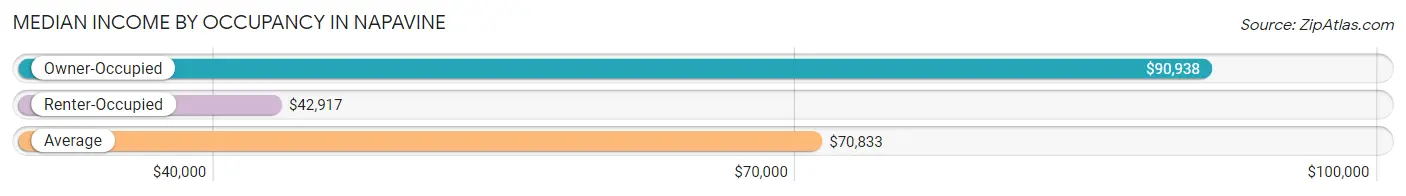
| Occupancy Type | # Households | Median Income |
| Owner-Occupied | 505 (78.7%) | $90,938 |
| Renter-Occupied | 137 (21.3%) | $42,917 |
| Average | 642 (100.0%) | $70,833 |
Occupancy by Householder Income Bracket in Napavine
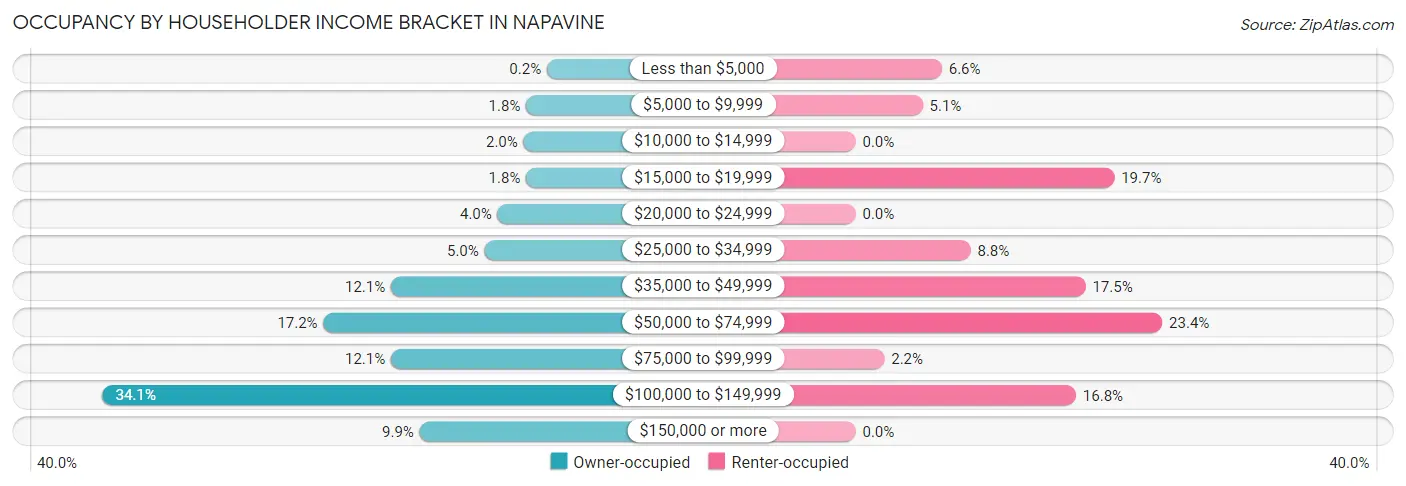
| Income Bracket | Owner-occupied | Renter-occupied |
| Less than $5,000 | 1 (0.2%) | 9 (6.6%) |
| $5,000 to $9,999 | 9 (1.8%) | 7 (5.1%) |
| $10,000 to $14,999 | 10 (2.0%) | 0 (0.0%) |
| $15,000 to $19,999 | 9 (1.8%) | 27 (19.7%) |
| $20,000 to $24,999 | 20 (4.0%) | 0 (0.0%) |
| $25,000 to $34,999 | 25 (5.0%) | 12 (8.8%) |
| $35,000 to $49,999 | 61 (12.1%) | 24 (17.5%) |
| $50,000 to $74,999 | 87 (17.2%) | 32 (23.4%) |
| $75,000 to $99,999 | 61 (12.1%) | 3 (2.2%) |
| $100,000 to $149,999 | 172 (34.1%) | 23 (16.8%) |
| $150,000 or more | 50 (9.9%) | 0 (0.0%) |
| Total | 505 (100.0%) | 137 (100.0%) |
Monthly Housing Cost Tiers in Napavine
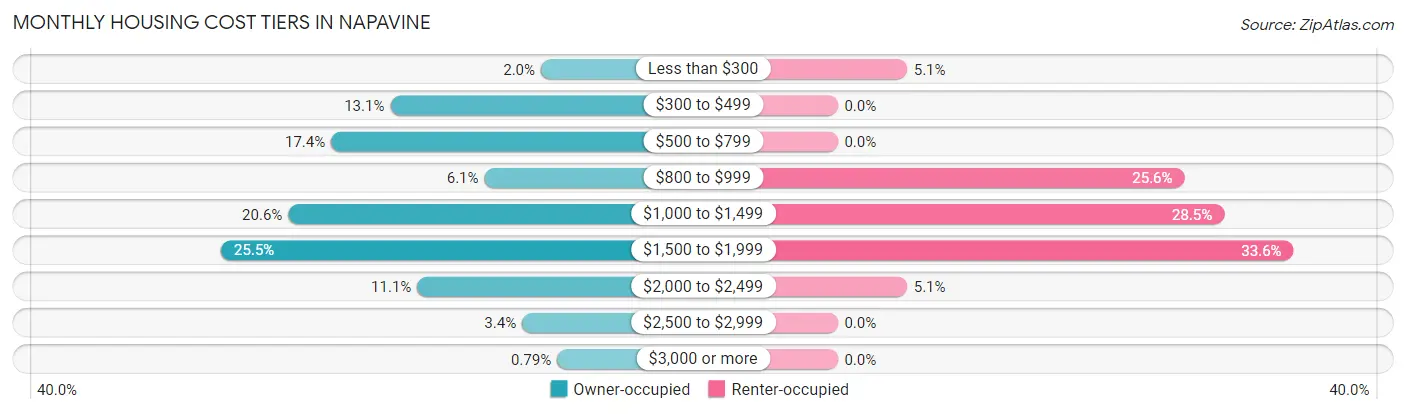
| Monthly Cost | Owner-occupied | Renter-occupied |
| Less than $300 | 10 (2.0%) | 7 (5.1%) |
| $300 to $499 | 66 (13.1%) | 0 (0.0%) |
| $500 to $799 | 88 (17.4%) | 0 (0.0%) |
| $800 to $999 | 31 (6.1%) | 35 (25.6%) |
| $1,000 to $1,499 | 104 (20.6%) | 39 (28.5%) |
| $1,500 to $1,999 | 129 (25.5%) | 46 (33.6%) |
| $2,000 to $2,499 | 56 (11.1%) | 7 (5.1%) |
| $2,500 to $2,999 | 17 (3.4%) | 0 (0.0%) |
| $3,000 or more | 4 (0.8%) | 0 (0.0%) |
| Total | 505 (100.0%) | 137 (100.0%) |
Physical Housing Characteristics in Napavine
Housing Structures in Napavine
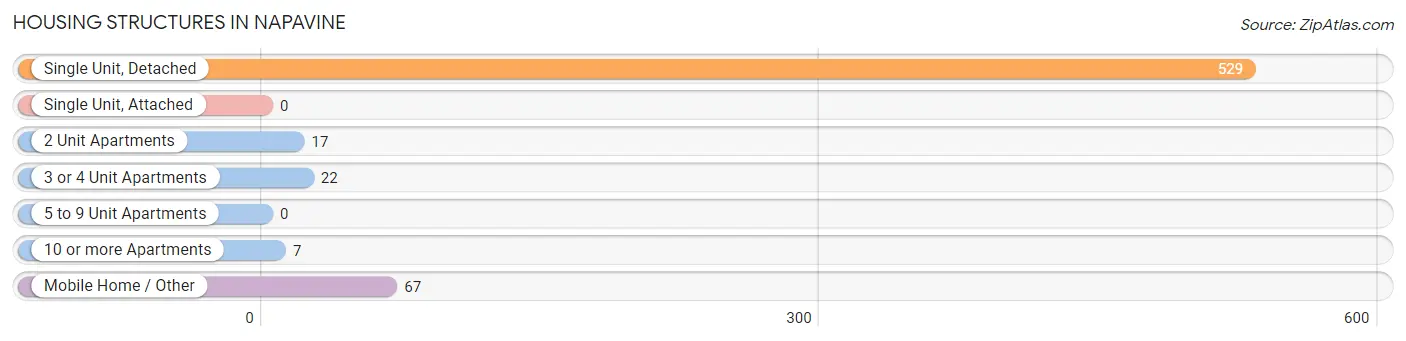
| Structure Type | # Housing Units | % Housing Units |
| Single Unit, Detached | 529 | 82.4% |
| Single Unit, Attached | 0 | 0.0% |
| 2 Unit Apartments | 17 | 2.6% |
| 3 or 4 Unit Apartments | 22 | 3.4% |
| 5 to 9 Unit Apartments | 0 | 0.0% |
| 10 or more Apartments | 7 | 1.1% |
| Mobile Home / Other | 67 | 10.4% |
| Total | 642 | 100.0% |
Housing Structures by Occupancy in Napavine
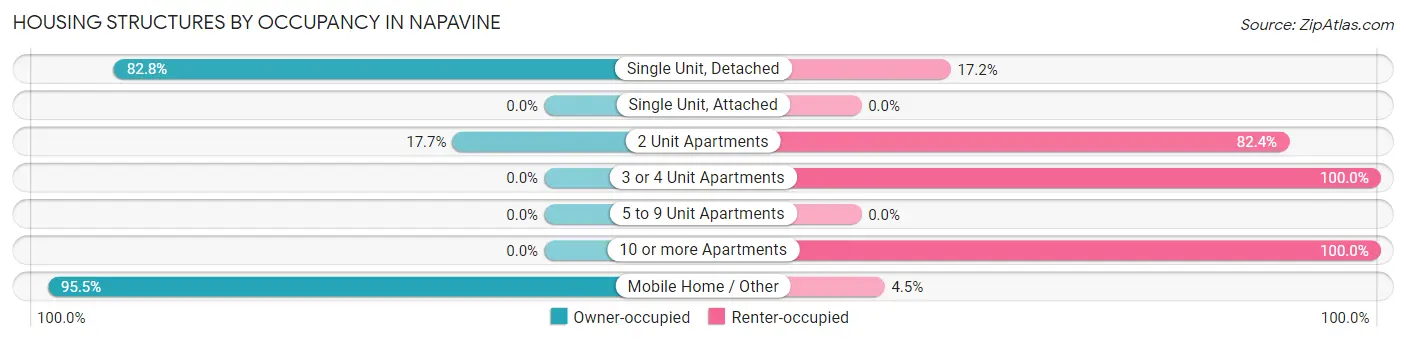
| Structure Type | Owner-occupied | Renter-occupied |
| Single Unit, Detached | 438 (82.8%) | 91 (17.2%) |
| Single Unit, Attached | 0 (0.0%) | 0 (0.0%) |
| 2 Unit Apartments | 3 (17.6%) | 14 (82.4%) |
| 3 or 4 Unit Apartments | 0 (0.0%) | 22 (100.0%) |
| 5 to 9 Unit Apartments | 0 (0.0%) | 0 (0.0%) |
| 10 or more Apartments | 0 (0.0%) | 7 (100.0%) |
| Mobile Home / Other | 64 (95.5%) | 3 (4.5%) |
| Total | 505 (78.7%) | 137 (21.3%) |
Housing Structures by Number of Rooms in Napavine
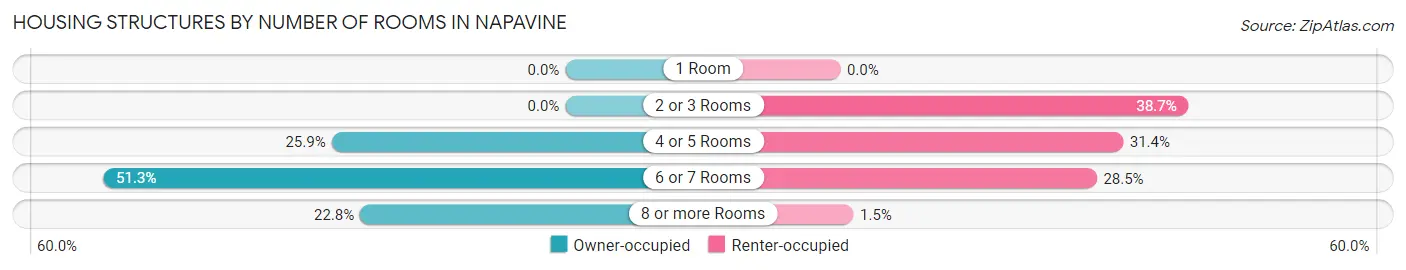
| Number of Rooms | Owner-occupied | Renter-occupied |
| 1 Room | 0 (0.0%) | 0 (0.0%) |
| 2 or 3 Rooms | 0 (0.0%) | 53 (38.7%) |
| 4 or 5 Rooms | 131 (25.9%) | 43 (31.4%) |
| 6 or 7 Rooms | 259 (51.3%) | 39 (28.5%) |
| 8 or more Rooms | 115 (22.8%) | 2 (1.5%) |
| Total | 505 (100.0%) | 137 (100.0%) |
Housing Structure by Heating Type in Napavine
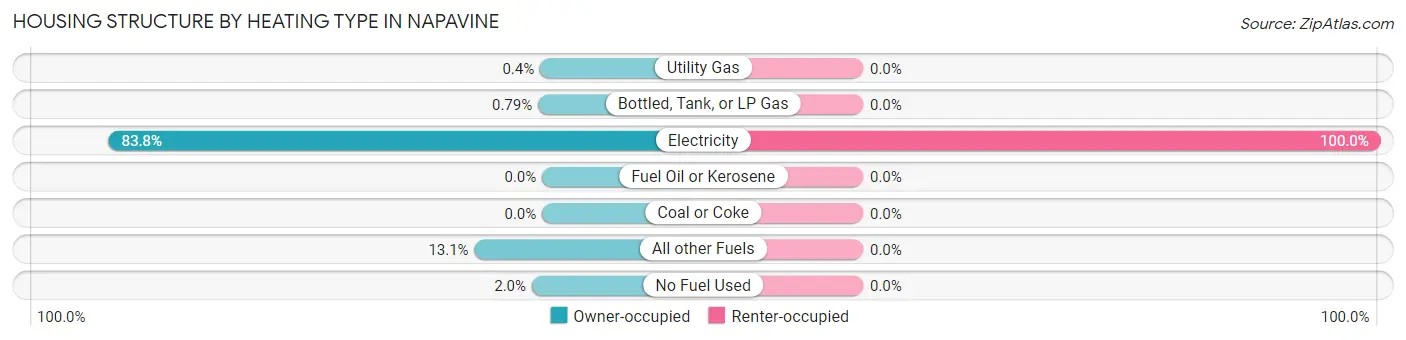
| Heating Type | Owner-occupied | Renter-occupied |
| Utility Gas | 2 (0.4%) | 0 (0.0%) |
| Bottled, Tank, or LP Gas | 4 (0.8%) | 0 (0.0%) |
| Electricity | 423 (83.8%) | 137 (100.0%) |
| Fuel Oil or Kerosene | 0 (0.0%) | 0 (0.0%) |
| Coal or Coke | 0 (0.0%) | 0 (0.0%) |
| All other Fuels | 66 (13.1%) | 0 (0.0%) |
| No Fuel Used | 10 (2.0%) | 0 (0.0%) |
| Total | 505 (100.0%) | 137 (100.0%) |
Household Vehicle Usage in Napavine
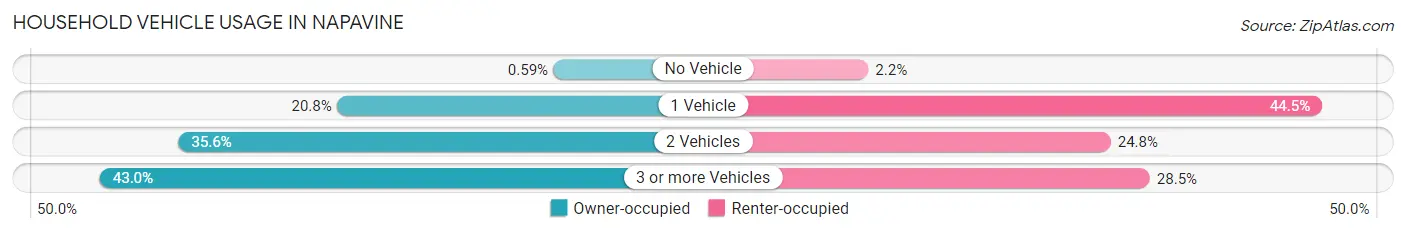
| Vehicles per Household | Owner-occupied | Renter-occupied |
| No Vehicle | 3 (0.6%) | 3 (2.2%) |
| 1 Vehicle | 105 (20.8%) | 61 (44.5%) |
| 2 Vehicles | 180 (35.6%) | 34 (24.8%) |
| 3 or more Vehicles | 217 (43.0%) | 39 (28.5%) |
| Total | 505 (100.0%) | 137 (100.0%) |
Real Estate & Mortgages in Napavine
Real Estate and Mortgage Overview in Napavine
| Characteristic | Without Mortgage | With Mortgage |
| Housing Units | 156 | 349 |
| Median Property Value | $250,000 | $303,800 |
| Median Household Income | $40,000 | $33 |
| Monthly Housing Costs | $524 | $4 |
| Real Estate Taxes | $1,768 | $34 |
Property Value by Mortgage Status in Napavine
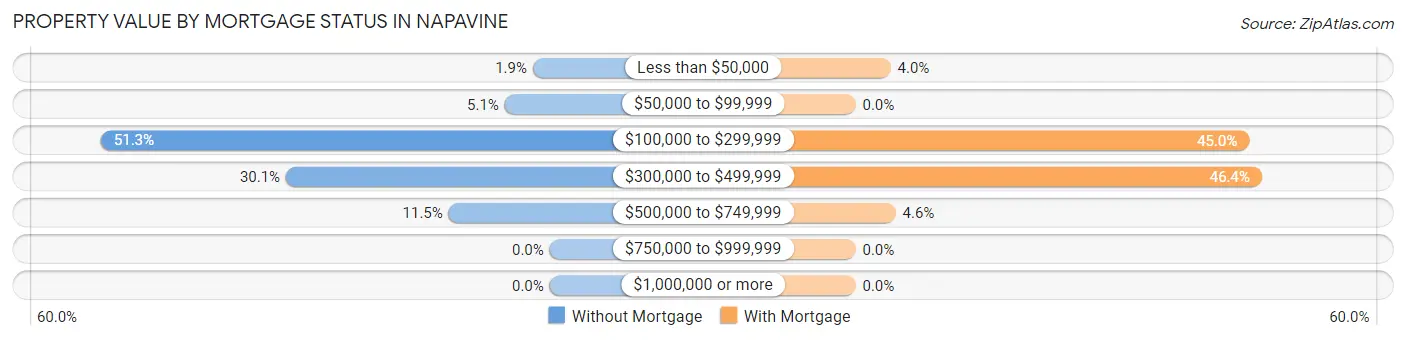
| Property Value | Without Mortgage | With Mortgage |
| Less than $50,000 | 3 (1.9%) | 14 (4.0%) |
| $50,000 to $99,999 | 8 (5.1%) | 0 (0.0%) |
| $100,000 to $299,999 | 80 (51.3%) | 157 (45.0%) |
| $300,000 to $499,999 | 47 (30.1%) | 162 (46.4%) |
| $500,000 to $749,999 | 18 (11.5%) | 16 (4.6%) |
| $750,000 to $999,999 | 0 (0.0%) | 0 (0.0%) |
| $1,000,000 or more | 0 (0.0%) | 0 (0.0%) |
| Total | 156 (100.0%) | 349 (100.0%) |
Household Income by Mortgage Status in Napavine
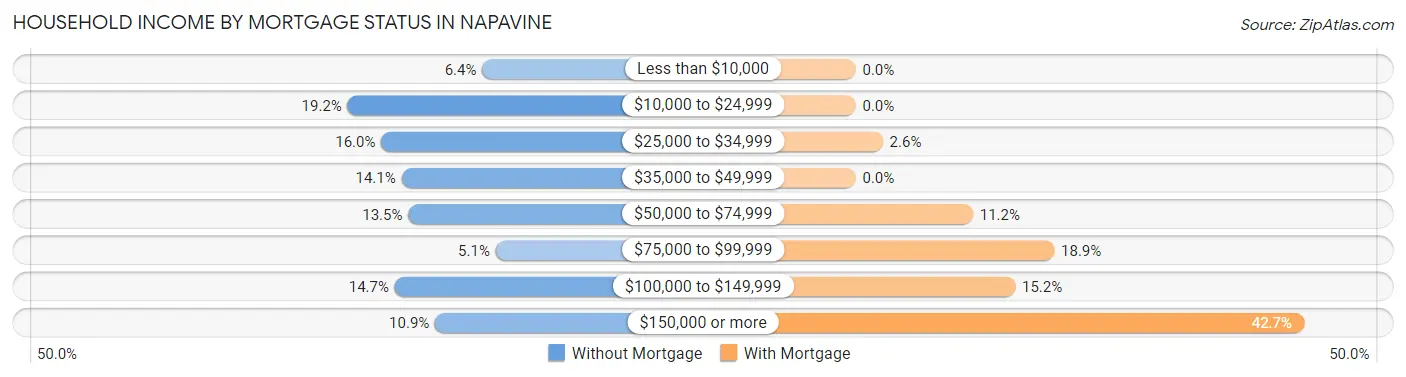
| Household Income | Without Mortgage | With Mortgage |
| Less than $10,000 | 10 (6.4%) | 0 (0.0%) |
| $10,000 to $24,999 | 30 (19.2%) | 0 (0.0%) |
| $25,000 to $34,999 | 25 (16.0%) | 9 (2.6%) |
| $35,000 to $49,999 | 22 (14.1%) | 0 (0.0%) |
| $50,000 to $74,999 | 21 (13.5%) | 39 (11.2%) |
| $75,000 to $99,999 | 8 (5.1%) | 66 (18.9%) |
| $100,000 to $149,999 | 23 (14.7%) | 53 (15.2%) |
| $150,000 or more | 17 (10.9%) | 149 (42.7%) |
| Total | 156 (100.0%) | 349 (100.0%) |
Property Value to Household Income Ratio in Napavine
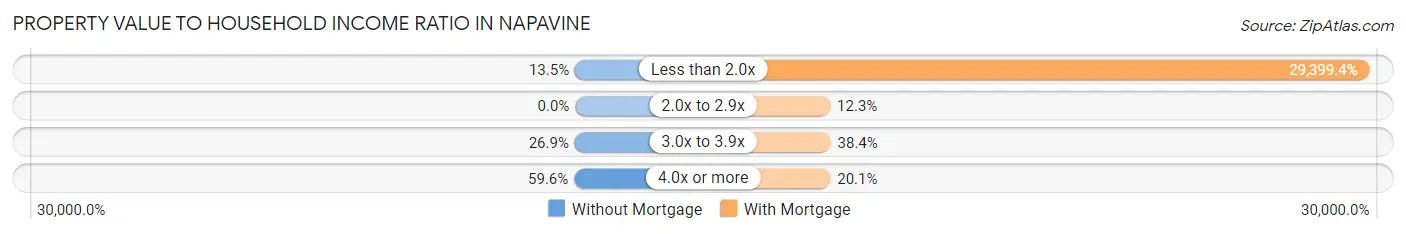
| Value-to-Income Ratio | Without Mortgage | With Mortgage |
| Less than 2.0x | 21 (13.5%) | 102,604 (29,399.4%) |
| 2.0x to 2.9x | 0 (0.0%) | 43 (12.3%) |
| 3.0x to 3.9x | 42 (26.9%) | 134 (38.4%) |
| 4.0x or more | 93 (59.6%) | 70 (20.1%) |
| Total | 156 (100.0%) | 349 (100.0%) |
Real Estate Taxes by Mortgage Status in Napavine
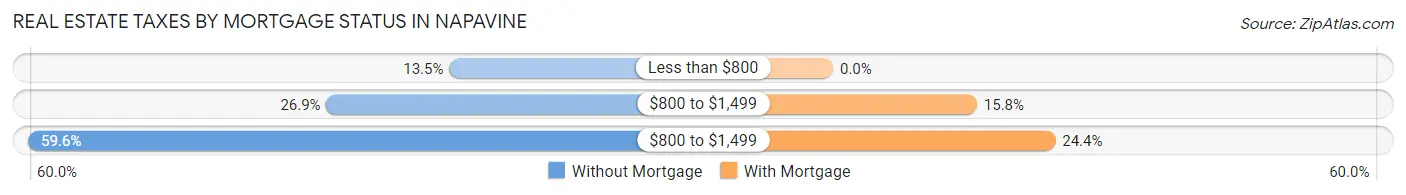
| Property Taxes | Without Mortgage | With Mortgage |
| Less than $800 | 21 (13.5%) | 0 (0.0%) |
| $800 to $1,499 | 42 (26.9%) | 55 (15.8%) |
| $800 to $1,499 | 93 (59.6%) | 85 (24.4%) |
| Total | 156 (100.0%) | 349 (100.0%) |
Health & Disability in Napavine
Health Insurance Coverage by Age in Napavine
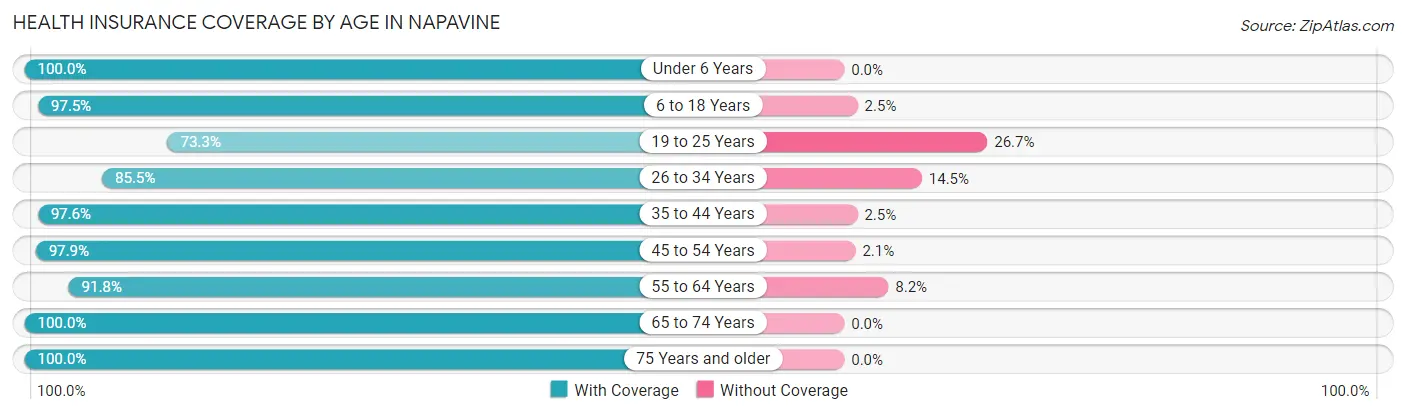
| Age Bracket | With Coverage | Without Coverage |
| Under 6 Years | 106 (100.0%) | 0 (0.0%) |
| 6 to 18 Years | 274 (97.5%) | 7 (2.5%) |
| 19 to 25 Years | 121 (73.3%) | 44 (26.7%) |
| 26 to 34 Years | 284 (85.5%) | 48 (14.5%) |
| 35 to 44 Years | 239 (97.6%) | 6 (2.5%) |
| 45 to 54 Years | 188 (97.9%) | 4 (2.1%) |
| 55 to 64 Years | 123 (91.8%) | 11 (8.2%) |
| 65 to 74 Years | 160 (100.0%) | 0 (0.0%) |
| 75 Years and older | 85 (100.0%) | 0 (0.0%) |
| Total | 1,580 (92.9%) | 120 (7.1%) |
Health Insurance Coverage by Citizenship Status in Napavine
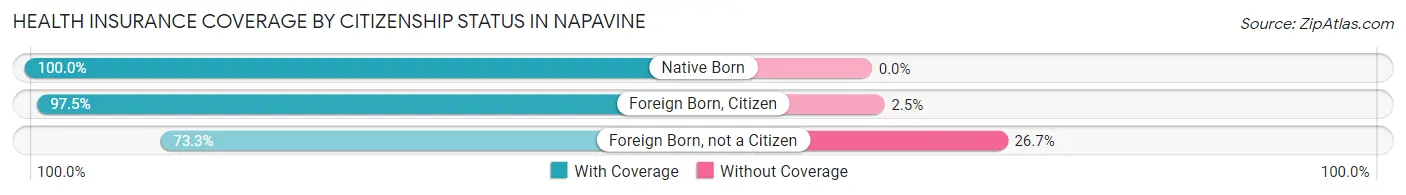
| Citizenship Status | With Coverage | Without Coverage |
| Native Born | 106 (100.0%) | 0 (0.0%) |
| Foreign Born, Citizen | 274 (97.5%) | 7 (2.5%) |
| Foreign Born, not a Citizen | 121 (73.3%) | 44 (26.7%) |
Health Insurance Coverage by Household Income in Napavine
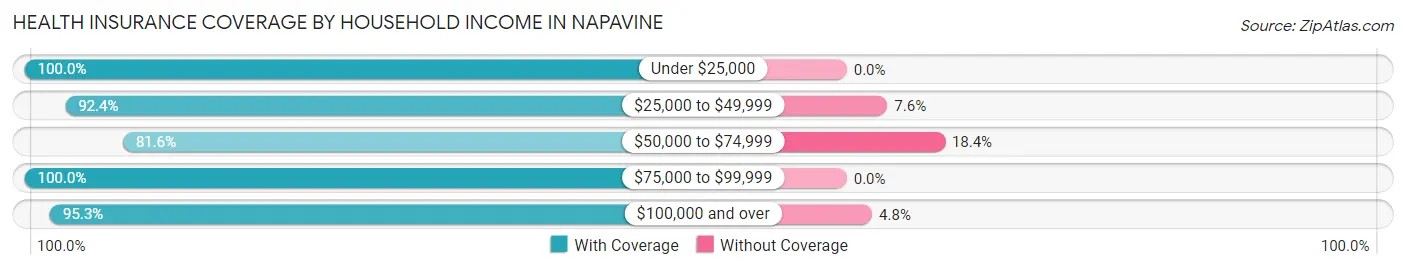
| Household Income | With Coverage | Without Coverage |
| Under $25,000 | 127 (100.0%) | 0 (0.0%) |
| $25,000 to $49,999 | 255 (92.4%) | 21 (7.6%) |
| $50,000 to $74,999 | 284 (81.6%) | 64 (18.4%) |
| $75,000 to $99,999 | 212 (100.0%) | 0 (0.0%) |
| $100,000 and over | 702 (95.3%) | 35 (4.8%) |
Public vs Private Health Insurance Coverage by Age in Napavine
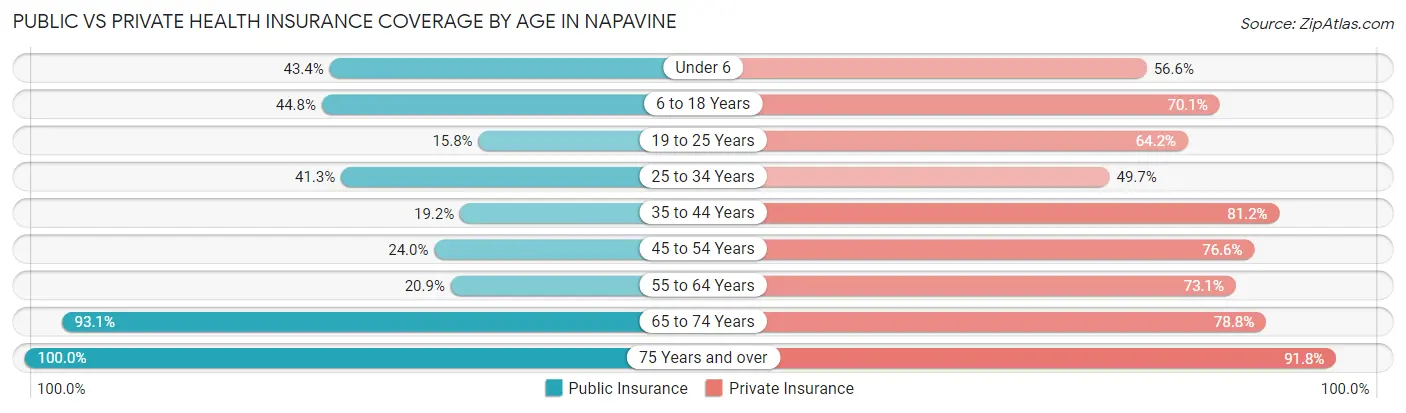
| Age Bracket | Public Insurance | Private Insurance |
| Under 6 | 46 (43.4%) | 60 (56.6%) |
| 6 to 18 Years | 126 (44.8%) | 197 (70.1%) |
| 19 to 25 Years | 26 (15.8%) | 106 (64.2%) |
| 25 to 34 Years | 137 (41.3%) | 165 (49.7%) |
| 35 to 44 Years | 47 (19.2%) | 199 (81.2%) |
| 45 to 54 Years | 46 (24.0%) | 147 (76.6%) |
| 55 to 64 Years | 28 (20.9%) | 98 (73.1%) |
| 65 to 74 Years | 149 (93.1%) | 126 (78.7%) |
| 75 Years and over | 85 (100.0%) | 78 (91.8%) |
| Total | 690 (40.6%) | 1,176 (69.2%) |
Disability Status by Sex by Age in Napavine
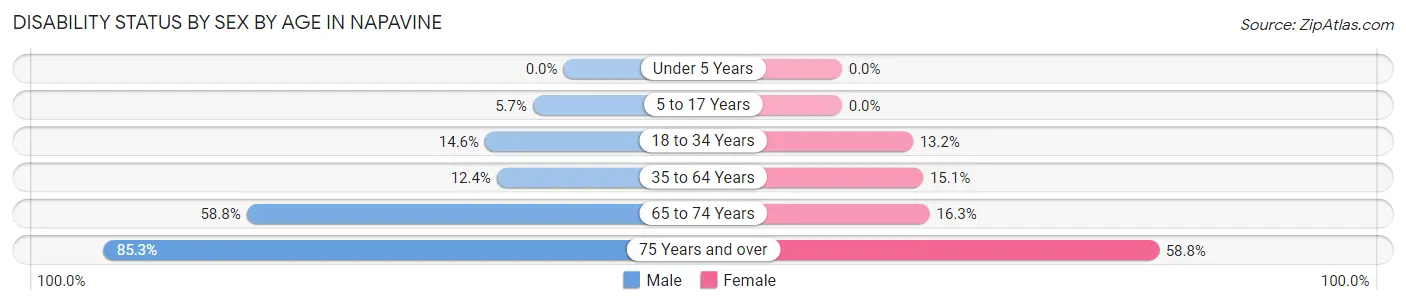
| Age Bracket | Male | Female |
| Under 5 Years | 0 (0.0%) | 0 (0.0%) |
| 5 to 17 Years | 8 (5.7%) | 0 (0.0%) |
| 18 to 34 Years | 44 (14.6%) | 30 (13.2%) |
| 35 to 64 Years | 37 (12.4%) | 41 (15.1%) |
| 65 to 74 Years | 40 (58.8%) | 15 (16.3%) |
| 75 Years and over | 29 (85.3%) | 30 (58.8%) |
Disability Class by Sex by Age in Napavine
Disability Class: Hearing Difficulty
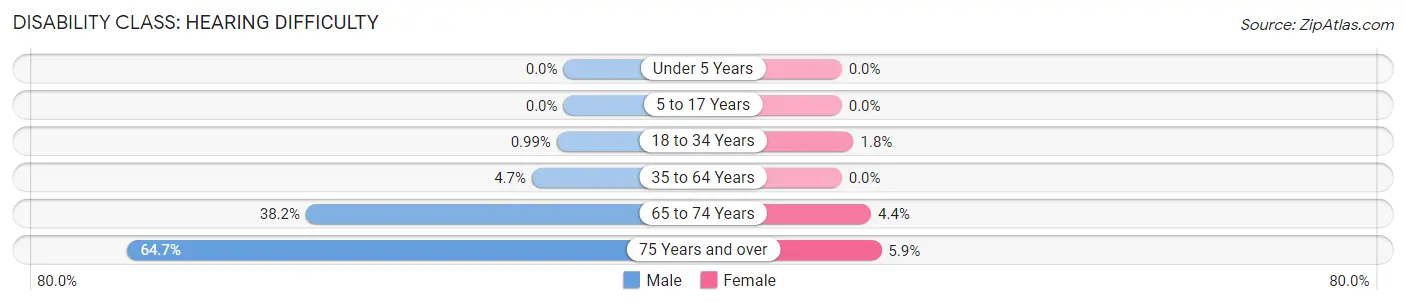
| Age Bracket | Male | Female |
| Under 5 Years | 0 (0.0%) | 0 (0.0%) |
| 5 to 17 Years | 0 (0.0%) | 0 (0.0%) |
| 18 to 34 Years | 3 (1.0%) | 4 (1.8%) |
| 35 to 64 Years | 14 (4.7%) | 0 (0.0%) |
| 65 to 74 Years | 26 (38.2%) | 4 (4.3%) |
| 75 Years and over | 22 (64.7%) | 3 (5.9%) |
Disability Class: Vision Difficulty
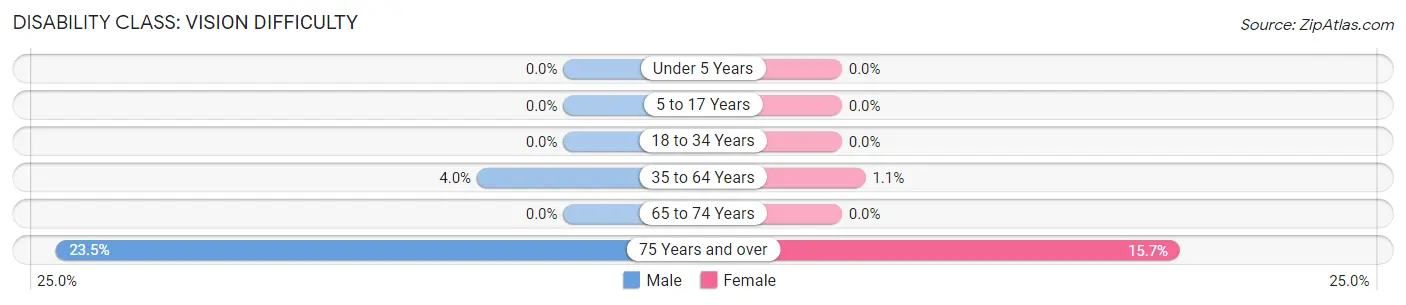
| Age Bracket | Male | Female |
| Under 5 Years | 0 (0.0%) | 0 (0.0%) |
| 5 to 17 Years | 0 (0.0%) | 0 (0.0%) |
| 18 to 34 Years | 0 (0.0%) | 0 (0.0%) |
| 35 to 64 Years | 12 (4.0%) | 3 (1.1%) |
| 65 to 74 Years | 0 (0.0%) | 0 (0.0%) |
| 75 Years and over | 8 (23.5%) | 8 (15.7%) |
Disability Class: Cognitive Difficulty
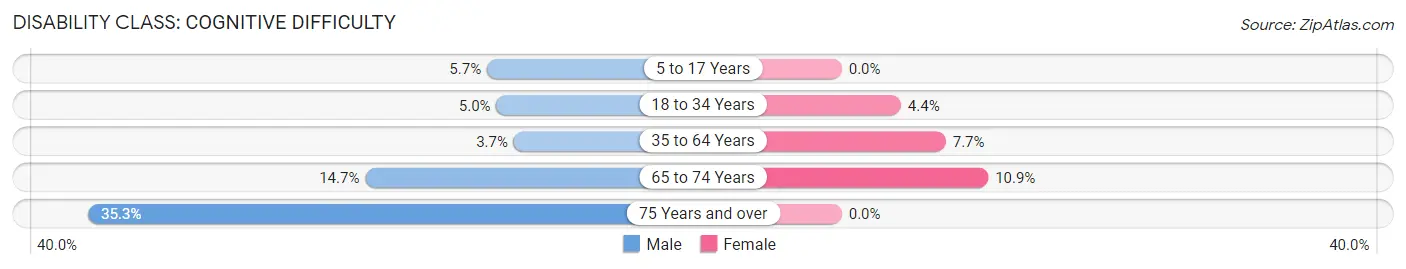
| Age Bracket | Male | Female |
| 5 to 17 Years | 8 (5.7%) | 0 (0.0%) |
| 18 to 34 Years | 15 (5.0%) | 10 (4.4%) |
| 35 to 64 Years | 11 (3.7%) | 21 (7.7%) |
| 65 to 74 Years | 10 (14.7%) | 10 (10.9%) |
| 75 Years and over | 12 (35.3%) | 0 (0.0%) |
Disability Class: Ambulatory Difficulty
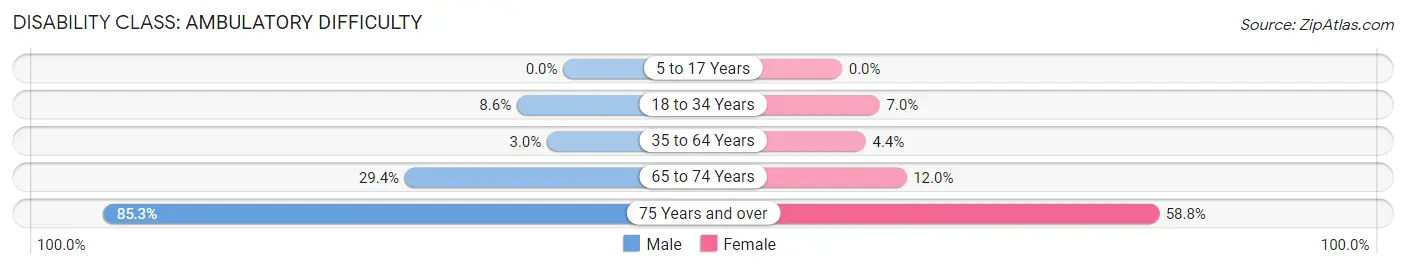
| Age Bracket | Male | Female |
| 5 to 17 Years | 0 (0.0%) | 0 (0.0%) |
| 18 to 34 Years | 26 (8.6%) | 16 (7.0%) |
| 35 to 64 Years | 9 (3.0%) | 12 (4.4%) |
| 65 to 74 Years | 20 (29.4%) | 11 (12.0%) |
| 75 Years and over | 29 (85.3%) | 30 (58.8%) |
Disability Class: Self-Care Difficulty
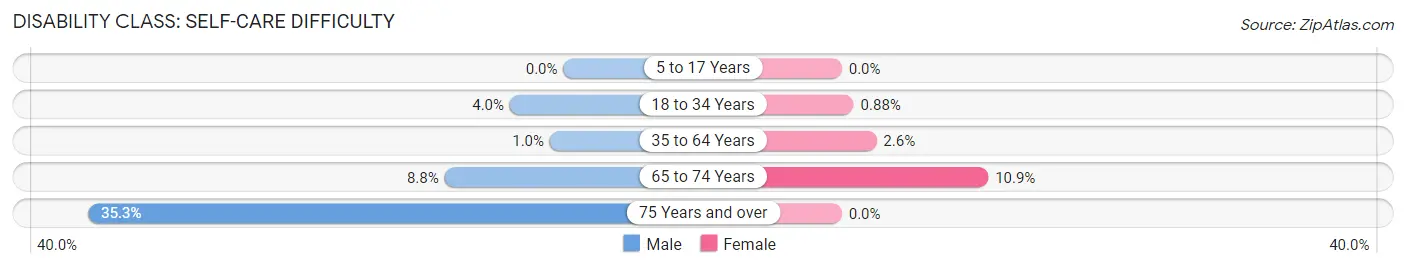
| Age Bracket | Male | Female |
| 5 to 17 Years | 0 (0.0%) | 0 (0.0%) |
| 18 to 34 Years | 12 (4.0%) | 2 (0.9%) |
| 35 to 64 Years | 3 (1.0%) | 7 (2.6%) |
| 65 to 74 Years | 6 (8.8%) | 10 (10.9%) |
| 75 Years and over | 12 (35.3%) | 0 (0.0%) |
Technology Access in Napavine
Computing Device Access in Napavine
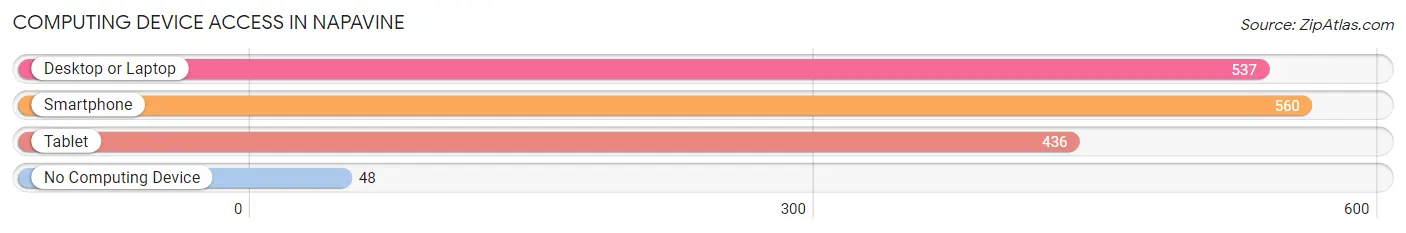
| Device Type | # Households | % Households |
| Desktop or Laptop | 537 | 83.6% |
| Smartphone | 560 | 87.2% |
| Tablet | 436 | 67.9% |
| No Computing Device | 48 | 7.5% |
| Total | 642 | 100.0% |
Internet Access in Napavine
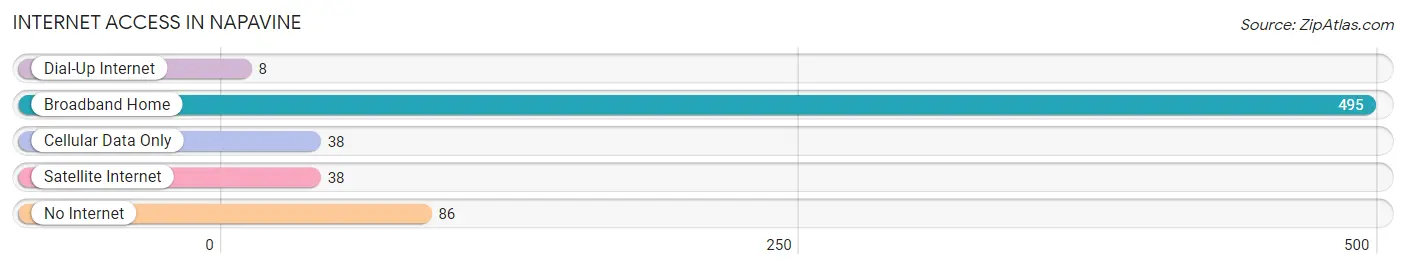
| Internet Type | # Households | % Households |
| Dial-Up Internet | 8 | 1.3% |
| Broadband Home | 495 | 77.1% |
| Cellular Data Only | 38 | 5.9% |
| Satellite Internet | 38 | 5.9% |
| No Internet | 86 | 13.4% |
| Total | 642 | 100.0% |
Napavine Summary
History
The area now known as Napavine, Washington was first inhabited by the Cowlitz Tribe of Native Americans. The Cowlitz Tribe was a large and powerful tribe that lived in the area for thousands of years before the arrival of European settlers. The Cowlitz Tribe was known for its fishing and hunting skills, as well as its ability to trade with other tribes.
The first European settlers arrived in the area in the late 1800s. These settlers were mostly farmers and loggers who were looking to make a living in the area. The first post office in the area was established in 1891 and the town of Napavine was officially incorporated in 1909.
The town of Napavine was named after the Napavine River, which runs through the area. The river was named after Chief Napavine, a leader of the Cowlitz Tribe.
The town of Napavine grew steadily throughout the 20th century. The town was home to several businesses, including a sawmill, a lumber mill, a cannery, and a dairy. The town also had a school, a library, and a post office.
In the 1950s, the town of Napavine began to decline. The sawmill and lumber mill closed, and the cannery and dairy moved away. The population of the town began to decline as well.
In the late 1990s, the town of Napavine began to experience a resurgence. The town was revitalized by the opening of a new casino, which brought in new jobs and businesses. The town also began to attract new residents, and the population began to grow again.
Geography
Napavine is located in Lewis County, Washington, in the southwestern part of the state. The town is situated on the banks of the Napavine River, which runs through the area. The town is surrounded by rolling hills and forests, and is located about 25 miles south of the city of Centralia.
The climate in Napavine is mild and temperate. The average temperature in the summer is around 70 degrees Fahrenheit, and the average temperature in the winter is around 40 degrees Fahrenheit. The area receives an average of 40 inches of rain per year.
Economy
The economy of Napavine is largely based on tourism and agriculture. The town is home to several tourist attractions, including the Napavine River, the Napavine Wildlife Refuge, and the Napavine Museum. The town also has several wineries and vineyards, as well as several farms and ranches.
The town is also home to several businesses, including restaurants, retail stores, and service providers. The town is also home to several manufacturing companies, including a furniture factory and a woodworking shop.
Demographics
As of the 2010 census, the population of Napavine was 1,845. The population is mostly white (94.3%), with small percentages of African American (1.2%), Native American (1.1%), Asian (0.7%), and other races (2.7%). The median household income in Napavine is $45,000, and the median age is 39.
Conclusion
Napavine, Washington is a small town with a rich history and a bright future. The town is home to several tourist attractions, businesses, and farms, and is a popular destination for visitors and residents alike. The town has a diverse population and a strong economy, and is a great place to live and work.
Common Questions
What is Per Capita Income in Napavine?
Per Capita income in Napavine is $31,873.
What is the Median Family Income in Napavine?
Median Family Income in Napavine is $90,729.
What is the Median Household income in Napavine?
Median Household Income in Napavine is $70,833.
What is Income or Wage Gap in Napavine?
Income or Wage Gap in Napavine is 32.9%.
Women in Napavine earn 67.1 cents for every dollar earned by a man.
What is Inequality or Gini Index in Napavine?
Inequality or Gini Index in Napavine is 0.37.
What is the Total Population of Napavine?
Total Population of Napavine is 1,700.
What is the Total Male Population of Napavine?
Total Male Population of Napavine is 891.
What is the Total Female Population of Napavine?
Total Female Population of Napavine is 809.
What is the Ratio of Males per 100 Females in Napavine?
There are 110.14 Males per 100 Females in Napavine.
What is the Ratio of Females per 100 Males in Napavine?
There are 90.80 Females per 100 Males in Napavine.
What is the Median Population Age in Napavine?
Median Population Age in Napavine is 34.6 Years.
What is the Average Family Size in Napavine
Average Family Size in Napavine is 3.0 People.
What is the Average Household Size in Napavine
Average Household Size in Napavine is 2.6 People.
How Large is the Labor Force in Napavine?
There are 869 People in the Labor Forcein in Napavine.
What is the Percentage of People in the Labor Force in Napavine?
63.7% of People are in the Labor Force in Napavine.
What is the Unemployment Rate in Napavine?
Unemployment Rate in Napavine is 7.2%.