Zip Codes with the Highest Percentage of Population with a Degree in Education in Washington
RELATED REPORTS & OPTIONS
Education
Washington
Compare Zip Codes
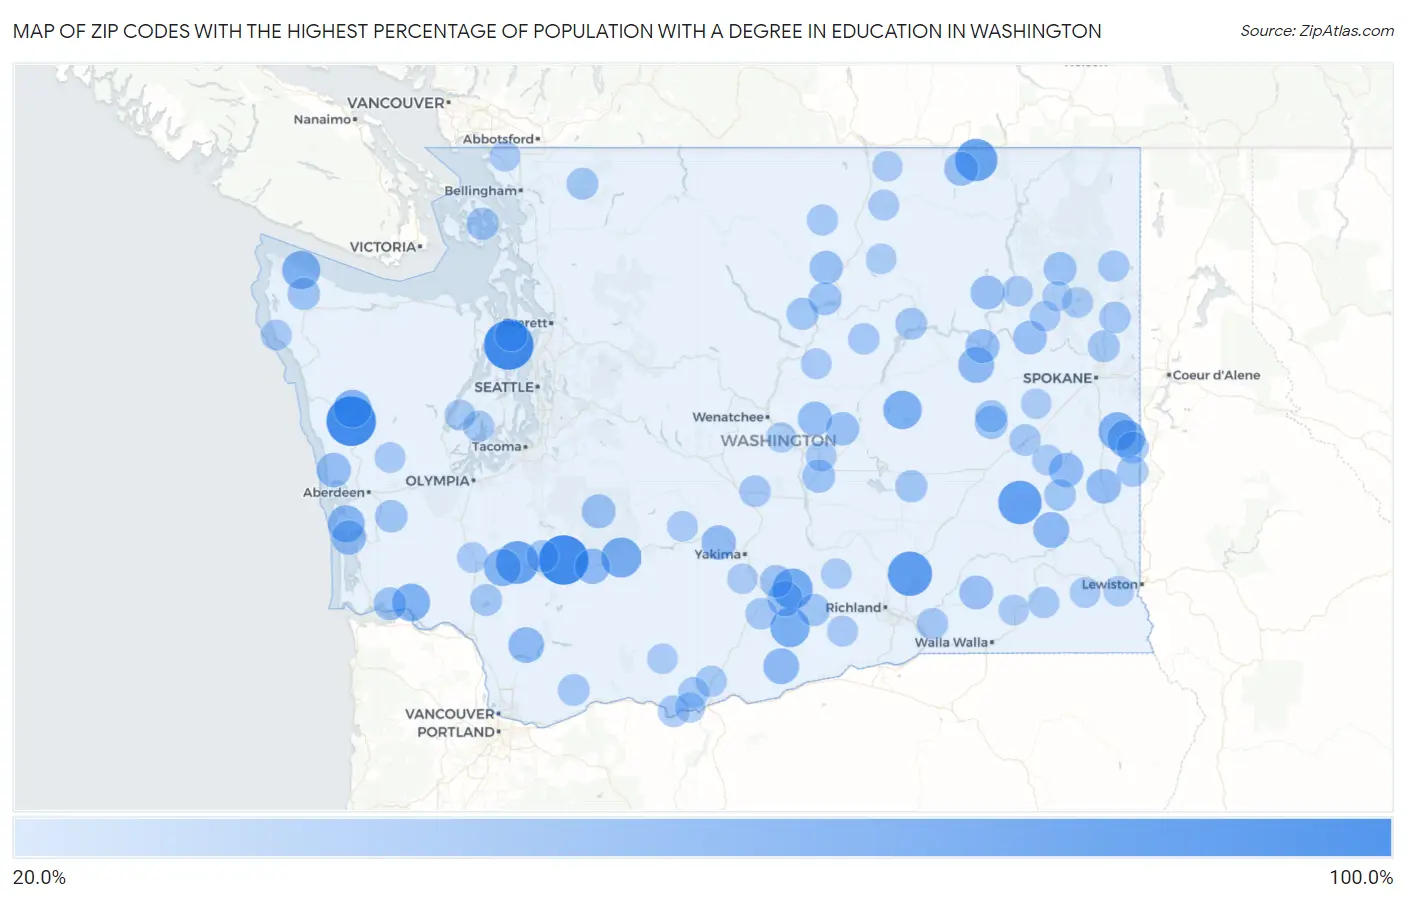
Map of Zip Codes with the Highest Percentage of Population with a Degree in Education in Washington
20.0%
100.0%
Zip Codes with the Highest Percentage of Population with a Degree in Education in Washington
| Zip Code | % Graduates | vs State | vs National | |
| 1. | 98336 | 100.0% | 8.8%(+91.2)#1 | 11.1%(+88.9)#46 |
| 2. | 98566 | 100.0% | 8.8%(+91.2)#2 | 11.1%(+88.9)#107 |
| 3. | 98364 | 100.0% | 8.8%(+91.2)#3 | 11.1%(+88.9)#259 |
| 4. | 99330 | 78.4% | 8.8%(+69.6)#4 | 11.1%(+67.3)#408 |
| 5. | 99105 | 75.0% | 8.8%(+66.2)#5 | 11.1%(+63.9)#460 |
| 6. | 98585 | 72.3% | 8.8%(+63.5)#6 | 11.1%(+61.3)#484 |
| 7. | 99121 | 70.2% | 8.8%(+61.4)#7 | 11.1%(+59.2)#507 |
| 8. | 98938 | 62.9% | 8.8%(+54.1)#8 | 11.1%(+51.9)#665 |
| 9. | 98361 | 61.3% | 8.8%(+52.4)#9 | 11.1%(+50.2)#709 |
| 10. | 98935 | 58.2% | 8.8%(+49.4)#10 | 11.1%(+47.1)#805 |
| 11. | 98860 | 55.1% | 8.8%(+46.3)#11 | 11.1%(+44.0)#916 |
| 12. | 98381 | 53.9% | 8.8%(+45.1)#12 | 11.1%(+42.9)#965 |
| 13. | 99039 | 53.3% | 8.8%(+44.5)#13 | 11.1%(+42.3)#998 |
| 14. | 98526 | 52.9% | 8.8%(+44.1)#14 | 11.1%(+41.9)#1,014 |
| 15. | 99018 | 52.3% | 8.8%(+43.4)#15 | 11.1%(+41.2)#1,046 |
| 16. | 98647 | 52.1% | 8.8%(+43.3)#16 | 11.1%(+41.0)#1,053 |
| 17. | 98582 | 50.0% | 8.8%(+41.2)#17 | 11.1%(+38.9)#1,197 |
| 18. | 98547 | 49.1% | 8.8%(+40.2)#18 | 11.1%(+38.0)#1,275 |
| 19. | 99117 | 44.7% | 8.8%(+35.9)#19 | 11.1%(+33.6)#1,592 |
| 20. | 99143 | 44.5% | 8.8%(+35.7)#20 | 11.1%(+33.4)#1,603 |
| 21. | 99322 | 44.3% | 8.8%(+35.5)#21 | 11.1%(+33.3)#1,633 |
| 22. | 98603 | 44.1% | 8.8%(+35.3)#22 | 11.1%(+33.0)#1,651 |
| 23. | 98377 | 42.4% | 8.8%(+33.6)#23 | 11.1%(+31.3)#1,826 |
| 24. | 98932 | 41.9% | 8.8%(+33.1)#24 | 11.1%(+30.9)#1,872 |
| 25. | 99174 | 40.0% | 8.8%(+31.2)#25 | 11.1%(+28.9)#2,182 |
| 26. | 98923 | 39.5% | 8.8%(+30.7)#26 | 11.1%(+28.4)#2,232 |
| 27. | 98590 | 39.5% | 8.8%(+30.7)#27 | 11.1%(+28.4)#2,235 |
| 28. | 99171 | 39.3% | 8.8%(+30.5)#28 | 11.1%(+28.3)#2,256 |
| 29. | 98535 | 39.0% | 8.8%(+30.2)#29 | 11.1%(+28.0)#2,312 |
| 30. | 98845 | 38.1% | 8.8%(+29.3)#30 | 11.1%(+27.0)#2,462 |
| 31. | 99118 | 37.9% | 8.8%(+29.1)#31 | 11.1%(+26.8)#2,501 |
| 32. | 99147 | 37.5% | 8.8%(+28.7)#32 | 11.1%(+26.4)#2,577 |
| 33. | 98304 | 37.2% | 8.8%(+28.4)#33 | 11.1%(+26.2)#2,625 |
| 34. | 99348 | 36.8% | 8.8%(+28.0)#34 | 11.1%(+25.7)#2,703 |
| 35. | 99040 | 36.7% | 8.8%(+27.9)#35 | 11.1%(+25.6)#2,713 |
| 36. | 99138 | 36.1% | 8.8%(+27.2)#36 | 11.1%(+25.0)#2,813 |
| 37. | 98829 | 35.0% | 8.8%(+26.2)#37 | 11.1%(+23.9)#3,010 |
| 38. | 98823 | 35.0% | 8.8%(+26.1)#38 | 11.1%(+23.9)#3,030 |
| 39. | 99109 | 33.8% | 8.8%(+25.0)#39 | 11.1%(+22.7)#3,324 |
| 40. | 98812 | 33.3% | 8.8%(+24.5)#40 | 11.1%(+22.3)#3,405 |
| 41. | 98824 | 33.3% | 8.8%(+24.5)#41 | 11.1%(+22.3)#3,472 |
| 42. | 99154 | 33.3% | 8.8%(+24.5)#42 | 11.1%(+22.3)#3,507 |
| 43. | 98643 | 32.9% | 8.8%(+24.1)#43 | 11.1%(+21.9)#3,582 |
| 44. | 98340 | 32.2% | 8.8%(+23.4)#44 | 11.1%(+21.2)#3,761 |
| 45. | 98953 | 31.9% | 8.8%(+23.1)#45 | 11.1%(+20.9)#3,859 |
| 46. | 98326 | 31.7% | 8.8%(+22.9)#46 | 11.1%(+20.6)#3,922 |
| 47. | 98537 | 31.6% | 8.8%(+22.7)#47 | 11.1%(+20.5)#3,952 |
| 48. | 98222 | 31.2% | 8.8%(+22.4)#48 | 11.1%(+20.2)#4,057 |
| 49. | 98930 | 31.1% | 8.8%(+22.3)#49 | 11.1%(+20.0)#4,092 |
| 50. | 98857 | 30.4% | 8.8%(+21.6)#50 | 11.1%(+19.4)#4,333 |
| 51. | 98356 | 30.3% | 8.8%(+21.5)#51 | 11.1%(+19.2)#4,369 |
| 52. | 99134 | 29.9% | 8.8%(+21.1)#52 | 11.1%(+18.9)#4,500 |
| 53. | 98846 | 29.4% | 8.8%(+20.6)#53 | 11.1%(+18.4)#4,687 |
| 54. | 99005 | 29.2% | 8.8%(+20.4)#54 | 11.1%(+18.1)#4,792 |
| 55. | 99033 | 29.2% | 8.8%(+20.4)#55 | 11.1%(+18.1)#4,801 |
| 56. | 99125 | 28.7% | 8.8%(+19.9)#56 | 11.1%(+17.7)#4,984 |
| 57. | 99133 | 28.6% | 8.8%(+19.7)#57 | 11.1%(+17.5)#5,040 |
| 58. | 98244 | 28.5% | 8.8%(+19.7)#58 | 11.1%(+17.5)#5,105 |
| 59. | 98645 | 28.4% | 8.8%(+19.6)#59 | 11.1%(+17.3)#5,170 |
| 60. | 98934 | 28.1% | 8.8%(+19.3)#60 | 11.1%(+17.0)#5,277 |
| 61. | 98610 | 28.0% | 8.8%(+19.2)#61 | 11.1%(+17.0)#5,297 |
| 62. | 98617 | 27.8% | 8.8%(+19.0)#62 | 11.1%(+16.8)#5,382 |
| 63. | 98948 | 27.8% | 8.8%(+19.0)#63 | 11.1%(+16.7)#5,403 |
| 64. | 99009 | 27.7% | 8.8%(+18.8)#64 | 11.1%(+16.6)#5,470 |
| 65. | 99032 | 27.6% | 8.8%(+18.8)#65 | 11.1%(+16.6)#5,498 |
| 66. | 99323 | 27.4% | 8.8%(+18.6)#66 | 11.1%(+16.4)#5,588 |
| 67. | 98830 | 27.0% | 8.8%(+18.2)#67 | 11.1%(+15.9)#5,794 |
| 68. | 99180 | 27.0% | 8.8%(+18.1)#68 | 11.1%(+15.9)#5,806 |
| 69. | 99128 | 26.7% | 8.8%(+17.9)#69 | 11.1%(+15.7)#5,912 |
| 70. | 98524 | 26.7% | 8.8%(+17.8)#70 | 11.1%(+15.6)#5,970 |
| 71. | 99328 | 26.5% | 8.8%(+17.7)#71 | 11.1%(+15.5)#6,030 |
| 72. | 98819 | 26.1% | 8.8%(+17.3)#72 | 11.1%(+15.0)#6,263 |
| 73. | 98620 | 26.0% | 8.8%(+17.2)#73 | 11.1%(+14.9)#6,312 |
| 74. | 98613 | 25.4% | 8.8%(+16.5)#74 | 11.1%(+14.3)#6,671 |
| 75. | 98588 | 25.1% | 8.8%(+16.3)#75 | 11.1%(+14.1)#6,785 |
| 76. | 98855 | 25.0% | 8.8%(+16.2)#76 | 11.1%(+14.0)#6,814 |
| 77. | 98350 | 25.0% | 8.8%(+16.2)#77 | 11.1%(+13.9)#6,893 |
| 78. | 99017 | 25.0% | 8.8%(+16.2)#78 | 11.1%(+13.9)#6,913 |
| 79. | 99148 | 24.9% | 8.8%(+16.1)#79 | 11.1%(+13.8)#6,984 |
| 80. | 99350 | 24.9% | 8.8%(+16.0)#80 | 11.1%(+13.8)#7,002 |
| 81. | 98848 | 24.6% | 8.8%(+15.8)#81 | 11.1%(+13.5)#7,162 |
| 82. | 98858 | 24.5% | 8.8%(+15.6)#82 | 11.1%(+13.4)#7,230 |
| 83. | 98563 | 24.5% | 8.8%(+15.6)#83 | 11.1%(+13.4)#7,231 |
| 84. | 98565 | 24.2% | 8.8%(+15.4)#84 | 11.1%(+13.2)#7,368 |
| 85. | 98937 | 24.1% | 8.8%(+15.3)#85 | 11.1%(+13.1)#7,436 |
| 86. | 99347 | 24.0% | 8.8%(+15.2)#86 | 11.1%(+12.9)#7,531 |
| 87. | 99137 | 24.0% | 8.8%(+15.2)#87 | 11.1%(+12.9)#7,539 |
| 88. | 98240 | 24.0% | 8.8%(+15.2)#88 | 11.1%(+12.9)#7,545 |
| 89. | 99173 | 24.0% | 8.8%(+15.1)#89 | 11.1%(+12.9)#7,556 |
| 90. | 98841 | 23.8% | 8.8%(+15.0)#90 | 11.1%(+12.8)#7,658 |
| 91. | 98673 | 23.8% | 8.8%(+15.0)#91 | 11.1%(+12.8)#7,661 |
| 92. | 98619 | 23.7% | 8.8%(+14.9)#92 | 11.1%(+12.7)#7,702 |
| 93. | 98944 | 23.7% | 8.8%(+14.8)#93 | 11.1%(+12.6)#7,760 |
| 94. | 99361 | 23.6% | 8.8%(+14.7)#94 | 11.1%(+12.5)#7,824 |
| 95. | 99181 | 23.5% | 8.8%(+14.7)#95 | 11.1%(+12.4)#7,865 |
| 96. | 99008 | 23.5% | 8.8%(+14.6)#96 | 11.1%(+12.4)#7,907 |
| 97. | 99403 | 23.4% | 8.8%(+14.5)#97 | 11.1%(+12.3)#7,968 |
| 98. | 98951 | 23.3% | 8.8%(+14.5)#98 | 11.1%(+12.2)#8,013 |
| 99. | 98844 | 23.2% | 8.8%(+14.4)#99 | 11.1%(+12.1)#8,071 |
| 100. | 98828 | 22.9% | 8.8%(+14.0)#100 | 11.1%(+11.8)#8,294 |
Common Questions
What are the Top 10 Zip Codes with the Highest Percentage of Population with a Degree in Education in Washington?
Top 10 Zip Codes with the Highest Percentage of Population with a Degree in Education in Washington are:
What zip code has the Highest Percentage of Population with a Degree in Education in Washington?
98336 has the Highest Percentage of Population with a Degree in Education in Washington with 100.0%.
What is the Percentage of Population with a Degree in Education in the State of Washington?
Percentage of Population with a Degree in Education in Washington is 8.8%.
What is the Percentage of Population with a Degree in Education in the United States?
Percentage of Population with a Degree in Education in the United States is 11.1%.