Altoona, WA Map & Demographics
Altoona Map
Altoona Overview
$75,172
PER CAPITA INCOME
$95,417
AVG FAMILY INCOME
$95,417
AVG HOUSEHOLD INCOME
0.32
INEQUALITY / GINI INDEX
53
TOTAL POPULATION
27
MALE POPULATION
26
FEMALE POPULATION
103.85
MALES / 100 FEMALES
96.30
FEMALES / 100 MALES
75.1
MEDIAN AGE
2.1
AVG FAMILY SIZE
2.1
AVG HOUSEHOLD SIZE
21
LABOR FORCE [ PEOPLE ]
39.6%
PERCENT IN LABOR FORCE
23.8%
UNEMPLOYMENT RATE
Income in Altoona
Income Overview in Altoona
Per Capita Income in Altoona is $75,172, while median incomes of families and households are $95,417 and $95,417 respectively.
| Characteristic | Number | Measure |
| Per Capita Income | 53 | $75,172 |
| Median Family Income | 25 | $95,417 |
| Mean Family Income | 25 | $137,140 |
| Median Household Income | 25 | $95,417 |
| Mean Household Income | 25 | $137,140 |
| Income Deficit | 25 | $0 |
| Wage / Income Gap (%) | 53 | 0.00% |
| Wage / Income Gap ($) | 53 | 100.00¢ per $1 |
| Gini / Inequality Index | 53 | 0.32 |
Earnings by Sex in Altoona
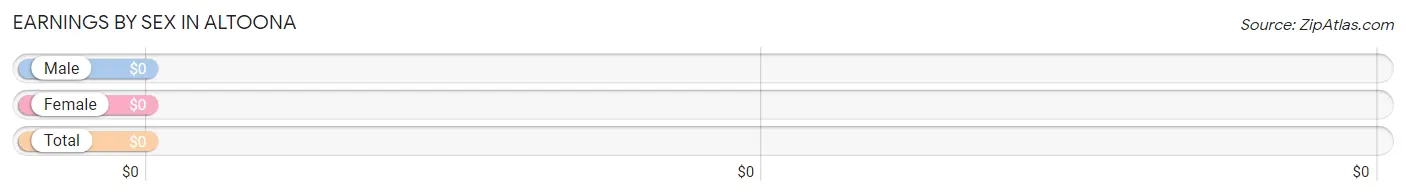
| Sex | Number | Average Earnings |
| Male | 16 (76.2%) | $0 |
| Female | 5 (23.8%) | $0 |
| Total | 21 (100.0%) | $0 |
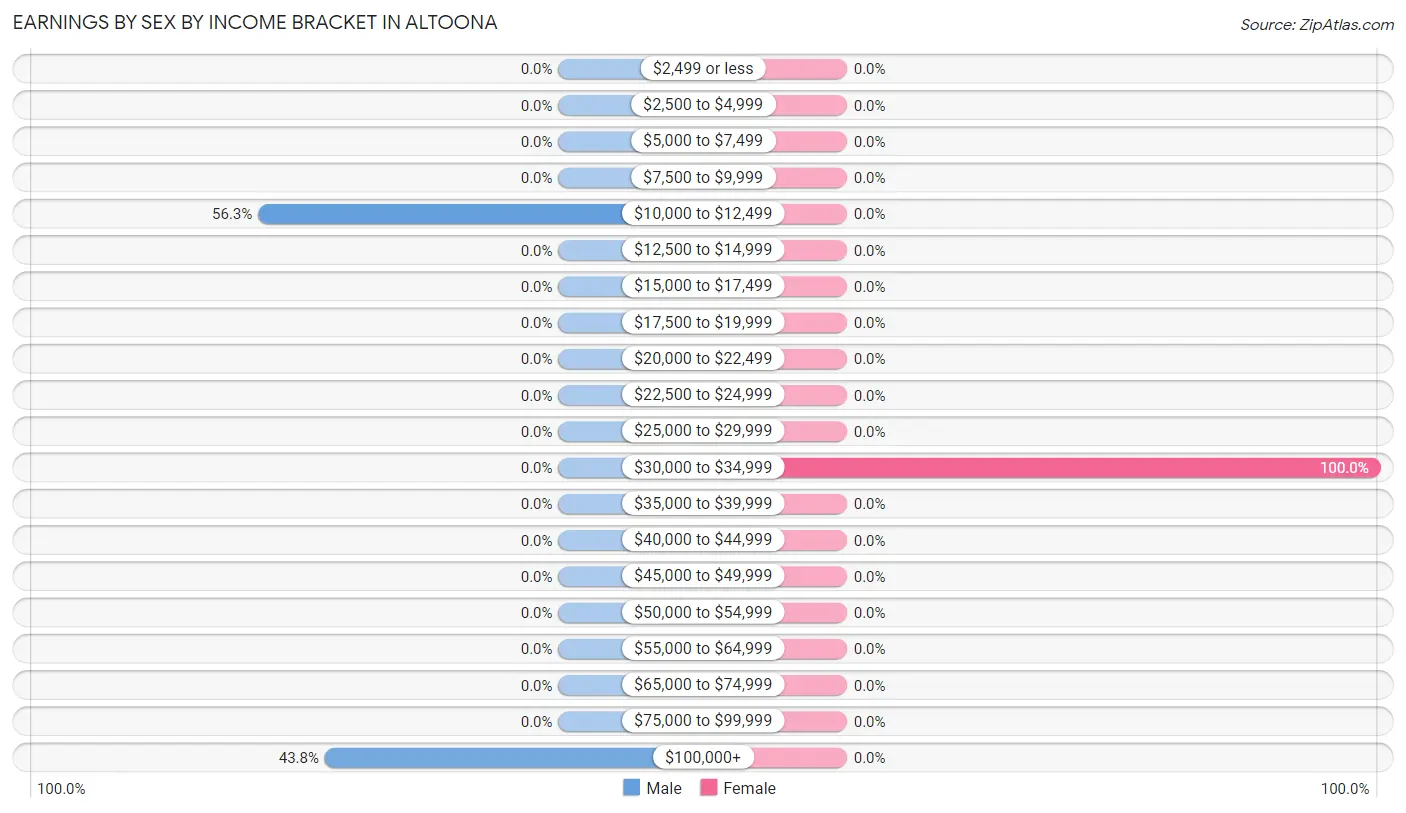
Earnings by Sex by Income Bracket in Altoona
The most common earnings brackets in Altoona are $10,000 to $12,499 for men (9 | 56.2%) and $30,000 to $34,999 for women (5 | 100.0%).
| Income | Male | Female |
| $2,499 or less | 0 (0.0%) | 0 (0.0%) |
| $2,500 to $4,999 | 0 (0.0%) | 0 (0.0%) |
| $5,000 to $7,499 | 0 (0.0%) | 0 (0.0%) |
| $7,500 to $9,999 | 0 (0.0%) | 0 (0.0%) |
| $10,000 to $12,499 | 9 (56.2%) | 0 (0.0%) |
| $12,500 to $14,999 | 0 (0.0%) | 0 (0.0%) |
| $15,000 to $17,499 | 0 (0.0%) | 0 (0.0%) |
| $17,500 to $19,999 | 0 (0.0%) | 0 (0.0%) |
| $20,000 to $22,499 | 0 (0.0%) | 0 (0.0%) |
| $22,500 to $24,999 | 0 (0.0%) | 0 (0.0%) |
| $25,000 to $29,999 | 0 (0.0%) | 0 (0.0%) |
| $30,000 to $34,999 | 0 (0.0%) | 5 (100.0%) |
| $35,000 to $39,999 | 0 (0.0%) | 0 (0.0%) |
| $40,000 to $44,999 | 0 (0.0%) | 0 (0.0%) |
| $45,000 to $49,999 | 0 (0.0%) | 0 (0.0%) |
| $50,000 to $54,999 | 0 (0.0%) | 0 (0.0%) |
| $55,000 to $64,999 | 0 (0.0%) | 0 (0.0%) |
| $65,000 to $74,999 | 0 (0.0%) | 0 (0.0%) |
| $75,000 to $99,999 | 0 (0.0%) | 0 (0.0%) |
| $100,000+ | 7 (43.8%) | 0 (0.0%) |
| Total | 16 (100.0%) | 5 (100.0%) |
Earnings by Sex by Educational Attainment in Altoona
| Educational Attainment | Male Income | Female Income |
| Less than High School | - | - |
| High School Diploma | - | - |
| College or Associate's Degree | - | - |
| Bachelor's Degree | - | - |
| Graduate Degree | - | - |
| Total | - | - |
Family Income in Altoona
Family Income Brackets in Altoona
According to the Altoona family income data, there are 15 families falling into the $75,000 to $99,999 income range, which is the most common income bracket and makes up 60.0% of all families.
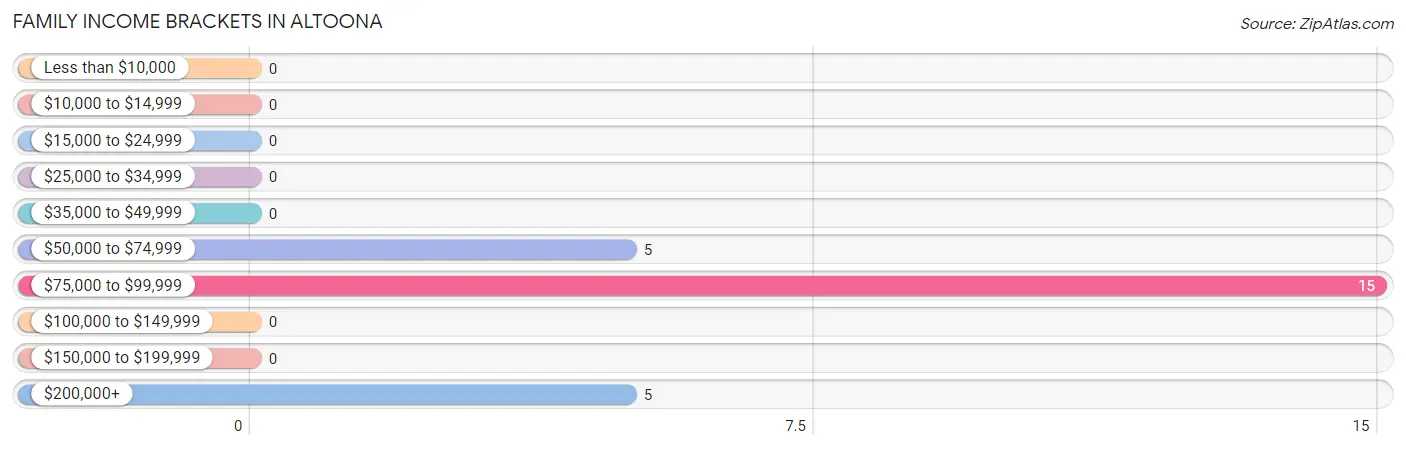
| Income Bracket | # Families | % Families |
| Less than $10,000 | 0 | 0.0% |
| $10,000 to $14,999 | 0 | 0.0% |
| $15,000 to $24,999 | 0 | 0.0% |
| $25,000 to $34,999 | 0 | 0.0% |
| $35,000 to $49,999 | 0 | 0.0% |
| $50,000 to $74,999 | 5 | 20.0% |
| $75,000 to $99,999 | 15 | 60.0% |
| $100,000 to $149,999 | 0 | 0.0% |
| $150,000 to $199,999 | 0 | 0.0% |
| $200,000+ | 5 | 20.0% |
Family Income by Famaliy Size in Altoona
2-person families (25 | 100.0%) account for the highest median family income in Altoona with $95,417 per family, while 2-person families (25 | 100.0%) have the highest median income of $47,708 per family member.
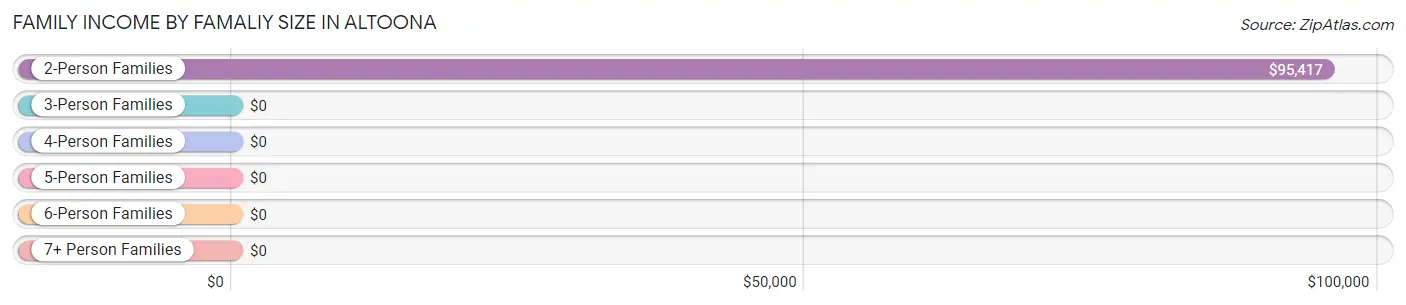
| Income Bracket | # Families | Median Income |
| 2-Person Families | 25 (100.0%) | $95,417 |
| 3-Person Families | 0 (0.0%) | $0 |
| 4-Person Families | 0 (0.0%) | $0 |
| 5-Person Families | 0 (0.0%) | $0 |
| 6-Person Families | 0 (0.0%) | $0 |
| 7+ Person Families | 0 (0.0%) | $0 |
| Total | 25 (100.0%) | $95,417 |
Family Income by Number of Earners in Altoona
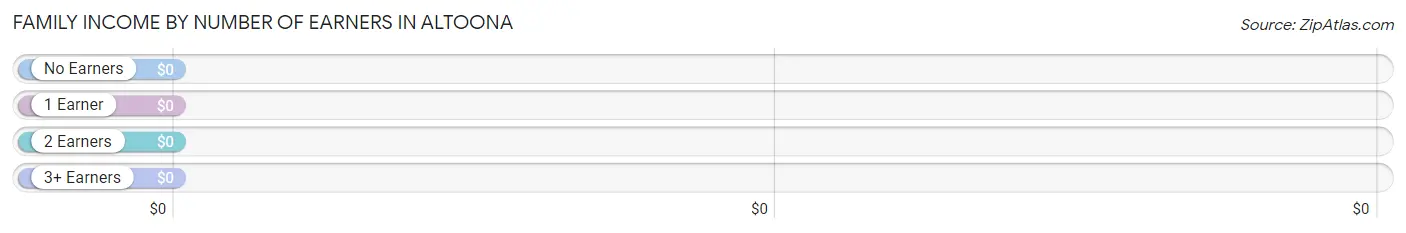
| Number of Earners | # Families | Median Income |
| No Earners | 11 (44.0%) | $0 |
| 1 Earner | 9 (36.0%) | $0 |
| 2 Earners | 5 (20.0%) | $0 |
| 3+ Earners | 0 (0.0%) | $0 |
| Total | 25 (100.0%) | $95,417 |
Household Income in Altoona
Household Income Brackets in Altoona
With 15 households falling in the category, the $75,000 to $99,999 income range is the most frequent in Altoona, accounting for 60.0% of all households.
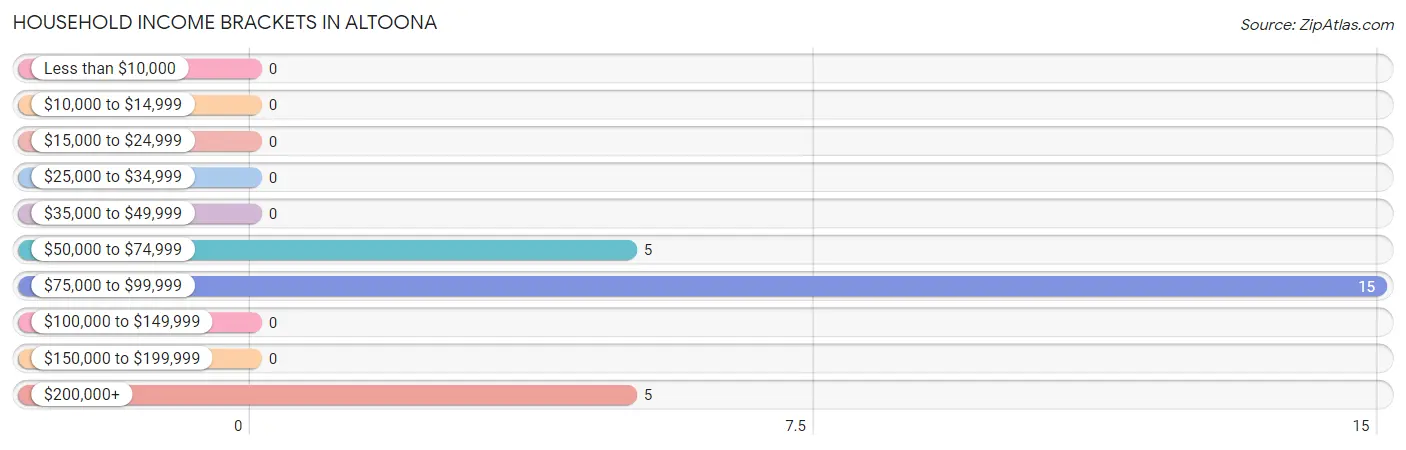
| Income Bracket | # Households | % Households |
| Less than $10,000 | 0 | 0.0% |
| $10,000 to $14,999 | 0 | 0.0% |
| $15,000 to $24,999 | 0 | 0.0% |
| $25,000 to $34,999 | 0 | 0.0% |
| $35,000 to $49,999 | 0 | 0.0% |
| $50,000 to $74,999 | 5 | 20.0% |
| $75,000 to $99,999 | 15 | 60.0% |
| $100,000 to $149,999 | 0 | 0.0% |
| $150,000 to $199,999 | 0 | 0.0% |
| $200,000+ | 5 | 20.0% |
Household Income by Householder Age in Altoona
The median household income in Altoona is $95,417, with the highest median household income of $87,083 found in the 65+ years age bracket for the primary householder. A total of 20 households (80.0%) fall into this category.
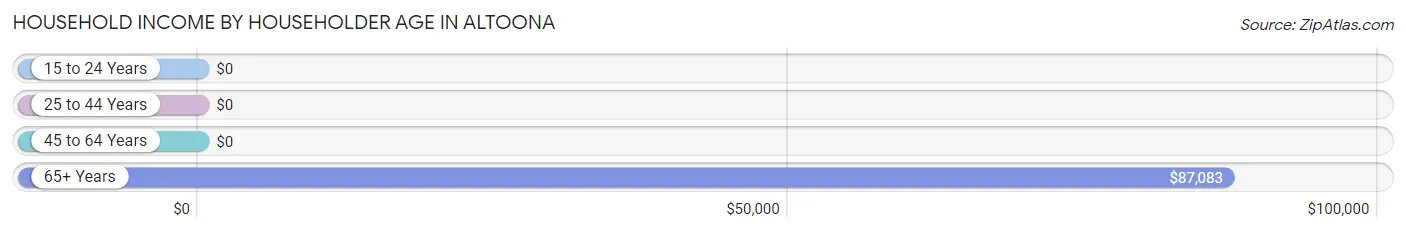
| Income Bracket | # Households | Median Income |
| 15 to 24 Years | 0 (0.0%) | $0 |
| 25 to 44 Years | 0 (0.0%) | $0 |
| 45 to 64 Years | 5 (20.0%) | $0 |
| 65+ Years | 20 (80.0%) | $87,083 |
| Total | 25 (100.0%) | $95,417 |
Poverty in Altoona
Income Below Poverty by Sex and Age in Altoona
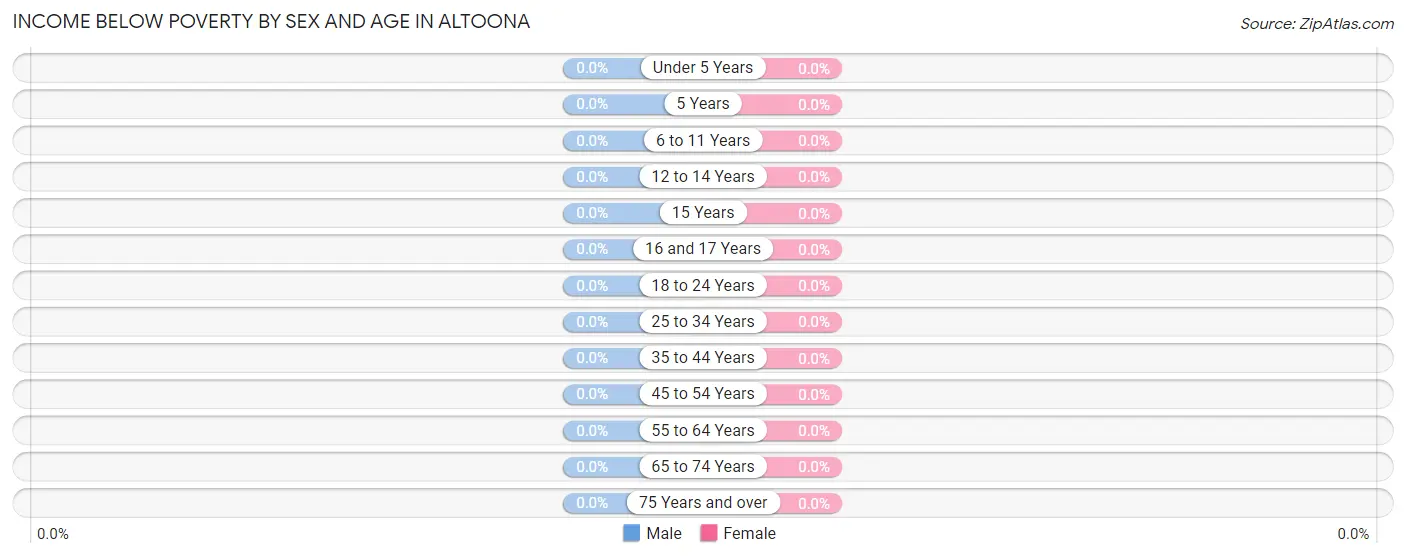
| Age Bracket | Male | Female |
| Under 5 Years | 0 (0.0%) | 0 (0.0%) |
| 5 Years | 0 (0.0%) | 0 (0.0%) |
| 6 to 11 Years | 0 (0.0%) | 0 (0.0%) |
| 12 to 14 Years | 0 (0.0%) | 0 (0.0%) |
| 15 Years | 0 (0.0%) | 0 (0.0%) |
| 16 and 17 Years | 0 (0.0%) | 0 (0.0%) |
| 18 to 24 Years | 0 (0.0%) | 0 (0.0%) |
| 25 to 34 Years | 0 (0.0%) | 0 (0.0%) |
| 35 to 44 Years | 0 (0.0%) | 0 (0.0%) |
| 45 to 54 Years | 0 (0.0%) | 0 (0.0%) |
| 55 to 64 Years | 0 (0.0%) | 0 (0.0%) |
| 65 to 74 Years | 0 (0.0%) | 0 (0.0%) |
| 75 Years and over | 0 (0.0%) | 0 (0.0%) |
| Total | 0 (0.0%) | 0 (0.0%) |
Income Above Poverty by Sex and Age in Altoona
According to the poverty statistics in Altoona, males aged 55 to 64 years and females aged 55 to 64 years are the age groups that are most secure financially, with 100.0% of males and 100.0% of females in these age groups living above the poverty line.
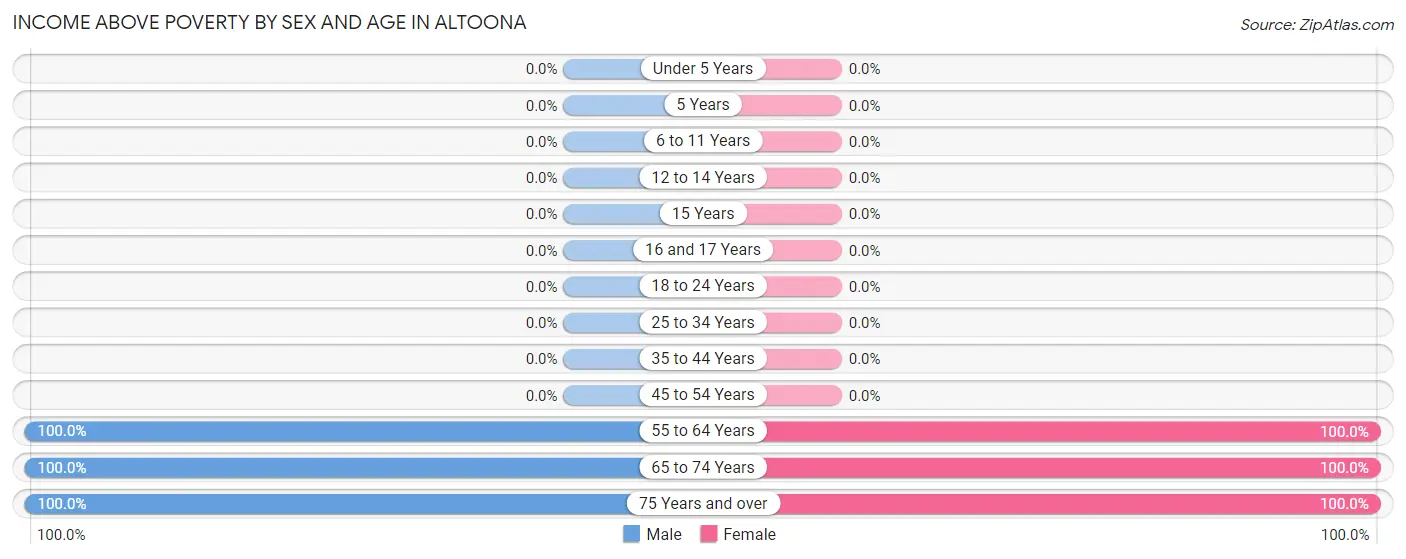
| Age Bracket | Male | Female |
| Under 5 Years | 0 (0.0%) | 0 (0.0%) |
| 5 Years | 0 (0.0%) | 0 (0.0%) |
| 6 to 11 Years | 0 (0.0%) | 0 (0.0%) |
| 12 to 14 Years | 0 (0.0%) | 0 (0.0%) |
| 15 Years | 0 (0.0%) | 0 (0.0%) |
| 16 and 17 Years | 0 (0.0%) | 0 (0.0%) |
| 18 to 24 Years | 0 (0.0%) | 0 (0.0%) |
| 25 to 34 Years | 0 (0.0%) | 0 (0.0%) |
| 35 to 44 Years | 0 (0.0%) | 0 (0.0%) |
| 45 to 54 Years | 0 (0.0%) | 0 (0.0%) |
| 55 to 64 Years | 7 (100.0%) | 5 (100.0%) |
| 65 to 74 Years | 6 (100.0%) | 7 (100.0%) |
| 75 Years and over | 14 (100.0%) | 14 (100.0%) |
| Total | 27 (100.0%) | 26 (100.0%) |
Income Below Poverty Among Married-Couple Families in Altoona
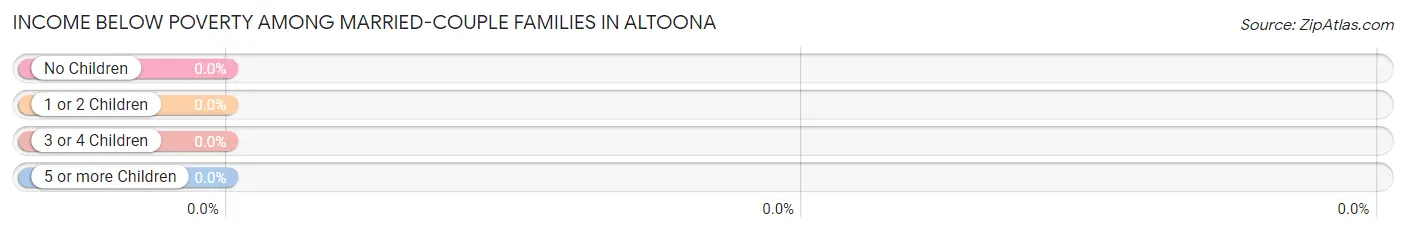
| Children | Above Poverty | Below Poverty |
| No Children | 25 (100.0%) | 0 (0.0%) |
| 1 or 2 Children | 0 (0.0%) | 0 (0.0%) |
| 3 or 4 Children | 0 (0.0%) | 0 (0.0%) |
| 5 or more Children | 0 (0.0%) | 0 (0.0%) |
| Total | 25 (100.0%) | 0 (0.0%) |
Income Below Poverty Among Single-Parent Households in Altoona
| Children | Single Father | Single Mother |
| No Children | 0 (0.0%) | 0 (0.0%) |
| 1 or 2 Children | 0 (0.0%) | 0 (0.0%) |
| 3 or 4 Children | 0 (0.0%) | 0 (0.0%) |
| 5 or more Children | 0 (0.0%) | 0 (0.0%) |
| Total | 0 (0.0%) | 0 (0.0%) |
Income Below Poverty Among Married-Couple vs Single-Parent Households in Altoona
| Children | Married-Couple Families | Single-Parent Households |
| No Children | 0 (0.0%) | 0 (0.0%) |
| 1 or 2 Children | 0 (0.0%) | 0 (0.0%) |
| 3 or 4 Children | 0 (0.0%) | 0 (0.0%) |
| 5 or more Children | 0 (0.0%) | 0 (0.0%) |
| Total | 0 (0.0%) | 0 (0.0%) |
Race in Altoona
The most populous races in Altoona are White / Caucasian (48 | 90.6%), and Two or more Races (5 | 9.4%).
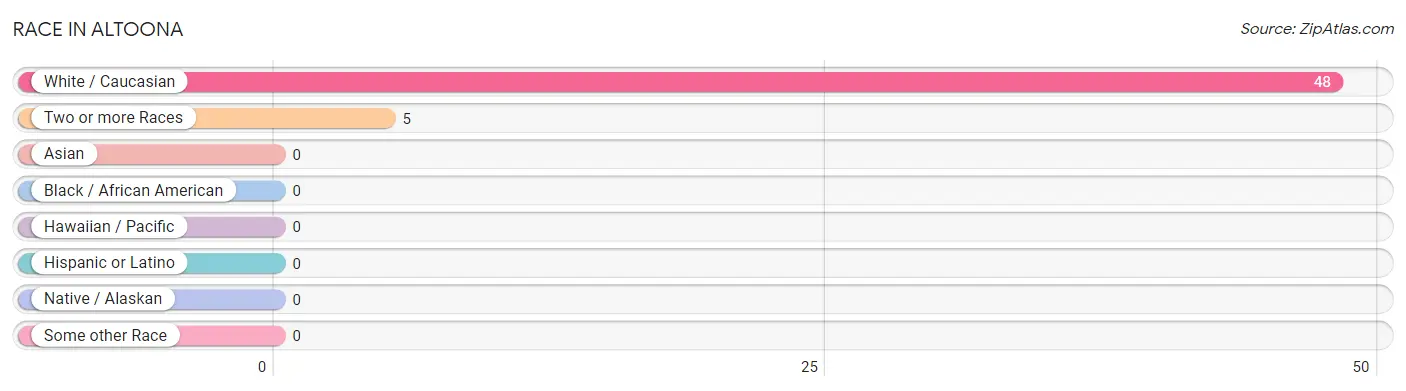
| Race | # Population | % Population |
| Asian | 0 | 0.0% |
| Black / African American | 0 | 0.0% |
| Hawaiian / Pacific | 0 | 0.0% |
| Hispanic or Latino | 0 | 0.0% |
| Native / Alaskan | 0 | 0.0% |
| White / Caucasian | 48 | 90.6% |
| Two or more Races | 5 | 9.4% |
| Some other Race | 0 | 0.0% |
| Total | 53 | 100.0% |
Ancestry in Altoona
The most populous ancestries reported in Altoona are English (25 | 47.2%), Irish (21 | 39.6%), German (14 | 26.4%), Scandinavian (10 | 18.9%), and European (7 | 13.2%), together accounting for 145.3% of all Altoona residents.
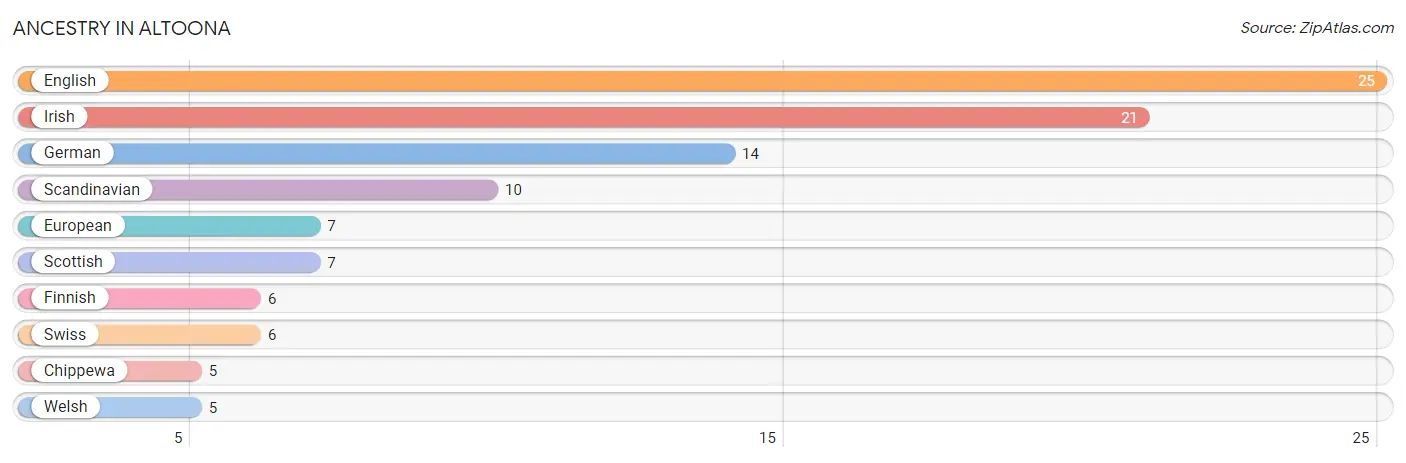
| Ancestry | # Population | % Population |
| Chippewa | 5 | 9.4% |
| English | 25 | 47.2% |
| European | 7 | 13.2% |
| Finnish | 6 | 11.3% |
| German | 14 | 26.4% |
| Irish | 21 | 39.6% |
| Scandinavian | 10 | 18.9% |
| Scottish | 7 | 13.2% |
| Swiss | 6 | 11.3% |
| Welsh | 5 | 9.4% | View All 10 Rows |
Immigrants in Altoona

| Immigration Origin | # Population | % Population | View All 0 Rows |
Sex and Age in Altoona
Sex and Age in Altoona
The most populous age groups in Altoona are 75 to 79 Years (14 | 51.8%) for men and 75 to 79 Years (14 | 53.8%) for women.
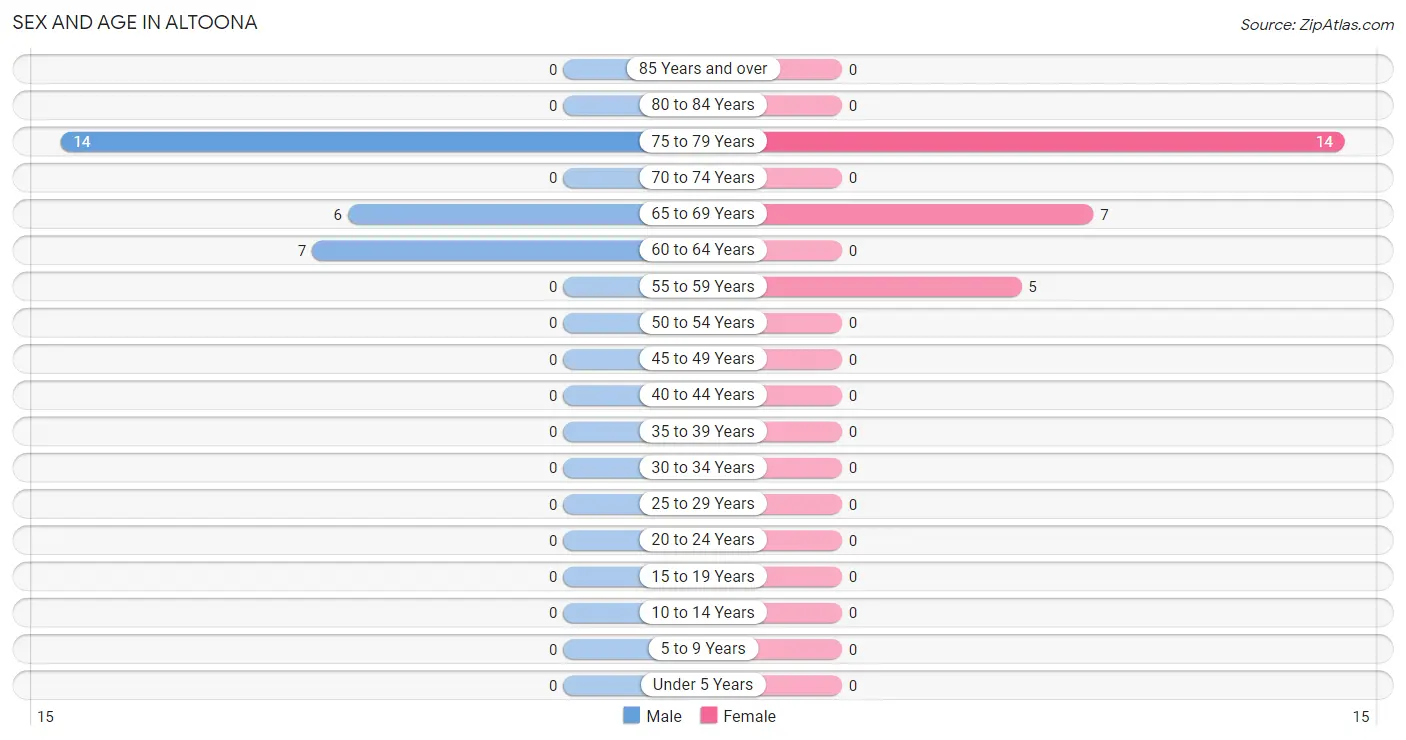
| Age Bracket | Male | Female |
| Under 5 Years | 0 (0.0%) | 0 (0.0%) |
| 5 to 9 Years | 0 (0.0%) | 0 (0.0%) |
| 10 to 14 Years | 0 (0.0%) | 0 (0.0%) |
| 15 to 19 Years | 0 (0.0%) | 0 (0.0%) |
| 20 to 24 Years | 0 (0.0%) | 0 (0.0%) |
| 25 to 29 Years | 0 (0.0%) | 0 (0.0%) |
| 30 to 34 Years | 0 (0.0%) | 0 (0.0%) |
| 35 to 39 Years | 0 (0.0%) | 0 (0.0%) |
| 40 to 44 Years | 0 (0.0%) | 0 (0.0%) |
| 45 to 49 Years | 0 (0.0%) | 0 (0.0%) |
| 50 to 54 Years | 0 (0.0%) | 0 (0.0%) |
| 55 to 59 Years | 0 (0.0%) | 5 (19.2%) |
| 60 to 64 Years | 7 (25.9%) | 0 (0.0%) |
| 65 to 69 Years | 6 (22.2%) | 7 (26.9%) |
| 70 to 74 Years | 0 (0.0%) | 0 (0.0%) |
| 75 to 79 Years | 14 (51.8%) | 14 (53.8%) |
| 80 to 84 Years | 0 (0.0%) | 0 (0.0%) |
| 85 Years and over | 0 (0.0%) | 0 (0.0%) |
| Total | 27 (100.0%) | 26 (100.0%) |
Families and Households in Altoona
Median Family Size in Altoona
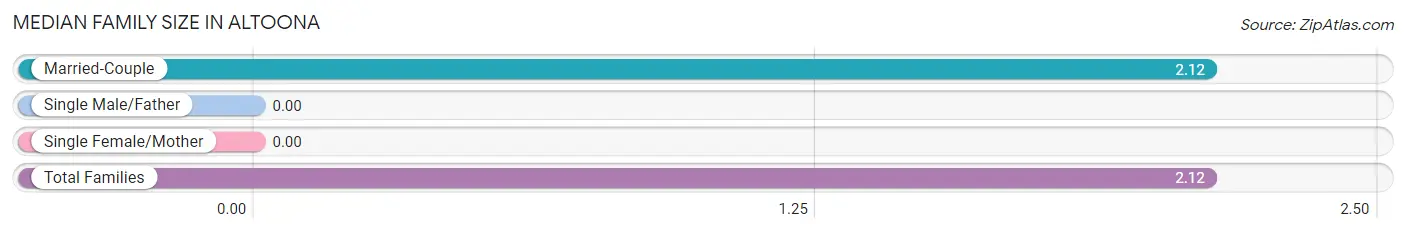
| Family Type | # Families | Family Size |
| Married-Couple | 25 (100.0%) | 2.12 |
| Single Male/Father | 0 (0.0%) | - |
| Single Female/Mother | 0 (0.0%) | - |
| Total Families | 25 (100.0%) | 2.12 |
Median Household Size in Altoona
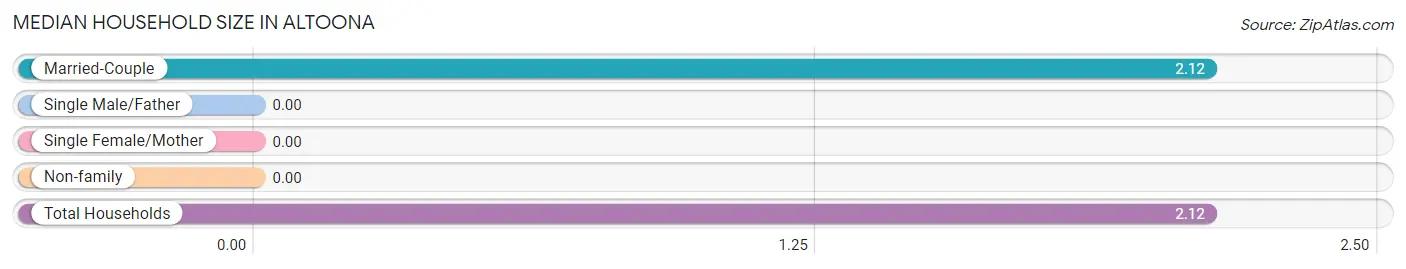
| Household Type | # Households | Household Size |
| Married-Couple | 25 (100.0%) | 2.12 |
| Single Male/Father | 0 (0.0%) | - |
| Single Female/Mother | 0 (0.0%) | - |
| Non-family | 0 (0.0%) | - |
| Total Households | 25 (100.0%) | 2.12 |
Household Size by Marriage Status in Altoona
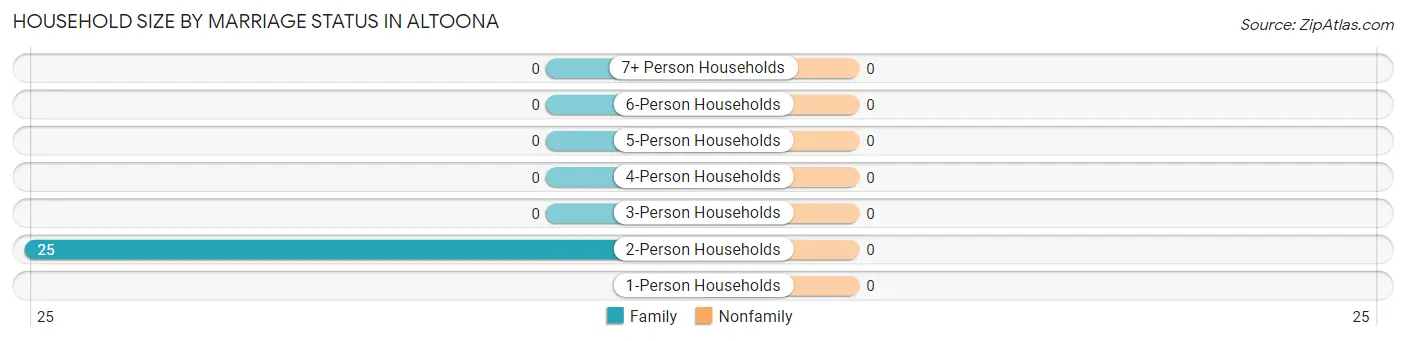
| Household Size | Family Households | Nonfamily Households |
| 1-Person Households | - | 0 (0.0%) |
| 2-Person Households | 25 (100.0%) | 0 (0.0%) |
| 3-Person Households | 0 (0.0%) | 0 (0.0%) |
| 4-Person Households | 0 (0.0%) | 0 (0.0%) |
| 5-Person Households | 0 (0.0%) | 0 (0.0%) |
| 6-Person Households | 0 (0.0%) | 0 (0.0%) |
| 7+ Person Households | 0 (0.0%) | 0 (0.0%) |
| Total | 25 (100.0%) | 0 (0.0%) |
Female Fertility in Altoona
Fertility by Age in Altoona
| Age Bracket | Women with Births | Births / 1,000 Women |
| 15 to 19 years | 0 (0.0%) | 0.0 |
| 20 to 34 years | 0 (0.0%) | 0.0 |
| 35 to 50 years | 0 (0.0%) | 0.0 |
| Total | 0 (0.0%) | 0.0 |
Fertility by Age by Marriage Status in Altoona
| Age Bracket | Married | Unmarried |
| 15 to 19 years | 0 (0.0%) | 0 (0.0%) |
| 20 to 34 years | 0 (0.0%) | 0 (0.0%) |
| 35 to 50 years | 0 (0.0%) | 0 (0.0%) |
| Total | 0 (0.0%) | 0 (0.0%) |
Fertility by Education in Altoona
| Educational Attainment | Women with Births | Births / 1,000 Women |
| Less than High School | 0 (0.0%) | 0.0 |
| High School Diploma | 0 (0.0%) | 0.0 |
| College or Associate's Degree | 0 (0.0%) | 0.0 |
| Bachelor's Degree | 0 (0.0%) | 0.0 |
| Graduate Degree | 0 (0.0%) | 0.0 |
| Total | 0 (0.0%) | 0.0 |
Fertility by Education by Marriage Status in Altoona
| Educational Attainment | Married | Unmarried |
| Less than High School | 0 (0.0%) | 0 (0.0%) |
| High School Diploma | 0 (0.0%) | 0 (0.0%) |
| College or Associate's Degree | 0 (0.0%) | 0 (0.0%) |
| Bachelor's Degree | 0 (0.0%) | 0 (0.0%) |
| Graduate Degree | 0 (0.0%) | 0 (0.0%) |
| Total | 0 (0.0%) | 0 (0.0%) |
Employment Characteristics in Altoona
Employment by Class of Employer in Altoona
Among the 16 employed individuals in Altoona, private company employees (9 | 56.2%), and self-employed (not incorporated) (7 | 43.8%) make up the most common classes of employment.
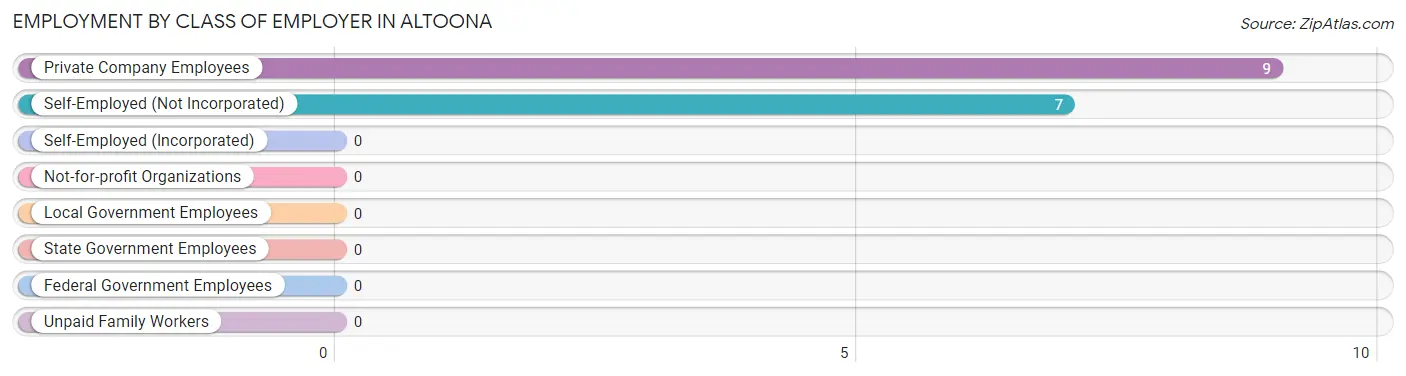
| Employer Class | # Employees | % Employees |
| Private Company Employees | 9 | 56.2% |
| Self-Employed (Incorporated) | 0 | 0.0% |
| Self-Employed (Not Incorporated) | 7 | 43.8% |
| Not-for-profit Organizations | 0 | 0.0% |
| Local Government Employees | 0 | 0.0% |
| State Government Employees | 0 | 0.0% |
| Federal Government Employees | 0 | 0.0% |
| Unpaid Family Workers | 0 | 0.0% |
| Total | 16 | 100.0% |
Employment Status by Age in Altoona
According to the labor force statistics for Altoona, out of the total population over 16 years of age (53), 39.6% or 21 individuals are in the labor force, with 23.8% or 5 of them unemployed. The age group with the highest labor force participation rate is 55 to 59 years, with 100.0% or 5 individuals in the labor force. Within the labor force, the 55 to 59 years age range has the highest percentage of unemployed individuals, with 100.0% or 5 of them being unemployed.
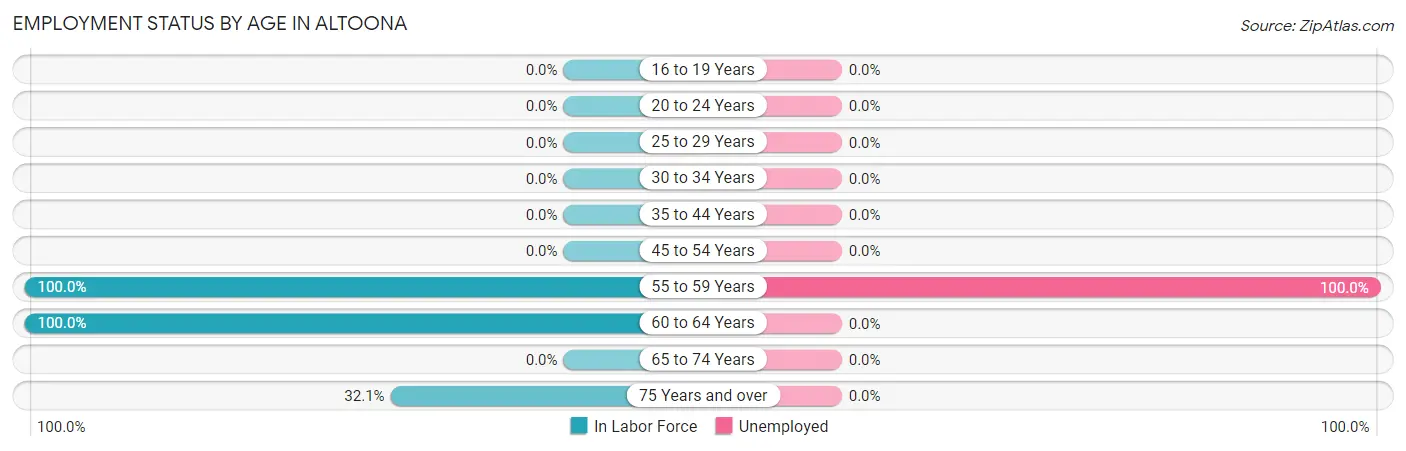
| Age Bracket | In Labor Force | Unemployed |
| 16 to 19 Years | 0 (0.0%) | 0 (0.0%) |
| 20 to 24 Years | 0 (0.0%) | 0 (0.0%) |
| 25 to 29 Years | 0 (0.0%) | 0 (0.0%) |
| 30 to 34 Years | 0 (0.0%) | 0 (0.0%) |
| 35 to 44 Years | 0 (0.0%) | 0 (0.0%) |
| 45 to 54 Years | 0 (0.0%) | 0 (0.0%) |
| 55 to 59 Years | 5 (100.0%) | 5 (100.0%) |
| 60 to 64 Years | 7 (100.0%) | 0 (0.0%) |
| 65 to 74 Years | 0 (0.0%) | 0 (0.0%) |
| 75 Years and over | 9 (32.1%) | 0 (0.0%) |
| Total | 21 (39.6%) | 5 (23.8%) |
Employment Status by Educational Attainment in Altoona
According to labor force statistics for Altoona, 100.0% of individuals (12) out of the total population between 25 and 64 years of age (12) are in the labor force, with 41.7% or 5 of them being unemployed. The group with the highest labor force participation rate are those with the educational attainment of college / associate degree, with 100.0% or 5 individuals in the labor force. Within the labor force, individuals with college / associate degree education have the highest percentage of unemployment, with 100.0% or 5 of them being unemployed.
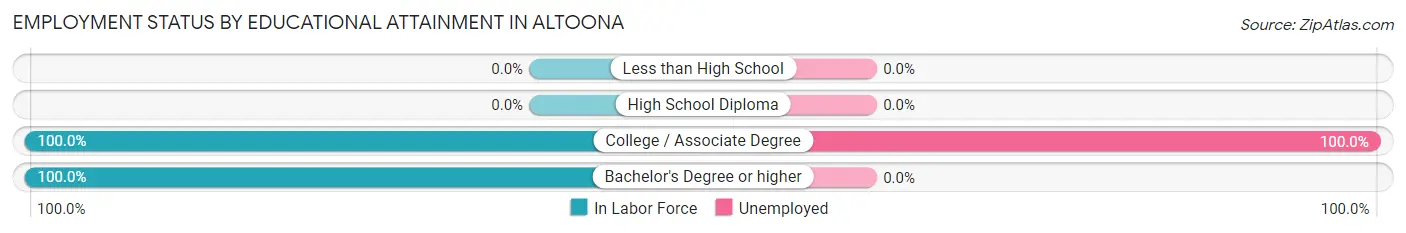
| Educational Attainment | In Labor Force | Unemployed |
| Less than High School | 0 (0.0%) | 0 (0.0%) |
| High School Diploma | 0 (0.0%) | 0 (0.0%) |
| College / Associate Degree | 5 (100.0%) | 5 (100.0%) |
| Bachelor's Degree or higher | 7 (100.0%) | 0 (0.0%) |
| Total | 12 (100.0%) | 5 (41.7%) |
Employment Occupations by Sex in Altoona
Management, Business, Science and Arts Occupations
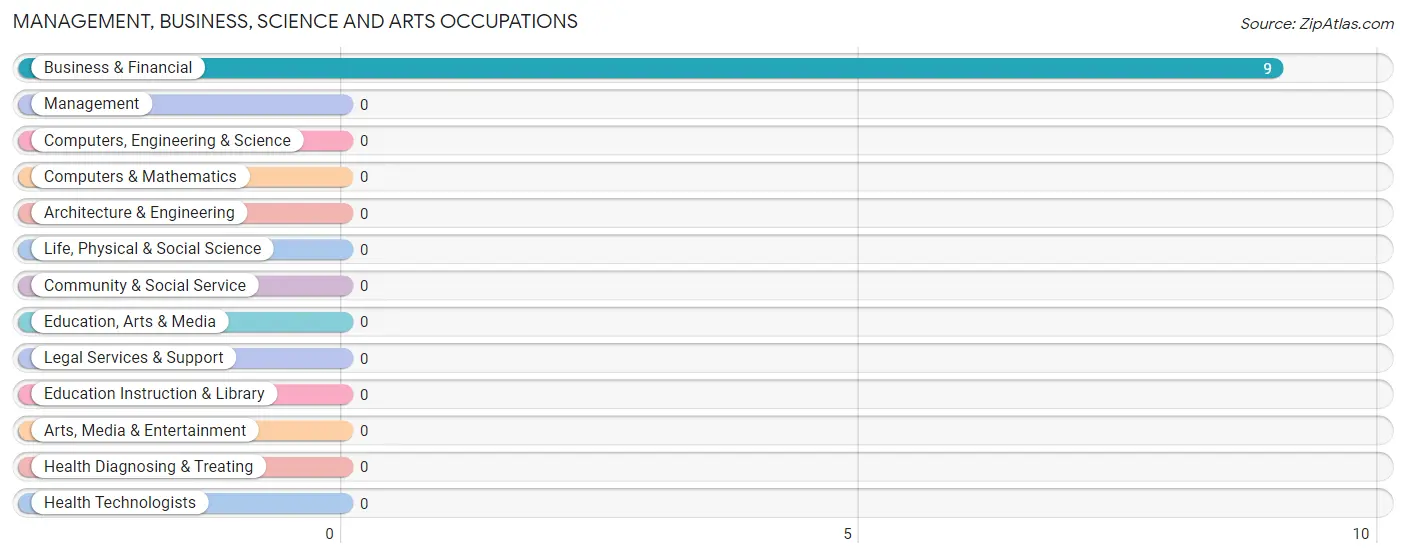
The most common Management, Business, Science and Arts occupations in Altoona are , and Business & Financial (9 | 56.2%).
Management, Business, Science and Arts Occupations by Sex
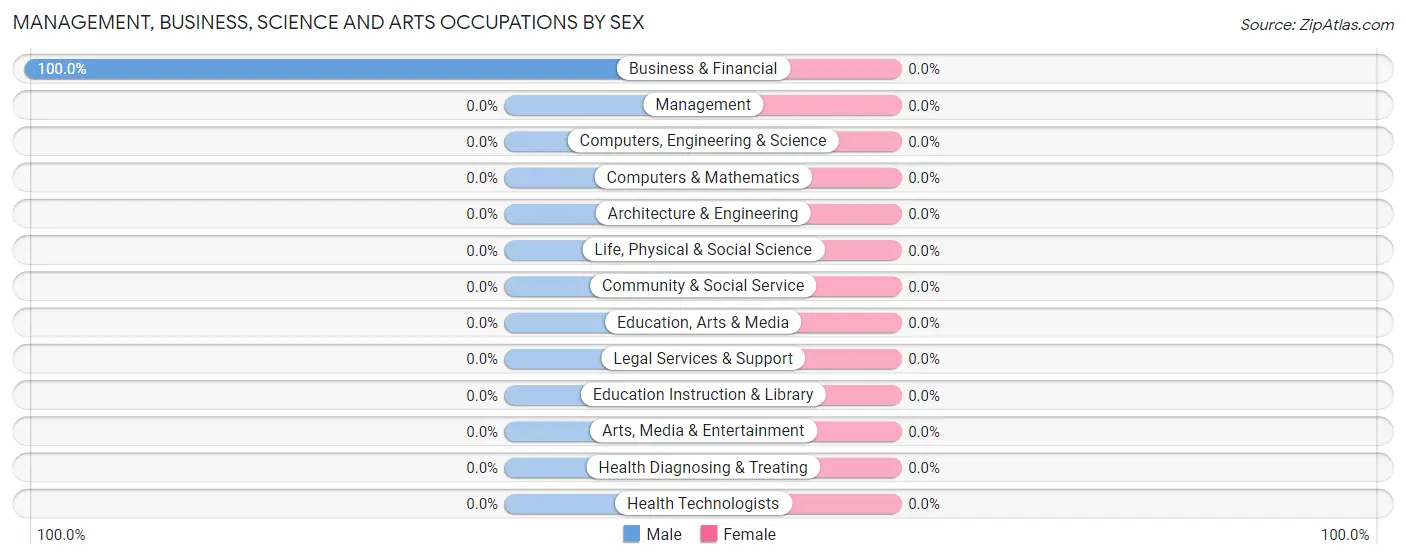
| Occupation | Male | Female |
| Management | 0 (0.0%) | 0 (0.0%) |
| Business & Financial | 9 (100.0%) | 0 (0.0%) |
| Computers, Engineering & Science | 0 (0.0%) | 0 (0.0%) |
| Computers & Mathematics | 0 (0.0%) | 0 (0.0%) |
| Architecture & Engineering | 0 (0.0%) | 0 (0.0%) |
| Life, Physical & Social Science | 0 (0.0%) | 0 (0.0%) |
| Community & Social Service | 0 (0.0%) | 0 (0.0%) |
| Education, Arts & Media | 0 (0.0%) | 0 (0.0%) |
| Legal Services & Support | 0 (0.0%) | 0 (0.0%) |
| Education Instruction & Library | 0 (0.0%) | 0 (0.0%) |
| Arts, Media & Entertainment | 0 (0.0%) | 0 (0.0%) |
| Health Diagnosing & Treating | 0 (0.0%) | 0 (0.0%) |
| Health Technologists | 0 (0.0%) | 0 (0.0%) |
| Total (Category) | 9 (100.0%) | 0 (0.0%) |
| Total (Overall) | 16 (100.0%) | 0 (0.0%) |
Services Occupations
Services Occupations by Sex
| Occupation | Male | Female |
| Healthcare Support | 0 (0.0%) | 0 (0.0%) |
| Security & Protection | 0 (0.0%) | 0 (0.0%) |
| Firefighting & Prevention | 0 (0.0%) | 0 (0.0%) |
| Law Enforcement | 0 (0.0%) | 0 (0.0%) |
| Food Preparation & Serving | 0 (0.0%) | 0 (0.0%) |
| Cleaning & Maintenance | 0 (0.0%) | 0 (0.0%) |
| Personal Care & Service | 0 (0.0%) | 0 (0.0%) |
| Total (Category) | 0 (0.0%) | 0 (0.0%) |
| Total (Overall) | 16 (100.0%) | 0 (0.0%) |
Sales and Office Occupations
Sales and Office Occupations by Sex
| Occupation | Male | Female |
| Sales & Related | 0 (0.0%) | 0 (0.0%) |
| Office & Administration | 0 (0.0%) | 0 (0.0%) |
| Total (Category) | 0 (0.0%) | 0 (0.0%) |
| Total (Overall) | 16 (100.0%) | 0 (0.0%) |
Natural Resources, Construction and Maintenance Occupations
The most common Natural Resources, Construction and Maintenance occupations in Altoona are , and Farming, Fishing & Forestry (7 | 43.8%).
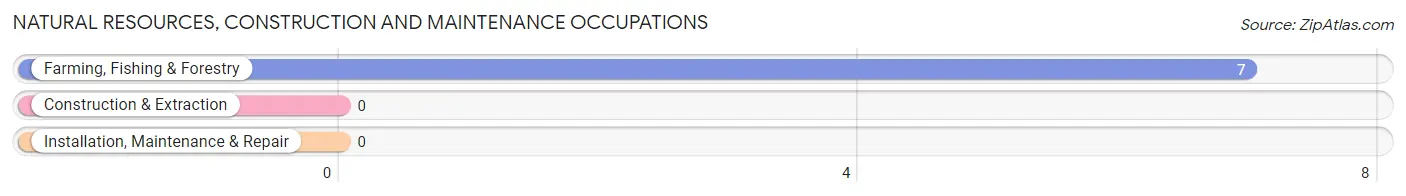
Natural Resources, Construction and Maintenance Occupations by Sex
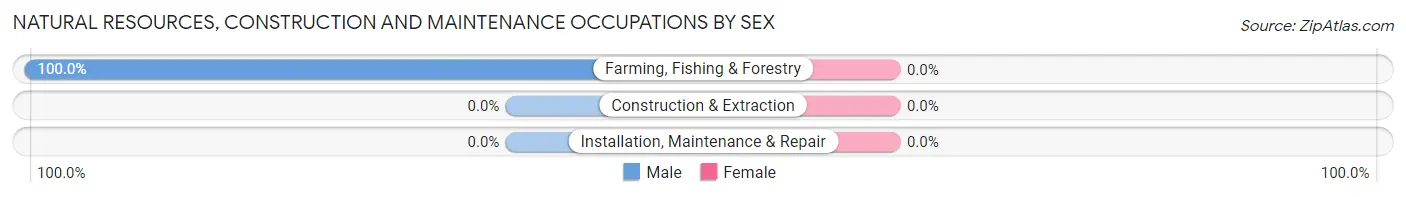
| Occupation | Male | Female |
| Farming, Fishing & Forestry | 7 (100.0%) | 0 (0.0%) |
| Construction & Extraction | 0 (0.0%) | 0 (0.0%) |
| Installation, Maintenance & Repair | 0 (0.0%) | 0 (0.0%) |
| Total (Category) | 7 (100.0%) | 0 (0.0%) |
| Total (Overall) | 16 (100.0%) | 0 (0.0%) |
Production, Transportation and Moving Occupations
Production, Transportation and Moving Occupations by Sex
| Occupation | Male | Female |
| Production | 0 (0.0%) | 0 (0.0%) |
| Transportation | 0 (0.0%) | 0 (0.0%) |
| Material Moving | 0 (0.0%) | 0 (0.0%) |
| Total (Category) | 0 (0.0%) | 0 (0.0%) |
| Total (Overall) | 16 (100.0%) | 0 (0.0%) |
Employment Industries by Sex in Altoona
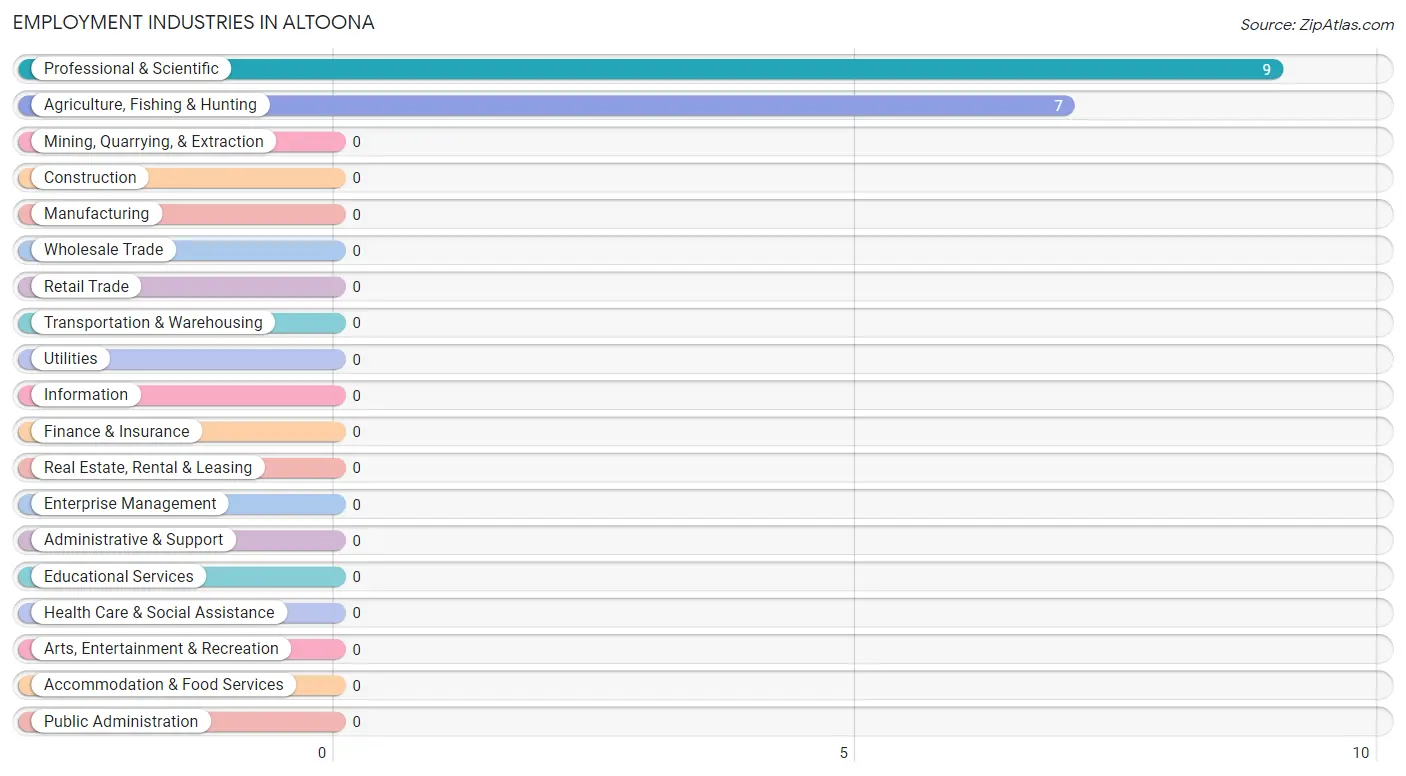
Employment Industries in Altoona
The major employment industries in Altoona include Professional & Scientific (9 | 56.2%), and Agriculture, Fishing & Hunting (7 | 43.8%).
Employment Industries by Sex in Altoona
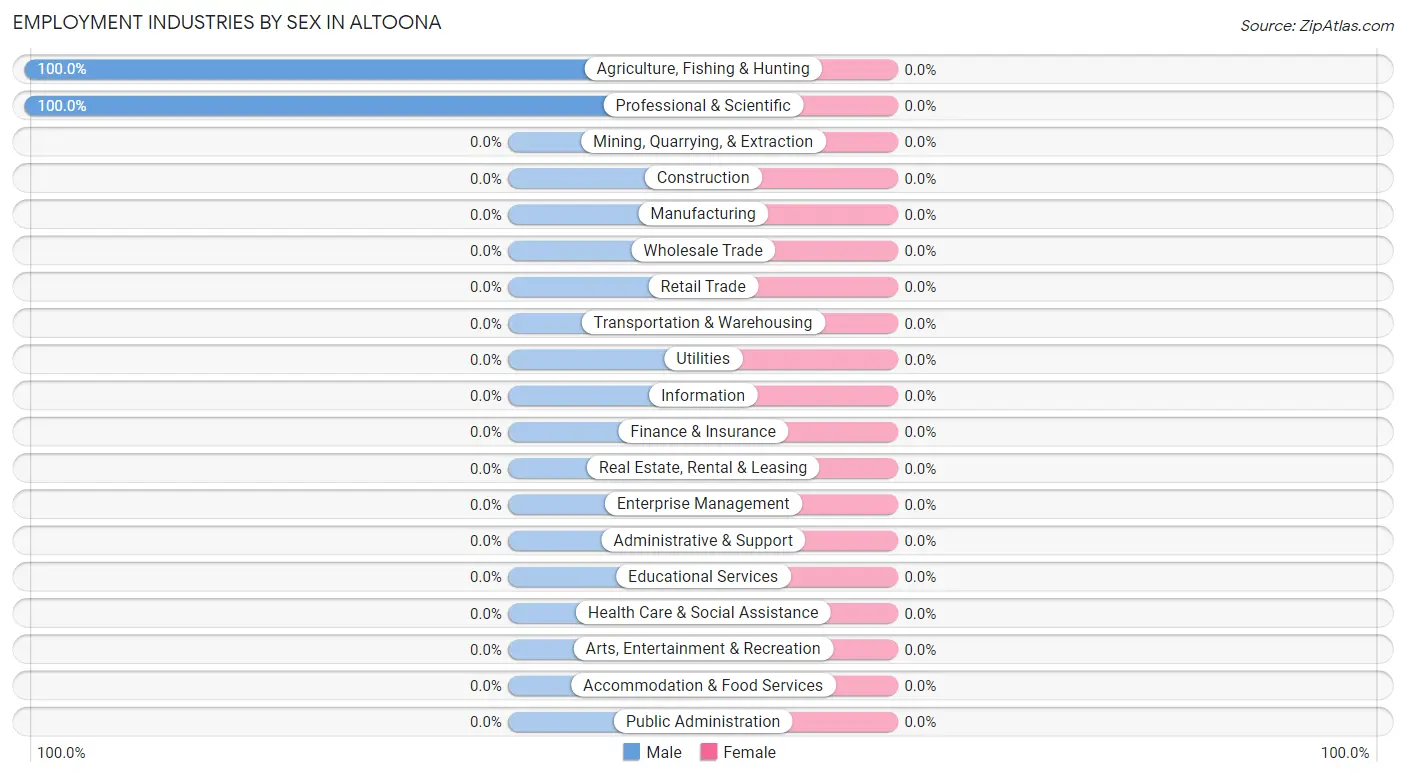
| Industry | Male | Female |
| Agriculture, Fishing & Hunting | 7 (100.0%) | 0 (0.0%) |
| Mining, Quarrying, & Extraction | 0 (0.0%) | 0 (0.0%) |
| Construction | 0 (0.0%) | 0 (0.0%) |
| Manufacturing | 0 (0.0%) | 0 (0.0%) |
| Wholesale Trade | 0 (0.0%) | 0 (0.0%) |
| Retail Trade | 0 (0.0%) | 0 (0.0%) |
| Transportation & Warehousing | 0 (0.0%) | 0 (0.0%) |
| Utilities | 0 (0.0%) | 0 (0.0%) |
| Information | 0 (0.0%) | 0 (0.0%) |
| Finance & Insurance | 0 (0.0%) | 0 (0.0%) |
| Real Estate, Rental & Leasing | 0 (0.0%) | 0 (0.0%) |
| Professional & Scientific | 9 (100.0%) | 0 (0.0%) |
| Enterprise Management | 0 (0.0%) | 0 (0.0%) |
| Administrative & Support | 0 (0.0%) | 0 (0.0%) |
| Educational Services | 0 (0.0%) | 0 (0.0%) |
| Health Care & Social Assistance | 0 (0.0%) | 0 (0.0%) |
| Arts, Entertainment & Recreation | 0 (0.0%) | 0 (0.0%) |
| Accommodation & Food Services | 0 (0.0%) | 0 (0.0%) |
| Public Administration | 0 (0.0%) | 0 (0.0%) |
| Total | 16 (100.0%) | 0 (0.0%) |
Education in Altoona
School Enrollment in Altoona
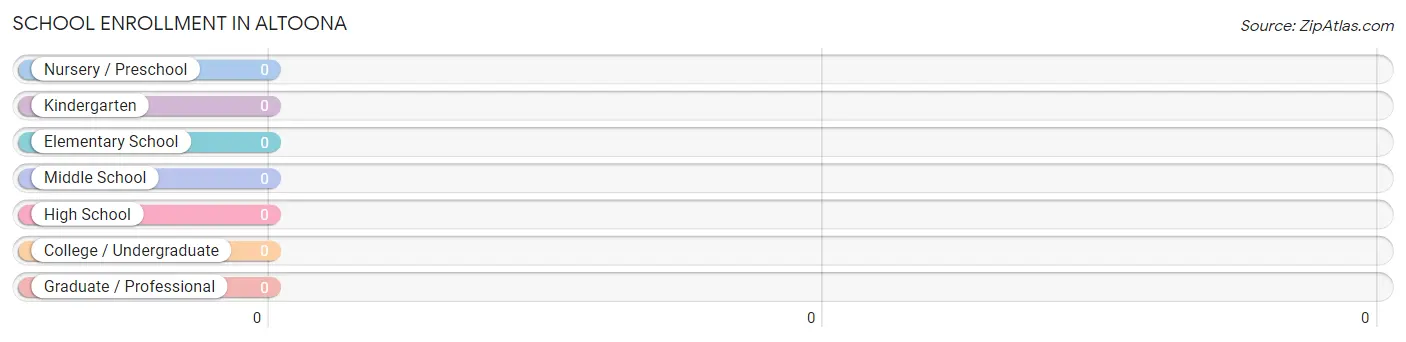
| School Level | # Students | % Students |
| Nursery / Preschool | 0 | 0.0% |
| Kindergarten | 0 | 0.0% |
| Elementary School | 0 | 0.0% |
| Middle School | 0 | 0.0% |
| High School | 0 | 0.0% |
| College / Undergraduate | 0 | 0.0% |
| Graduate / Professional | 0 | 0.0% |
| Total | 0 | 0.0% |
School Enrollment by Age by Funding Source in Altoona
| Age Bracket | Public School | Private School |
| 3 to 4 Year Olds | 0 (0.0%) | 0 (0.0%) |
| 5 to 9 Year Old | 0 (0.0%) | 0 (0.0%) |
| 10 to 14 Year Olds | 0 (0.0%) | 0 (0.0%) |
| 15 to 17 Year Olds | 0 (0.0%) | 0 (0.0%) |
| 18 to 19 Year Olds | 0 (0.0%) | 0 (0.0%) |
| 20 to 24 Year Olds | 0 (0.0%) | 0 (0.0%) |
| 25 to 34 Year Olds | 0 (0.0%) | 0 (0.0%) |
| 35 Years and over | 0 (0.0%) | 0 (0.0%) |
| Total | 0 (0.0%) | 0 (0.0%) |
Educational Attainment by Field of Study in Altoona
Bio, nature & agricultural (9 | 36.0%), education (9 | 36.0%), and business (7 | 28.0%) are the most common fields of study among 25 individuals in Altoona who have obtained a bachelor's degree or higher.
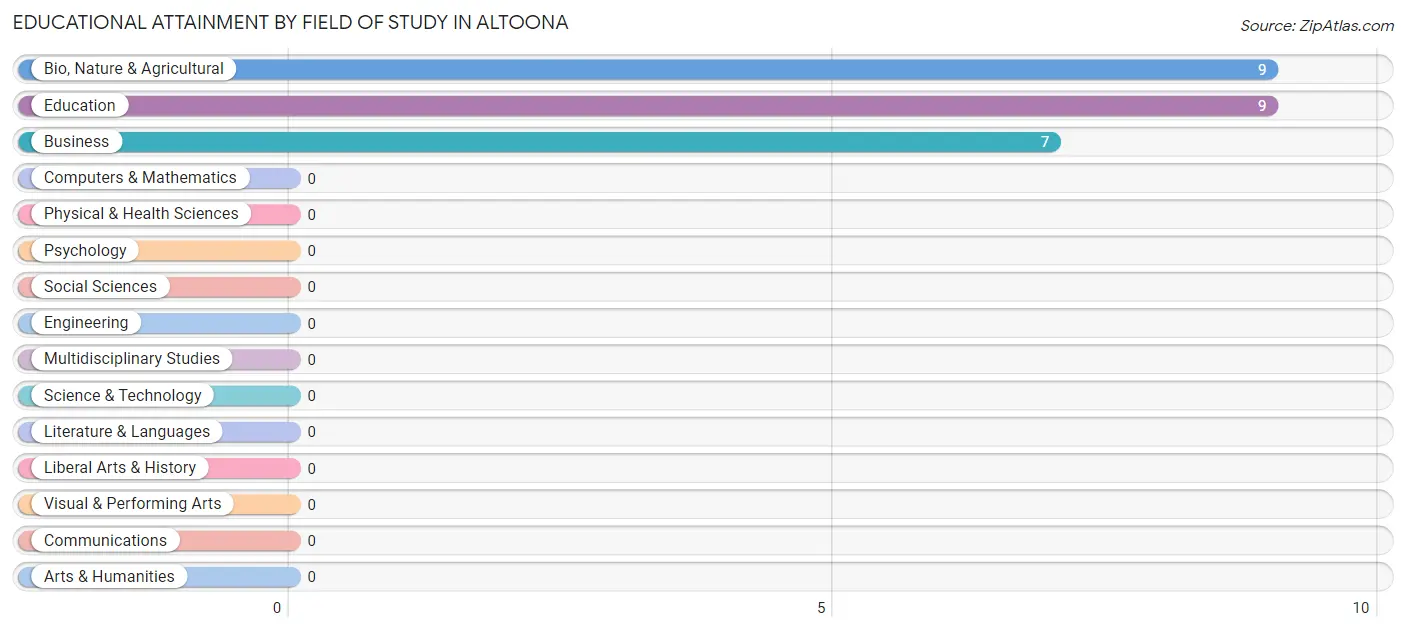
| Field of Study | # Graduates | % Graduates |
| Computers & Mathematics | 0 | 0.0% |
| Bio, Nature & Agricultural | 9 | 36.0% |
| Physical & Health Sciences | 0 | 0.0% |
| Psychology | 0 | 0.0% |
| Social Sciences | 0 | 0.0% |
| Engineering | 0 | 0.0% |
| Multidisciplinary Studies | 0 | 0.0% |
| Science & Technology | 0 | 0.0% |
| Business | 7 | 28.0% |
| Education | 9 | 36.0% |
| Literature & Languages | 0 | 0.0% |
| Liberal Arts & History | 0 | 0.0% |
| Visual & Performing Arts | 0 | 0.0% |
| Communications | 0 | 0.0% |
| Arts & Humanities | 0 | 0.0% |
| Total | 25 | 100.0% |
Transportation & Commute in Altoona
Vehicle Availability by Sex in Altoona
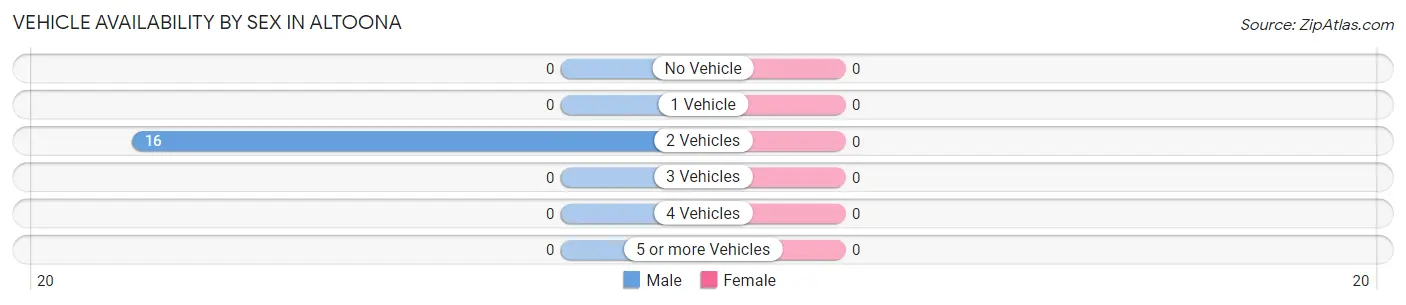
| Vehicles Available | Male | Female |
| No Vehicle | 0 (0.0%) | 0 (0.0%) |
| 1 Vehicle | 0 (0.0%) | 0 (0.0%) |
| 2 Vehicles | 16 (100.0%) | 0 (0.0%) |
| 3 Vehicles | 0 (0.0%) | 0 (0.0%) |
| 4 Vehicles | 0 (0.0%) | 0 (0.0%) |
| 5 or more Vehicles | 0 (0.0%) | 0 (0.0%) |
| Total | 16 (100.0%) | 0 (0.0%) |
Commute Time in Altoona
The most frequently occuring commute durations in Altoona are 90 or more minutes (9 commuters, 56.2%), 45 to 59 minutes (7 commuters, 43.8%), and less than 5 minutes (0 commuters, 0.0%).
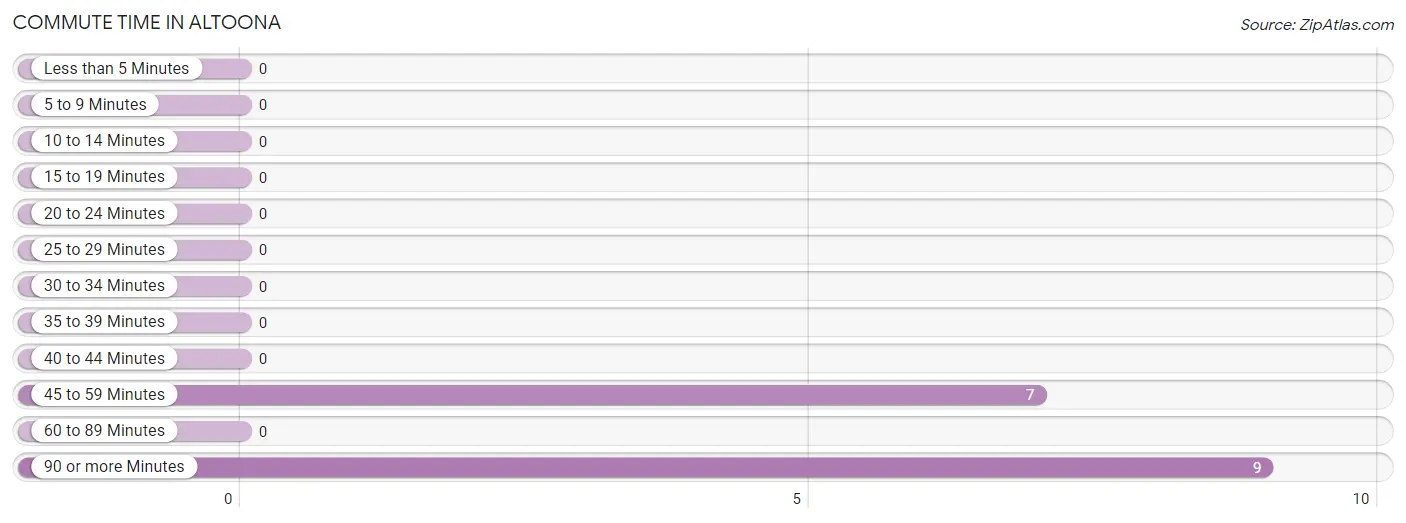
| Commute Time | # Commuters | % Commuters |
| Less than 5 Minutes | 0 | 0.0% |
| 5 to 9 Minutes | 0 | 0.0% |
| 10 to 14 Minutes | 0 | 0.0% |
| 15 to 19 Minutes | 0 | 0.0% |
| 20 to 24 Minutes | 0 | 0.0% |
| 25 to 29 Minutes | 0 | 0.0% |
| 30 to 34 Minutes | 0 | 0.0% |
| 35 to 39 Minutes | 0 | 0.0% |
| 40 to 44 Minutes | 0 | 0.0% |
| 45 to 59 Minutes | 7 | 43.8% |
| 60 to 89 Minutes | 0 | 0.0% |
| 90 or more Minutes | 9 | 56.2% |
Commute Time by Sex in Altoona
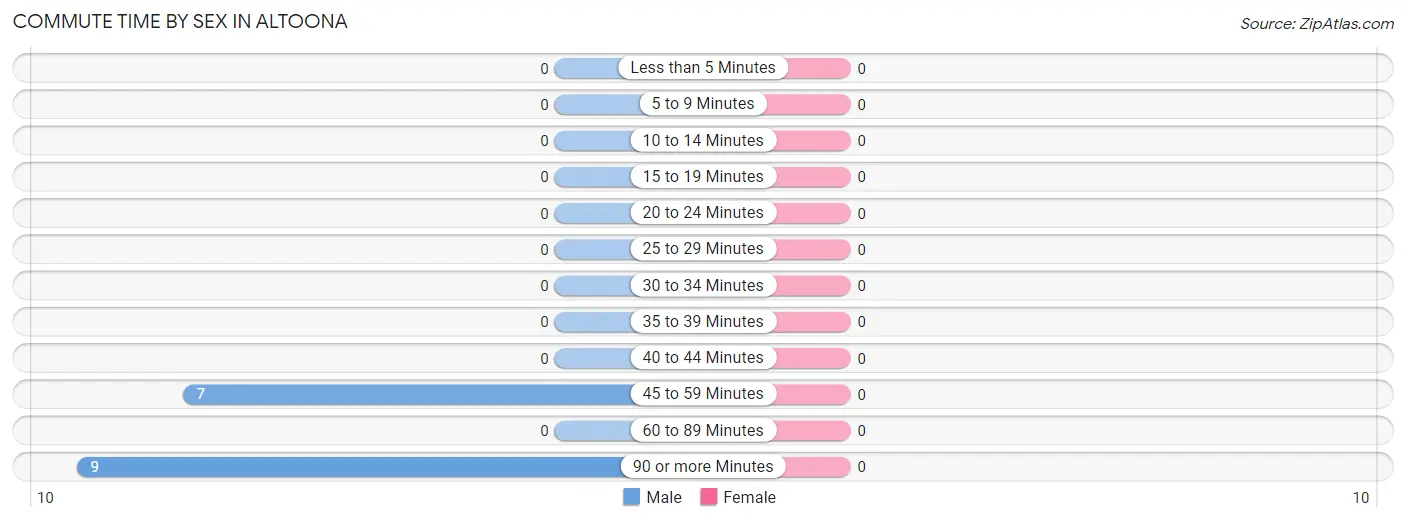
| Commute Time | Male | Female |
| Less than 5 Minutes | 0 (0.0%) | 0 (0.0%) |
| 5 to 9 Minutes | 0 (0.0%) | 0 (0.0%) |
| 10 to 14 Minutes | 0 (0.0%) | 0 (0.0%) |
| 15 to 19 Minutes | 0 (0.0%) | 0 (0.0%) |
| 20 to 24 Minutes | 0 (0.0%) | 0 (0.0%) |
| 25 to 29 Minutes | 0 (0.0%) | 0 (0.0%) |
| 30 to 34 Minutes | 0 (0.0%) | 0 (0.0%) |
| 35 to 39 Minutes | 0 (0.0%) | 0 (0.0%) |
| 40 to 44 Minutes | 0 (0.0%) | 0 (0.0%) |
| 45 to 59 Minutes | 7 (43.8%) | 0 (0.0%) |
| 60 to 89 Minutes | 0 (0.0%) | 0 (0.0%) |
| 90 or more Minutes | 9 (56.2%) | 0 (0.0%) |
Time of Departure to Work by Sex in Altoona
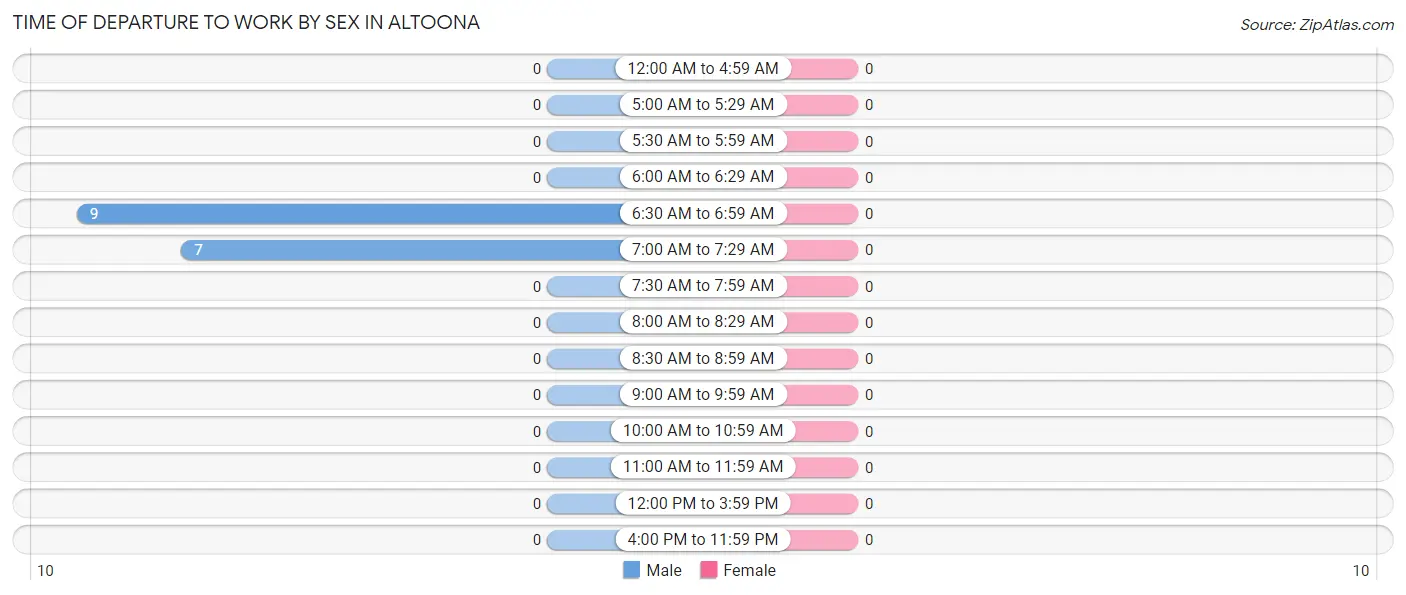
| Time of Departure | Male | Female |
| 12:00 AM to 4:59 AM | 0 (0.0%) | 0 (0.0%) |
| 5:00 AM to 5:29 AM | 0 (0.0%) | 0 (0.0%) |
| 5:30 AM to 5:59 AM | 0 (0.0%) | 0 (0.0%) |
| 6:00 AM to 6:29 AM | 0 (0.0%) | 0 (0.0%) |
| 6:30 AM to 6:59 AM | 9 (56.2%) | 0 (0.0%) |
| 7:00 AM to 7:29 AM | 7 (43.8%) | 0 (0.0%) |
| 7:30 AM to 7:59 AM | 0 (0.0%) | 0 (0.0%) |
| 8:00 AM to 8:29 AM | 0 (0.0%) | 0 (0.0%) |
| 8:30 AM to 8:59 AM | 0 (0.0%) | 0 (0.0%) |
| 9:00 AM to 9:59 AM | 0 (0.0%) | 0 (0.0%) |
| 10:00 AM to 10:59 AM | 0 (0.0%) | 0 (0.0%) |
| 11:00 AM to 11:59 AM | 0 (0.0%) | 0 (0.0%) |
| 12:00 PM to 3:59 PM | 0 (0.0%) | 0 (0.0%) |
| 4:00 PM to 11:59 PM | 0 (0.0%) | 0 (0.0%) |
| Total | 16 (100.0%) | 0 (0.0%) |
Housing Occupancy in Altoona
Occupancy by Ownership in Altoona
Of the total 25 dwellings in Altoona, owner-occupied units account for 25 (100.0%), while renter-occupied units make up 0 (0.0%).
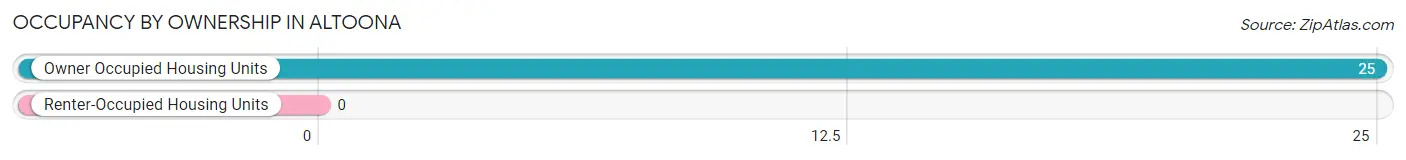
| Occupancy | # Housing Units | % Housing Units |
| Owner Occupied Housing Units | 25 | 100.0% |
| Renter-Occupied Housing Units | 0 | 0.0% |
| Total Occupied Housing Units | 25 | 100.0% |
Occupancy by Household Size in Altoona
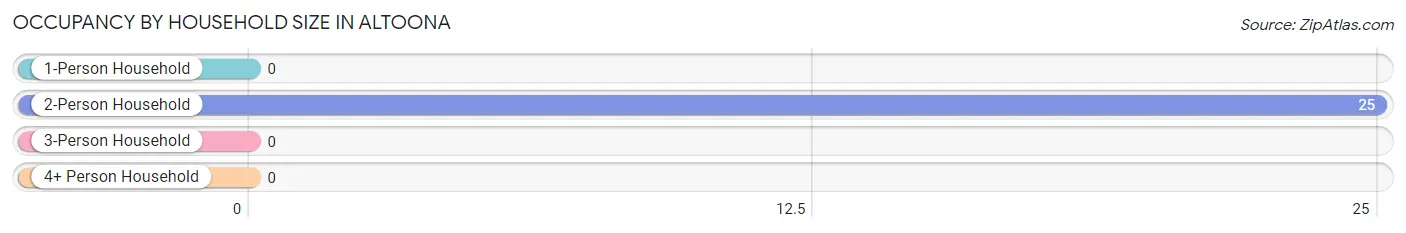
| Household Size | # Housing Units | % Housing Units |
| 1-Person Household | 0 | 0.0% |
| 2-Person Household | 25 | 100.0% |
| 3-Person Household | 0 | 0.0% |
| 4+ Person Household | 0 | 0.0% |
| Total Housing Units | 25 | 100.0% |
Occupancy by Ownership by Household Size in Altoona
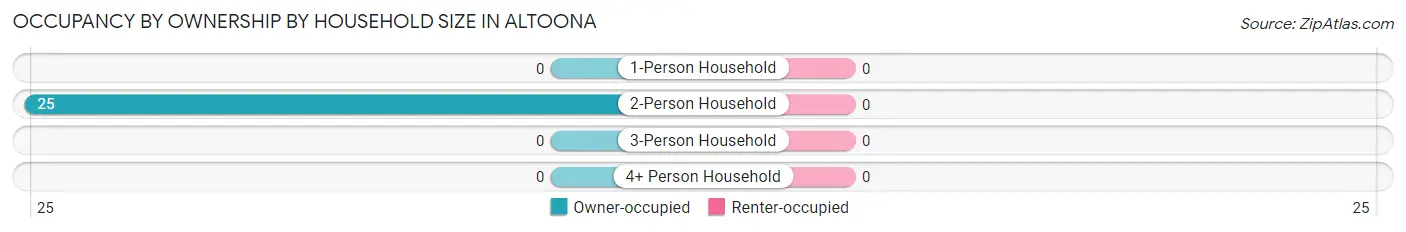
| Household Size | Owner-occupied | Renter-occupied |
| 1-Person Household | 0 (0.0%) | 0 (0.0%) |
| 2-Person Household | 25 (100.0%) | 0 (0.0%) |
| 3-Person Household | 0 (0.0%) | 0 (0.0%) |
| 4+ Person Household | 0 (0.0%) | 0 (0.0%) |
| Total Housing Units | 25 (100.0%) | 0 (0.0%) |
Occupancy by Educational Attainment in Altoona
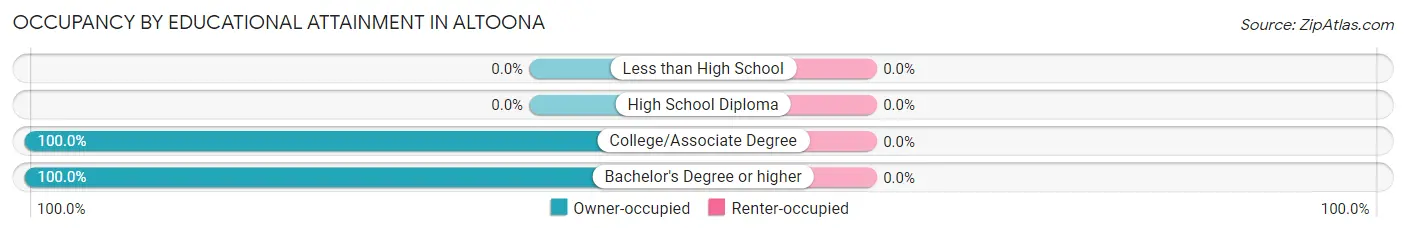
| Household Size | Owner-occupied | Renter-occupied |
| Less than High School | 0 (0.0%) | 0 (0.0%) |
| High School Diploma | 0 (0.0%) | 0 (0.0%) |
| College/Associate Degree | 16 (100.0%) | 0 (0.0%) |
| Bachelor's Degree or higher | 9 (100.0%) | 0 (0.0%) |
Occupancy by Age of Householder in Altoona
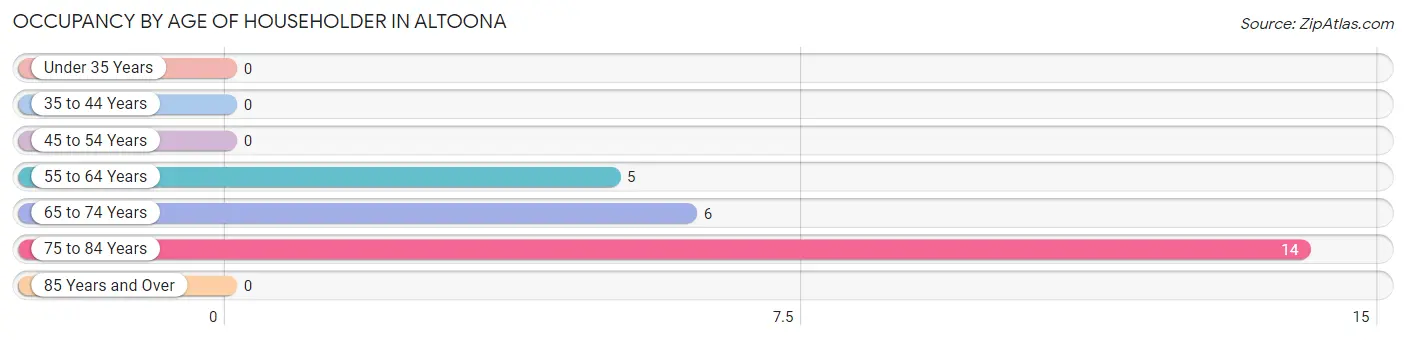
| Age Bracket | # Households | % Households |
| Under 35 Years | 0 | 0.0% |
| 35 to 44 Years | 0 | 0.0% |
| 45 to 54 Years | 0 | 0.0% |
| 55 to 64 Years | 5 | 20.0% |
| 65 to 74 Years | 6 | 24.0% |
| 75 to 84 Years | 14 | 56.0% |
| 85 Years and Over | 0 | 0.0% |
| Total | 25 | 100.0% |
Housing Finances in Altoona
Median Income by Occupancy in Altoona
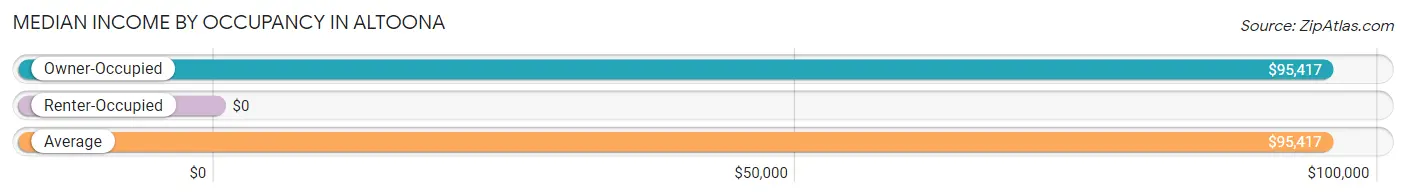
| Occupancy Type | # Households | Median Income |
| Owner-Occupied | 25 (100.0%) | $95,417 |
| Renter-Occupied | 0 (0.0%) | $0 |
| Average | 25 (100.0%) | $95,417 |
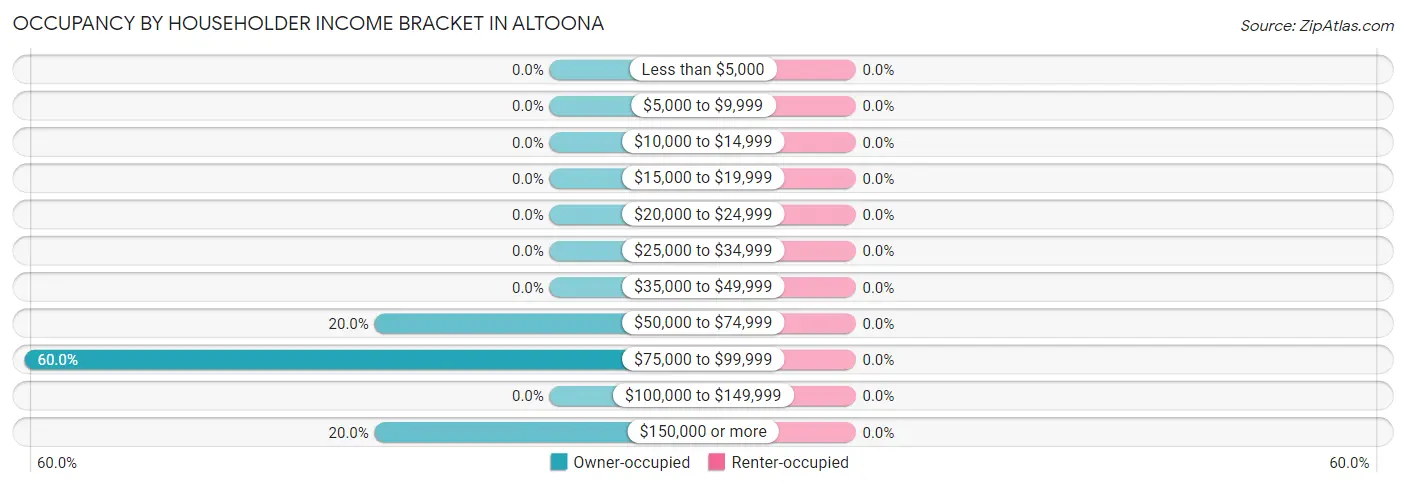
Occupancy by Householder Income Bracket in Altoona
| Income Bracket | Owner-occupied | Renter-occupied |
| Less than $5,000 | 0 (0.0%) | 0 (0.0%) |
| $5,000 to $9,999 | 0 (0.0%) | 0 (0.0%) |
| $10,000 to $14,999 | 0 (0.0%) | 0 (0.0%) |
| $15,000 to $19,999 | 0 (0.0%) | 0 (0.0%) |
| $20,000 to $24,999 | 0 (0.0%) | 0 (0.0%) |
| $25,000 to $34,999 | 0 (0.0%) | 0 (0.0%) |
| $35,000 to $49,999 | 0 (0.0%) | 0 (0.0%) |
| $50,000 to $74,999 | 5 (20.0%) | 0 (0.0%) |
| $75,000 to $99,999 | 15 (60.0%) | 0 (0.0%) |
| $100,000 to $149,999 | 0 (0.0%) | 0 (0.0%) |
| $150,000 or more | 5 (20.0%) | 0 (0.0%) |
| Total | 25 (100.0%) | 0 (0.0%) |
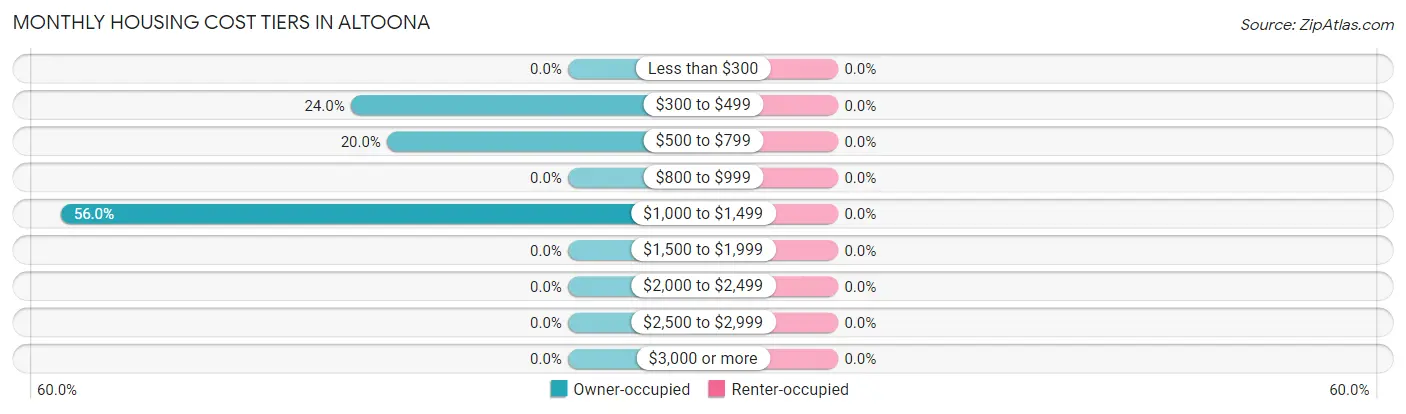
Monthly Housing Cost Tiers in Altoona
| Monthly Cost | Owner-occupied | Renter-occupied |
| Less than $300 | 0 (0.0%) | 0 (0.0%) |
| $300 to $499 | 6 (24.0%) | 0 (0.0%) |
| $500 to $799 | 5 (20.0%) | 0 (0.0%) |
| $800 to $999 | 0 (0.0%) | 0 (0.0%) |
| $1,000 to $1,499 | 14 (56.0%) | 0 (0.0%) |
| $1,500 to $1,999 | 0 (0.0%) | 0 (0.0%) |
| $2,000 to $2,499 | 0 (0.0%) | 0 (0.0%) |
| $2,500 to $2,999 | 0 (0.0%) | 0 (0.0%) |
| $3,000 or more | 0 (0.0%) | 0 (0.0%) |
| Total | 25 (100.0%) | 0 (0.0%) |
Physical Housing Characteristics in Altoona
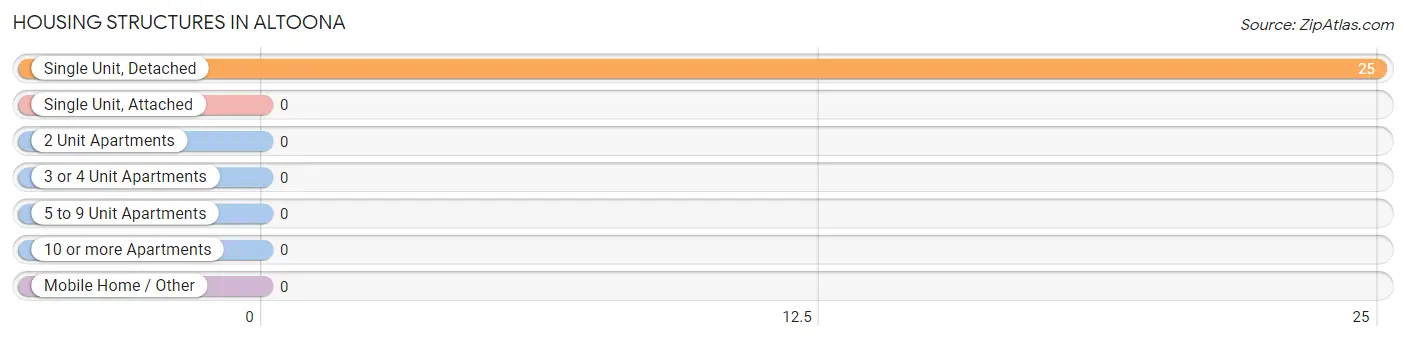
Housing Structures in Altoona
| Structure Type | # Housing Units | % Housing Units |
| Single Unit, Detached | 25 | 100.0% |
| Single Unit, Attached | 0 | 0.0% |
| 2 Unit Apartments | 0 | 0.0% |
| 3 or 4 Unit Apartments | 0 | 0.0% |
| 5 to 9 Unit Apartments | 0 | 0.0% |
| 10 or more Apartments | 0 | 0.0% |
| Mobile Home / Other | 0 | 0.0% |
| Total | 25 | 100.0% |
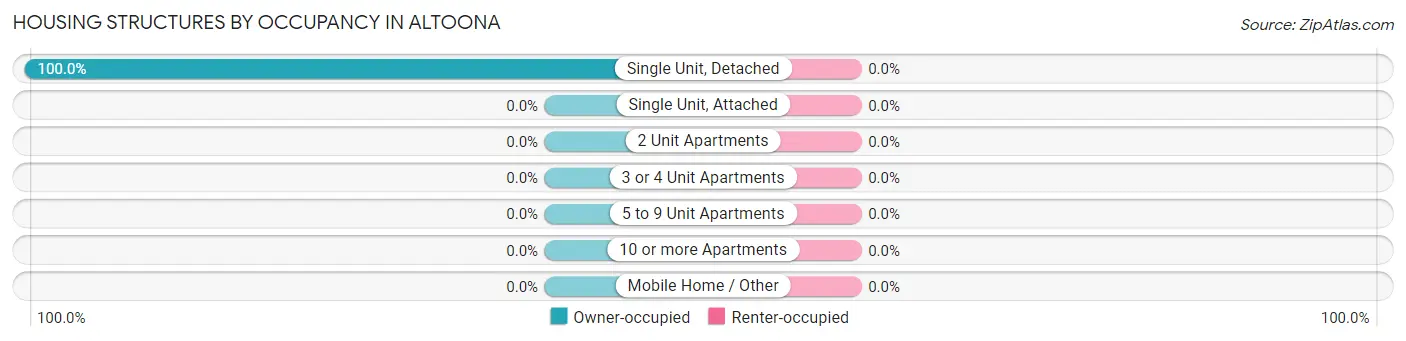
Housing Structures by Occupancy in Altoona
| Structure Type | Owner-occupied | Renter-occupied |
| Single Unit, Detached | 25 (100.0%) | 0 (0.0%) |
| Single Unit, Attached | 0 (0.0%) | 0 (0.0%) |
| 2 Unit Apartments | 0 (0.0%) | 0 (0.0%) |
| 3 or 4 Unit Apartments | 0 (0.0%) | 0 (0.0%) |
| 5 to 9 Unit Apartments | 0 (0.0%) | 0 (0.0%) |
| 10 or more Apartments | 0 (0.0%) | 0 (0.0%) |
| Mobile Home / Other | 0 (0.0%) | 0 (0.0%) |
| Total | 25 (100.0%) | 0 (0.0%) |
Housing Structures by Number of Rooms in Altoona
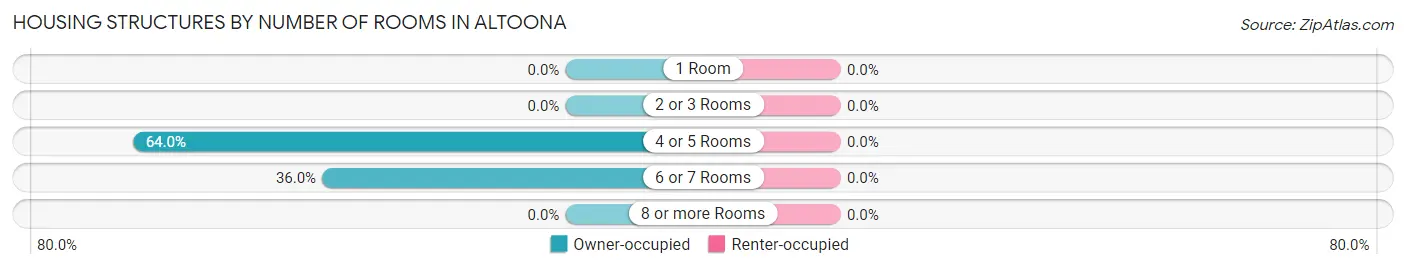
| Number of Rooms | Owner-occupied | Renter-occupied |
| 1 Room | 0 (0.0%) | 0 (0.0%) |
| 2 or 3 Rooms | 0 (0.0%) | 0 (0.0%) |
| 4 or 5 Rooms | 16 (64.0%) | 0 (0.0%) |
| 6 or 7 Rooms | 9 (36.0%) | 0 (0.0%) |
| 8 or more Rooms | 0 (0.0%) | 0 (0.0%) |
| Total | 25 (100.0%) | 0 (0.0%) |
Housing Structure by Heating Type in Altoona
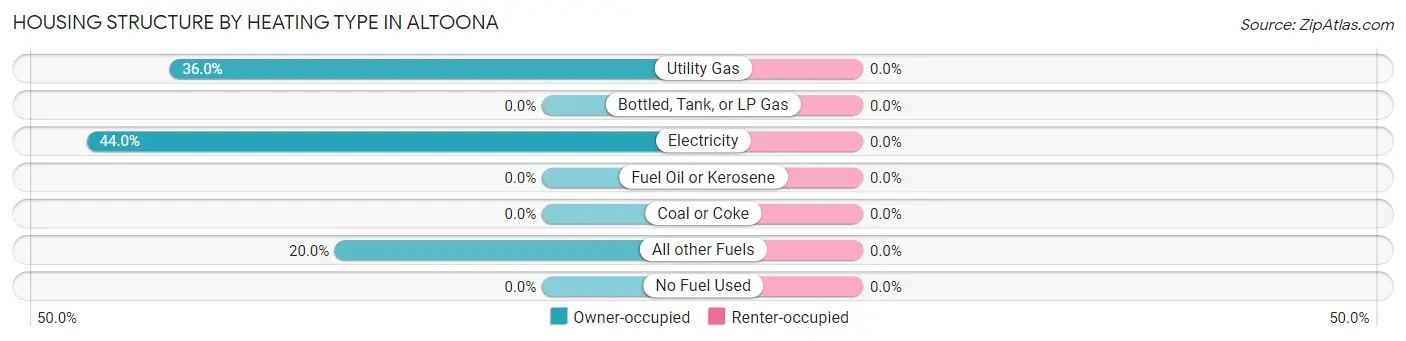
| Heating Type | Owner-occupied | Renter-occupied |
| Utility Gas | 9 (36.0%) | 0 (0.0%) |
| Bottled, Tank, or LP Gas | 0 (0.0%) | 0 (0.0%) |
| Electricity | 11 (44.0%) | 0 (0.0%) |
| Fuel Oil or Kerosene | 0 (0.0%) | 0 (0.0%) |
| Coal or Coke | 0 (0.0%) | 0 (0.0%) |
| All other Fuels | 5 (20.0%) | 0 (0.0%) |
| No Fuel Used | 0 (0.0%) | 0 (0.0%) |
| Total | 25 (100.0%) | 0 (0.0%) |
Household Vehicle Usage in Altoona
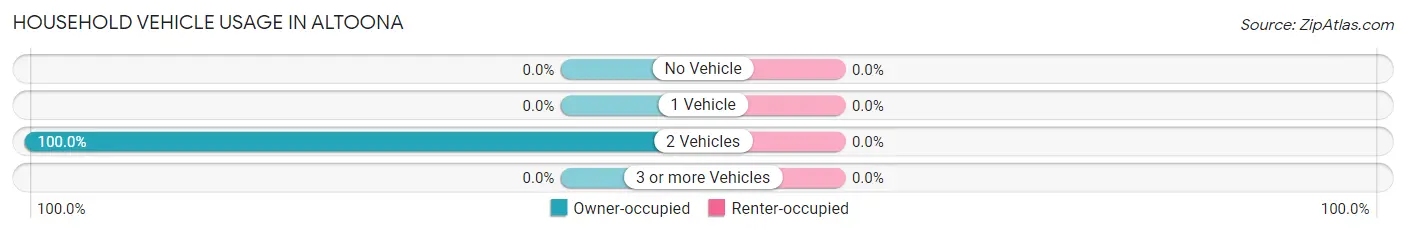
| Vehicles per Household | Owner-occupied | Renter-occupied |
| No Vehicle | 0 (0.0%) | 0 (0.0%) |
| 1 Vehicle | 0 (0.0%) | 0 (0.0%) |
| 2 Vehicles | 25 (100.0%) | 0 (0.0%) |
| 3 or more Vehicles | 0 (0.0%) | 0 (0.0%) |
| Total | 25 (100.0%) | 0 (0.0%) |
Real Estate & Mortgages in Altoona
Real Estate and Mortgage Overview in Altoona
| Characteristic | Without Mortgage | With Mortgage |
| Housing Units | 25 | 0 |
| Median Property Value | $1,291,700 | $0 |
| Median Household Income | $95,417 | $0 |
| Monthly Housing Costs | $1,330 | $0 |
| Real Estate Taxes | $10,001 | $0 |
Property Value by Mortgage Status in Altoona
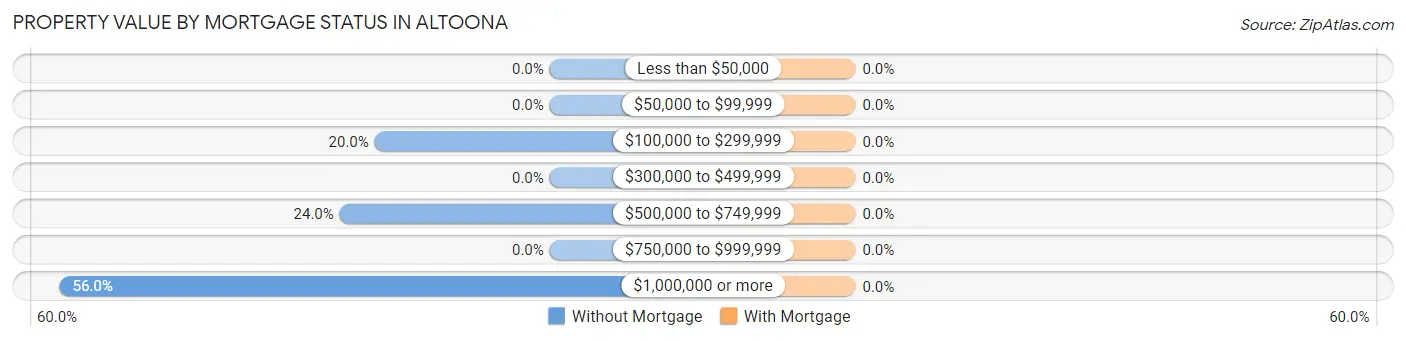
| Property Value | Without Mortgage | With Mortgage |
| Less than $50,000 | 0 (0.0%) | 0 (0.0%) |
| $50,000 to $99,999 | 0 (0.0%) | 0 (0.0%) |
| $100,000 to $299,999 | 5 (20.0%) | 0 (0.0%) |
| $300,000 to $499,999 | 0 (0.0%) | 0 (0.0%) |
| $500,000 to $749,999 | 6 (24.0%) | 0 (0.0%) |
| $750,000 to $999,999 | 0 (0.0%) | 0 (0.0%) |
| $1,000,000 or more | 14 (56.0%) | 0 (0.0%) |
| Total | 25 (100.0%) | 0 (0.0%) |
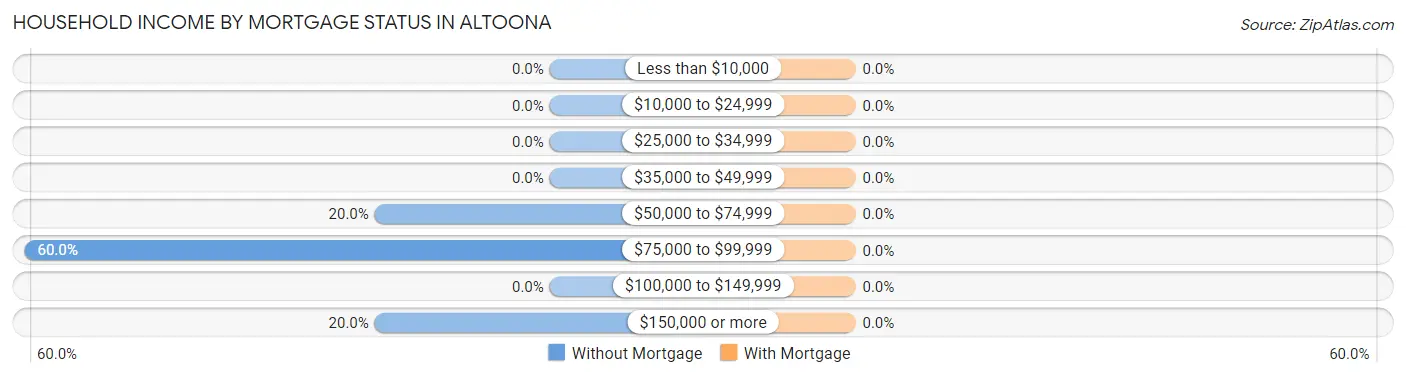
Household Income by Mortgage Status in Altoona
| Household Income | Without Mortgage | With Mortgage |
| Less than $10,000 | 0 (0.0%) | 0 (0.0%) |
| $10,000 to $24,999 | 0 (0.0%) | 0 (0.0%) |
| $25,000 to $34,999 | 0 (0.0%) | 0 (0.0%) |
| $35,000 to $49,999 | 0 (0.0%) | 0 (0.0%) |
| $50,000 to $74,999 | 5 (20.0%) | 0 (0.0%) |
| $75,000 to $99,999 | 15 (60.0%) | 0 (0.0%) |
| $100,000 to $149,999 | 0 (0.0%) | 0 (0.0%) |
| $150,000 or more | 5 (20.0%) | 0 (0.0%) |
| Total | 25 (100.0%) | 0 (0.0%) |
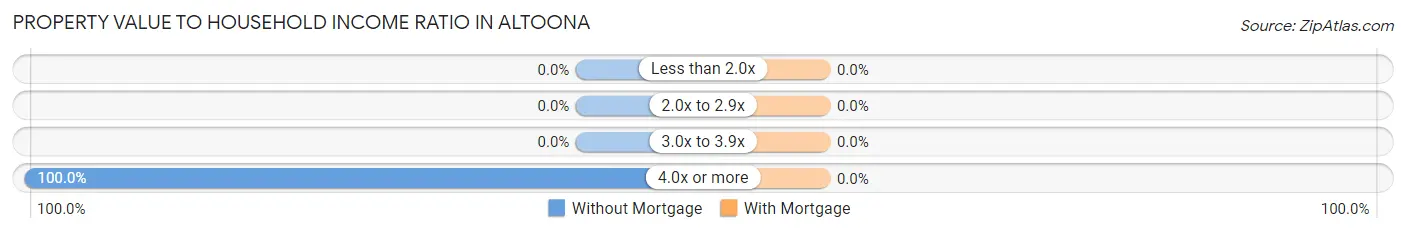
Property Value to Household Income Ratio in Altoona
| Value-to-Income Ratio | Without Mortgage | With Mortgage |
| Less than 2.0x | 0 (0.0%) | 0 (0.0%) |
| 2.0x to 2.9x | 0 (0.0%) | 0 (0.0%) |
| 3.0x to 3.9x | 0 (0.0%) | 0 (0.0%) |
| 4.0x or more | 25 (100.0%) | 0 (0.0%) |
| Total | 25 (100.0%) | 0 (0.0%) |
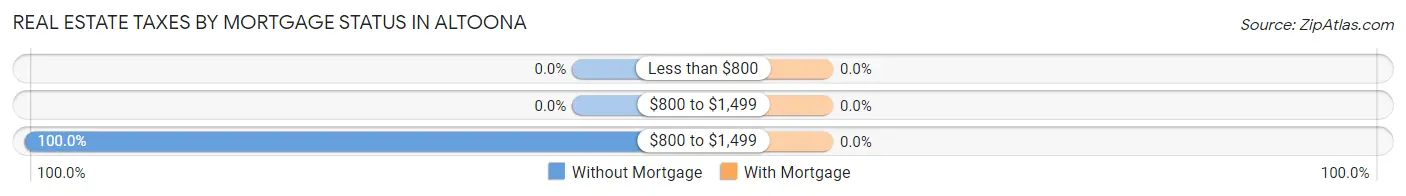
Real Estate Taxes by Mortgage Status in Altoona
| Property Taxes | Without Mortgage | With Mortgage |
| Less than $800 | 0 (0.0%) | 0 (0.0%) |
| $800 to $1,499 | 0 (0.0%) | 0 (0.0%) |
| $800 to $1,499 | 25 (100.0%) | 0 (0.0%) |
| Total | 25 (100.0%) | 0 (0.0%) |
Health & Disability in Altoona
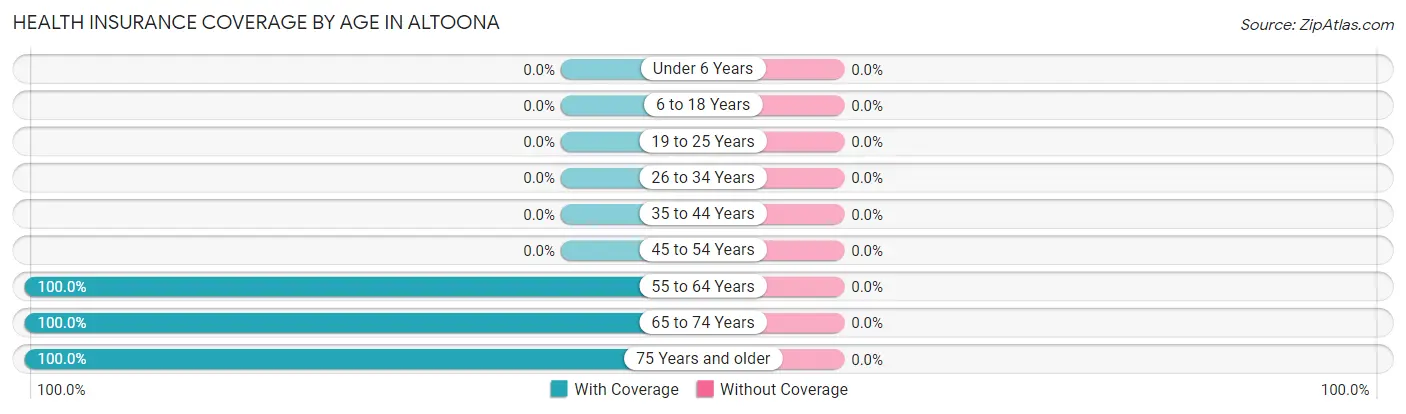
Health Insurance Coverage by Age in Altoona
| Age Bracket | With Coverage | Without Coverage |
| Under 6 Years | 0 (0.0%) | 0 (0.0%) |
| 6 to 18 Years | 0 (0.0%) | 0 (0.0%) |
| 19 to 25 Years | 0 (0.0%) | 0 (0.0%) |
| 26 to 34 Years | 0 (0.0%) | 0 (0.0%) |
| 35 to 44 Years | 0 (0.0%) | 0 (0.0%) |
| 45 to 54 Years | 0 (0.0%) | 0 (0.0%) |
| 55 to 64 Years | 12 (100.0%) | 0 (0.0%) |
| 65 to 74 Years | 13 (100.0%) | 0 (0.0%) |
| 75 Years and older | 28 (100.0%) | 0 (0.0%) |
| Total | 53 (100.0%) | 0 (0.0%) |
Health Insurance Coverage by Citizenship Status in Altoona
| Citizenship Status | With Coverage | Without Coverage |
| Native Born | 0 (0.0%) | 0 (0.0%) |
| Foreign Born, Citizen | 0 (0.0%) | 0 (0.0%) |
| Foreign Born, not a Citizen | 0 (0.0%) | 0 (0.0%) |
Health Insurance Coverage by Household Income in Altoona
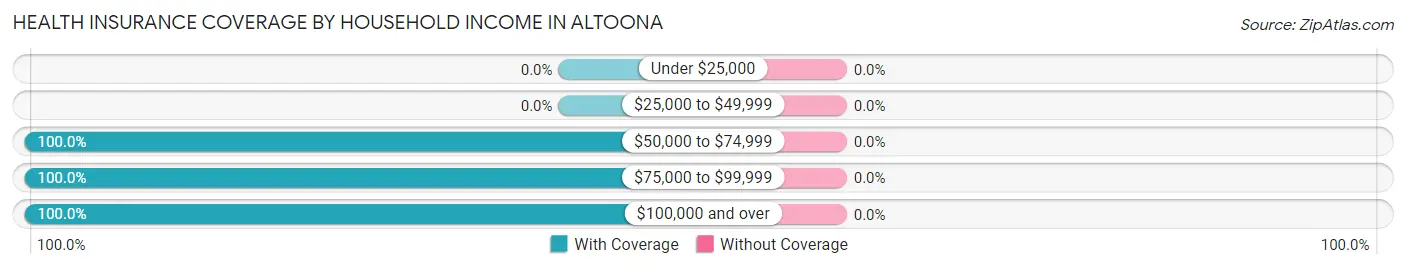
| Household Income | With Coverage | Without Coverage |
| Under $25,000 | 0 (0.0%) | 0 (0.0%) |
| $25,000 to $49,999 | 0 (0.0%) | 0 (0.0%) |
| $50,000 to $74,999 | 10 (100.0%) | 0 (0.0%) |
| $75,000 to $99,999 | 31 (100.0%) | 0 (0.0%) |
| $100,000 and over | 12 (100.0%) | 0 (0.0%) |
Public vs Private Health Insurance Coverage by Age in Altoona
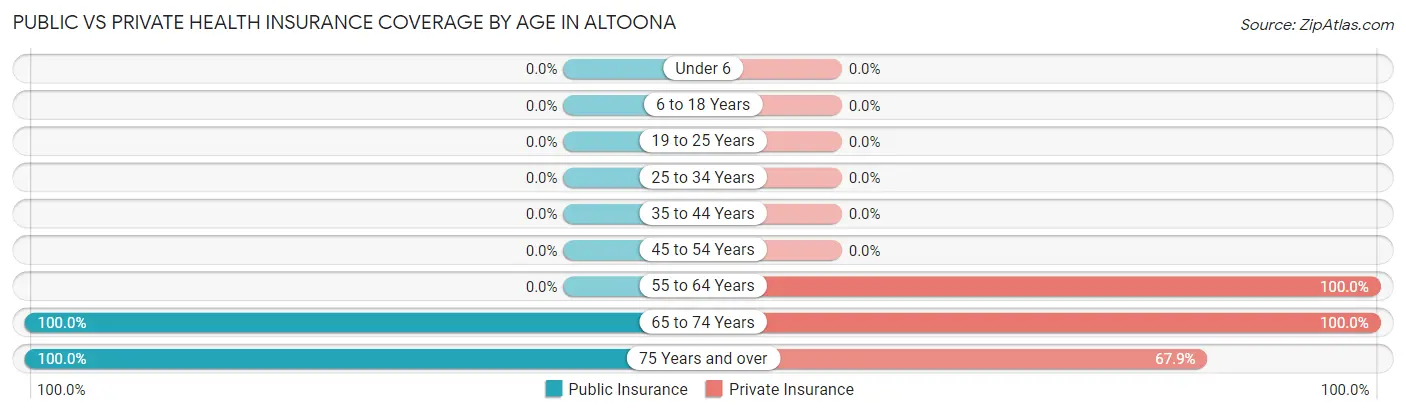
| Age Bracket | Public Insurance | Private Insurance |
| Under 6 | 0 (0.0%) | 0 (0.0%) |
| 6 to 18 Years | 0 (0.0%) | 0 (0.0%) |
| 19 to 25 Years | 0 (0.0%) | 0 (0.0%) |
| 25 to 34 Years | 0 (0.0%) | 0 (0.0%) |
| 35 to 44 Years | 0 (0.0%) | 0 (0.0%) |
| 45 to 54 Years | 0 (0.0%) | 0 (0.0%) |
| 55 to 64 Years | 0 (0.0%) | 12 (100.0%) |
| 65 to 74 Years | 13 (100.0%) | 13 (100.0%) |
| 75 Years and over | 28 (100.0%) | 19 (67.9%) |
| Total | 41 (77.4%) | 44 (83.0%) |
Disability Status by Sex by Age in Altoona
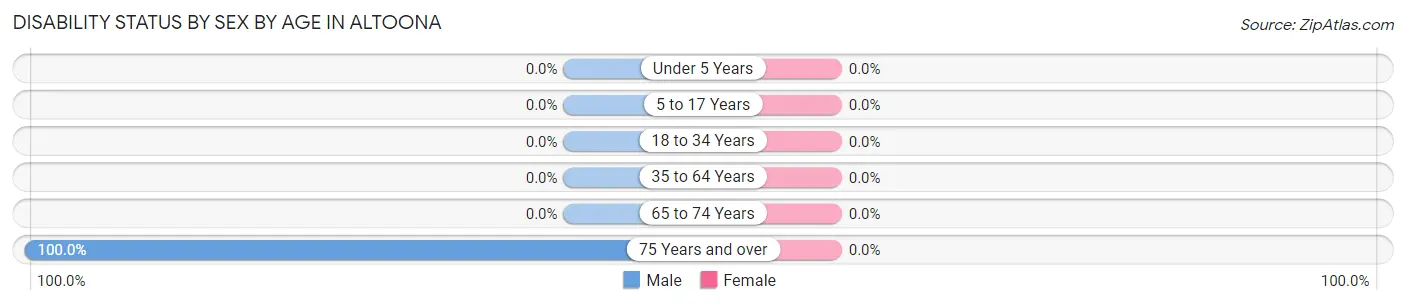
| Age Bracket | Male | Female |
| Under 5 Years | 0 (0.0%) | 0 (0.0%) |
| 5 to 17 Years | 0 (0.0%) | 0 (0.0%) |
| 18 to 34 Years | 0 (0.0%) | 0 (0.0%) |
| 35 to 64 Years | 0 (0.0%) | 0 (0.0%) |
| 65 to 74 Years | 0 (0.0%) | 0 (0.0%) |
| 75 Years and over | 14 (100.0%) | 0 (0.0%) |
Disability Class by Sex by Age in Altoona
Disability Class: Hearing Difficulty
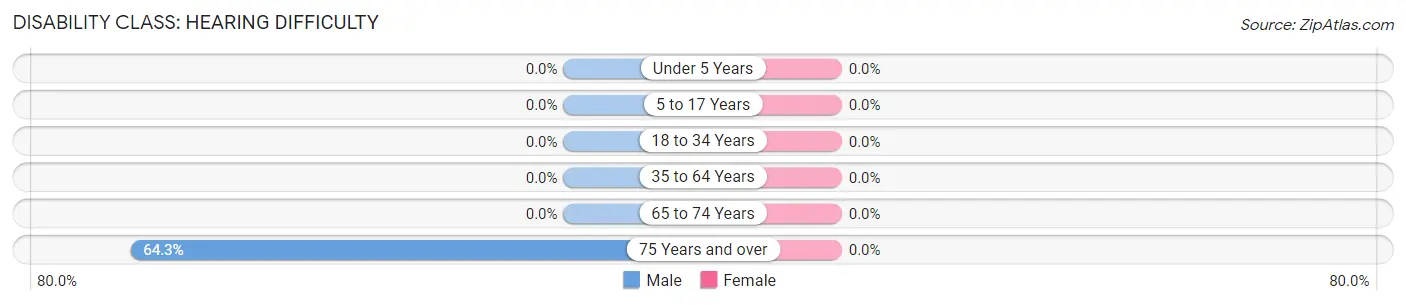
| Age Bracket | Male | Female |
| Under 5 Years | 0 (0.0%) | 0 (0.0%) |
| 5 to 17 Years | 0 (0.0%) | 0 (0.0%) |
| 18 to 34 Years | 0 (0.0%) | 0 (0.0%) |
| 35 to 64 Years | 0 (0.0%) | 0 (0.0%) |
| 65 to 74 Years | 0 (0.0%) | 0 (0.0%) |
| 75 Years and over | 9 (64.3%) | 0 (0.0%) |
Disability Class: Vision Difficulty
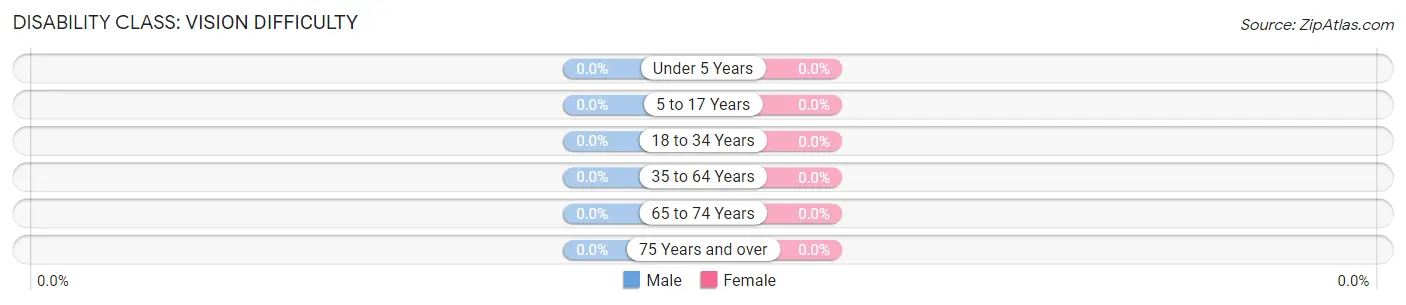
| Age Bracket | Male | Female |
| Under 5 Years | 0 (0.0%) | 0 (0.0%) |
| 5 to 17 Years | 0 (0.0%) | 0 (0.0%) |
| 18 to 34 Years | 0 (0.0%) | 0 (0.0%) |
| 35 to 64 Years | 0 (0.0%) | 0 (0.0%) |
| 65 to 74 Years | 0 (0.0%) | 0 (0.0%) |
| 75 Years and over | 0 (0.0%) | 0 (0.0%) |
Disability Class: Cognitive Difficulty
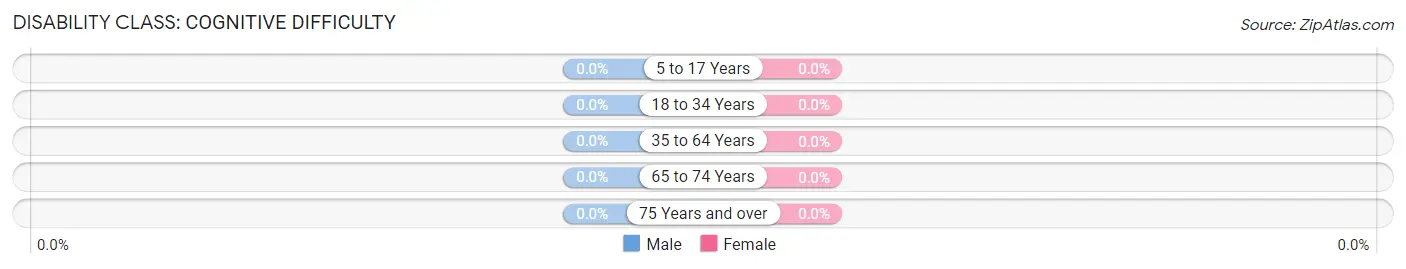
| Age Bracket | Male | Female |
| 5 to 17 Years | 0 (0.0%) | 0 (0.0%) |
| 18 to 34 Years | 0 (0.0%) | 0 (0.0%) |
| 35 to 64 Years | 0 (0.0%) | 0 (0.0%) |
| 65 to 74 Years | 0 (0.0%) | 0 (0.0%) |
| 75 Years and over | 0 (0.0%) | 0 (0.0%) |
Disability Class: Ambulatory Difficulty

| Age Bracket | Male | Female |
| 5 to 17 Years | 0 (0.0%) | 0 (0.0%) |
| 18 to 34 Years | 0 (0.0%) | 0 (0.0%) |
| 35 to 64 Years | 0 (0.0%) | 0 (0.0%) |
| 65 to 74 Years | 0 (0.0%) | 0 (0.0%) |
| 75 Years and over | 5 (35.7%) | 0 (0.0%) |
Disability Class: Self-Care Difficulty
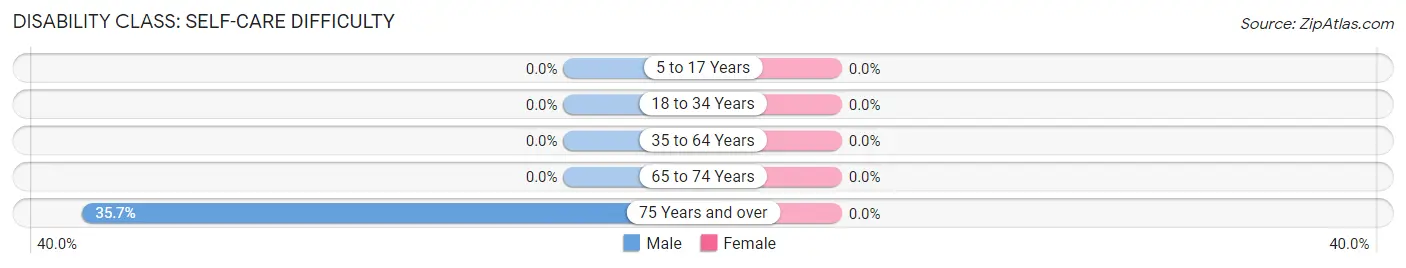
| Age Bracket | Male | Female |
| 5 to 17 Years | 0 (0.0%) | 0 (0.0%) |
| 18 to 34 Years | 0 (0.0%) | 0 (0.0%) |
| 35 to 64 Years | 0 (0.0%) | 0 (0.0%) |
| 65 to 74 Years | 0 (0.0%) | 0 (0.0%) |
| 75 Years and over | 5 (35.7%) | 0 (0.0%) |
Technology Access in Altoona
Computing Device Access in Altoona
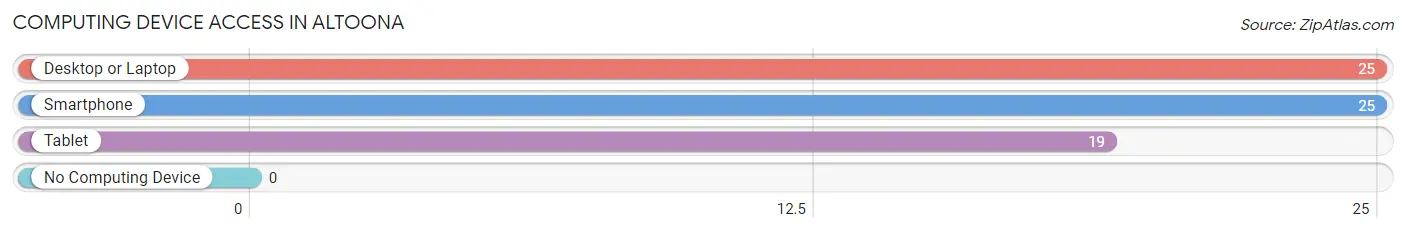
| Device Type | # Households | % Households |
| Desktop or Laptop | 25 | 100.0% |
| Smartphone | 25 | 100.0% |
| Tablet | 19 | 76.0% |
| No Computing Device | 0 | 0.0% |
| Total | 25 | 100.0% |
Internet Access in Altoona
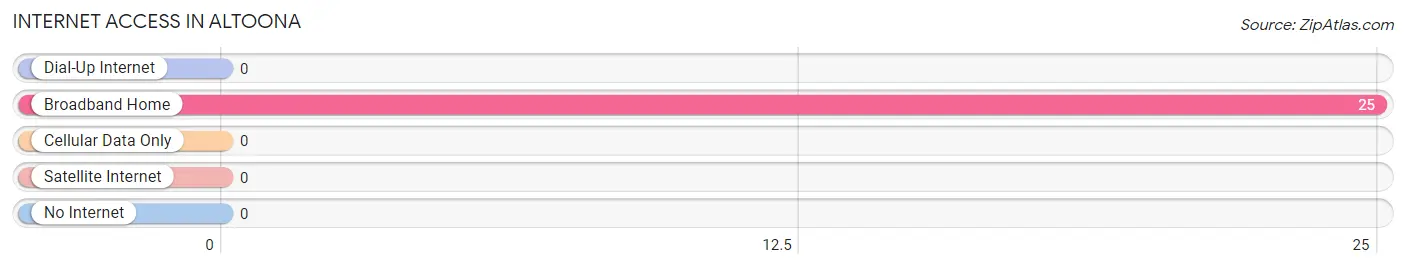
| Internet Type | # Households | % Households |
| Dial-Up Internet | 0 | 0.0% |
| Broadband Home | 25 | 100.0% |
| Cellular Data Only | 0 | 0.0% |
| Satellite Internet | 0 | 0.0% |
| No Internet | 0 | 0.0% |
| Total | 25 | 100.0% |
Altoona Summary
Altoona, Washington is a small town located in the foothills of the Cascade Mountains in Snohomish County, Washington. The town is situated on the banks of the Stillaguamish River, and is surrounded by lush forests and rolling hills. The population of Altoona was estimated to be 1,845 in 2020.
History
Altoona was first settled in the late 1800s by a group of Swedish immigrants. The town was originally called Swede Town, and was later renamed Altoona after the nearby town of Altoona, Pennsylvania. The town was incorporated in 1909, and the first mayor was John A. Anderson.
The town was originally a logging and farming community, and the first sawmill was built in the area in 1891. The town was also home to a number of small businesses, including a general store, a blacksmith shop, and a hotel.
Geography
Altoona is located in the foothills of the Cascade Mountains in Snohomish County, Washington. The town is situated on the banks of the Stillaguamish River, and is surrounded by lush forests and rolling hills. The town is located approximately 25 miles northeast of Seattle, and is accessible via Interstate 5.
The climate in Altoona is mild and temperate, with warm summers and cool winters. The average annual temperature is around 50 degrees Fahrenheit, and the average annual precipitation is around 40 inches.
Economy
Altoona’s economy is largely based on tourism and agriculture. The town is home to a number of small businesses, including restaurants, shops, and galleries. The town is also home to a number of farms, which produce a variety of fruits and vegetables.
The town is also home to a number of outdoor recreation opportunities, including hiking, fishing, and camping. The nearby Cascade Mountains offer a variety of outdoor activities, including skiing, snowboarding, and mountain biking.
Demographics
As of 2020, the population of Altoona was estimated to be 1,845. The population is largely white (90.2%), with a small percentage of African Americans (2.2%), Asians (2.1%), and Native Americans (1.2%). The median household income in Altoona is $60,000, and the median home value is $310,000.
The town is served by the Snohomish County School District, which includes two elementary schools, one middle school, and one high school. The town is also home to a number of churches, including the Altoona United Methodist Church and the Altoona Lutheran Church.
Conclusion
Altoona, Washington is a small town located in the foothills of the Cascade Mountains in Snohomish County, Washington. The town is situated on the banks of the Stillaguamish River, and is surrounded by lush forests and rolling hills. The population of Altoona was estimated to be 1,845 in 2020. The town’s economy is largely based on tourism and agriculture, and the town is home to a number of small businesses, farms, and outdoor recreation opportunities. The population of Altoona is largely white, with a small percentage of African Americans, Asians, and Native Americans. The median household income in Altoona is $60,000, and the median home value is $310,000.
Common Questions
What is Per Capita Income in Altoona?
Per Capita income in Altoona is $75,172.
What is the Median Family Income in Altoona?
Median Family Income in Altoona is $95,417.
What is the Median Household income in Altoona?
Median Household Income in Altoona is $95,417.
What is Inequality or Gini Index in Altoona?
Inequality or Gini Index in Altoona is 0.32.
What is the Total Population of Altoona?
Total Population of Altoona is 53.
What is the Total Male Population of Altoona?
Total Male Population of Altoona is 27.
What is the Total Female Population of Altoona?
Total Female Population of Altoona is 26.
What is the Ratio of Males per 100 Females in Altoona?
There are 103.85 Males per 100 Females in Altoona.
What is the Ratio of Females per 100 Males in Altoona?
There are 96.30 Females per 100 Males in Altoona.
What is the Median Population Age in Altoona?
Median Population Age in Altoona is 75.1 Years.
What is the Average Family Size in Altoona
Average Family Size in Altoona is 2.1 People.
What is the Average Household Size in Altoona
Average Household Size in Altoona is 2.1 People.
How Large is the Labor Force in Altoona?
There are 21 People in the Labor Forcein in Altoona.
What is the Percentage of People in the Labor Force in Altoona?
39.6% of People are in the Labor Force in Altoona.
What is the Unemployment Rate in Altoona?
Unemployment Rate in Altoona is 23.8%.