Deep River, WA Map & Demographics
Deep River Map
Deep River Overview
$48,172
PER CAPITA INCOME
$50,417
AVG FAMILY INCOME
$47,000
AVG HOUSEHOLD INCOME
0.51
INEQUALITY / GINI INDEX
159
TOTAL POPULATION
101
MALE POPULATION
58
FEMALE POPULATION
174.14
MALES / 100 FEMALES
57.43
FEMALES / 100 MALES
64.4
MEDIAN AGE
2.0
AVG FAMILY SIZE
1.7
AVG HOUSEHOLD SIZE
38
LABOR FORCE [ PEOPLE ]
26.2%
PERCENT IN LABOR FORCE
Income in Deep River
Income Overview in Deep River
Per Capita Income in Deep River is $48,172, while median incomes of families and households are $50,417 and $47,000 respectively.
| Characteristic | Number | Measure |
| Per Capita Income | 159 | $48,172 |
| Median Family Income | 56 | $50,417 |
| Mean Family Income | 56 | $108,116 |
| Median Household Income | 96 | $47,000 |
| Mean Household Income | 96 | $80,153 |
| Income Deficit | 56 | $0 |
| Wage / Income Gap (%) | 159 | 0.00% |
| Wage / Income Gap ($) | 159 | 100.00¢ per $1 |
| Gini / Inequality Index | 159 | 0.51 |
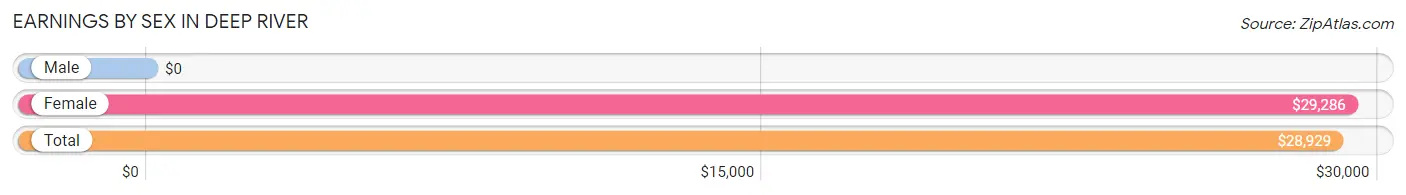
Earnings by Sex in Deep River
| Sex | Number | Average Earnings |
| Male | 20 (41.7%) | $0 |
| Female | 28 (58.3%) | $29,286 |
| Total | 48 (100.0%) | $28,929 |
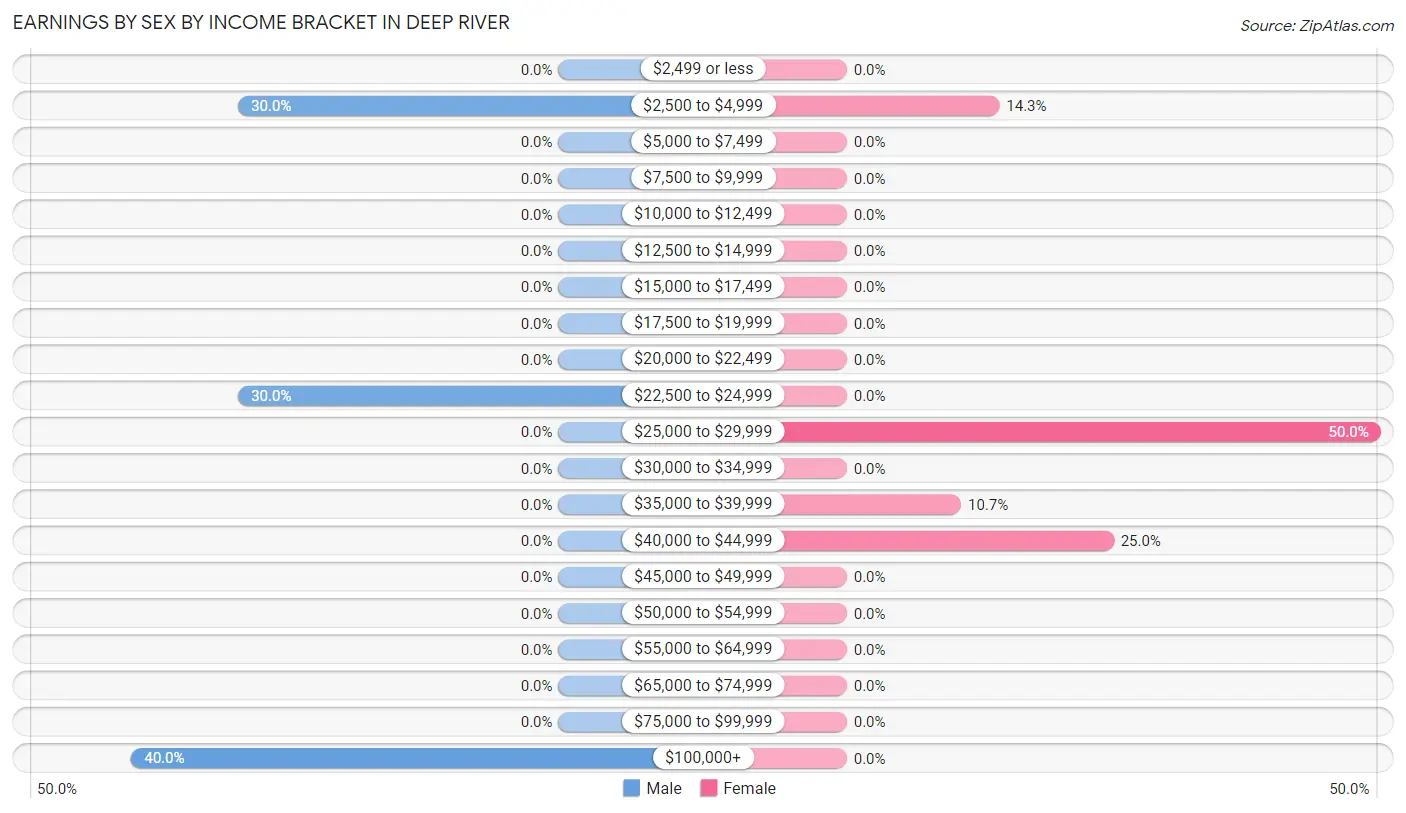
Earnings by Sex by Income Bracket in Deep River
The most common earnings brackets in Deep River are $100,000+ for men (8 | 40.0%) and $25,000 to $29,999 for women (14 | 50.0%).
| Income | Male | Female |
| $2,499 or less | 0 (0.0%) | 0 (0.0%) |
| $2,500 to $4,999 | 6 (30.0%) | 4 (14.3%) |
| $5,000 to $7,499 | 0 (0.0%) | 0 (0.0%) |
| $7,500 to $9,999 | 0 (0.0%) | 0 (0.0%) |
| $10,000 to $12,499 | 0 (0.0%) | 0 (0.0%) |
| $12,500 to $14,999 | 0 (0.0%) | 0 (0.0%) |
| $15,000 to $17,499 | 0 (0.0%) | 0 (0.0%) |
| $17,500 to $19,999 | 0 (0.0%) | 0 (0.0%) |
| $20,000 to $22,499 | 0 (0.0%) | 0 (0.0%) |
| $22,500 to $24,999 | 6 (30.0%) | 0 (0.0%) |
| $25,000 to $29,999 | 0 (0.0%) | 14 (50.0%) |
| $30,000 to $34,999 | 0 (0.0%) | 0 (0.0%) |
| $35,000 to $39,999 | 0 (0.0%) | 3 (10.7%) |
| $40,000 to $44,999 | 0 (0.0%) | 7 (25.0%) |
| $45,000 to $49,999 | 0 (0.0%) | 0 (0.0%) |
| $50,000 to $54,999 | 0 (0.0%) | 0 (0.0%) |
| $55,000 to $64,999 | 0 (0.0%) | 0 (0.0%) |
| $65,000 to $74,999 | 0 (0.0%) | 0 (0.0%) |
| $75,000 to $99,999 | 0 (0.0%) | 0 (0.0%) |
| $100,000+ | 8 (40.0%) | 0 (0.0%) |
| Total | 20 (100.0%) | 28 (100.0%) |
Earnings by Sex by Educational Attainment in Deep River
| Educational Attainment | Male Income | Female Income |
| Less than High School | - | - |
| High School Diploma | - | - |
| College or Associate's Degree | - | - |
| Bachelor's Degree | - | - |
| Graduate Degree | - | - |
| Total | - | - |
Family Income in Deep River
Family Income Brackets in Deep River
According to the Deep River family income data, there are 17 families falling into the $35,000 to $49,999 income range, which is the most common income bracket and makes up 30.4% of all families.
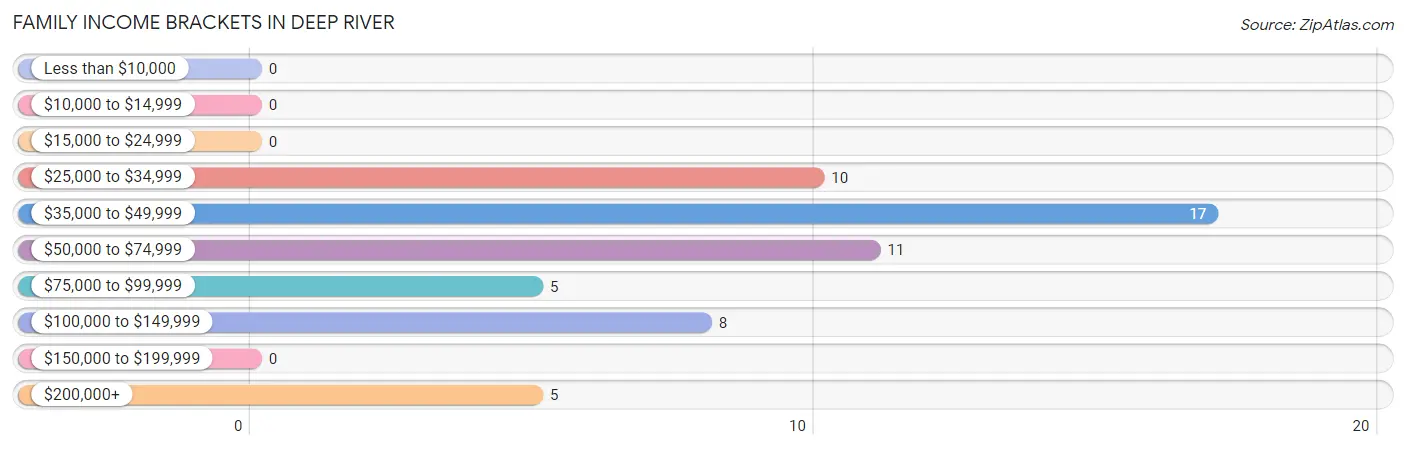
| Income Bracket | # Families | % Families |
| Less than $10,000 | 0 | 0.0% |
| $10,000 to $14,999 | 0 | 0.0% |
| $15,000 to $24,999 | 0 | 0.0% |
| $25,000 to $34,999 | 10 | 17.9% |
| $35,000 to $49,999 | 17 | 30.4% |
| $50,000 to $74,999 | 11 | 19.6% |
| $75,000 to $99,999 | 5 | 8.9% |
| $100,000 to $149,999 | 8 | 14.3% |
| $150,000 to $199,999 | 0 | 0.0% |
| $200,000+ | 5 | 8.9% |
Family Income by Famaliy Size in Deep River
2-person families (43 | 76.8%) account for the highest median family income in Deep River with $51,875 per family, while 2-person families (43 | 76.8%) have the highest median income of $25,938 per family member.
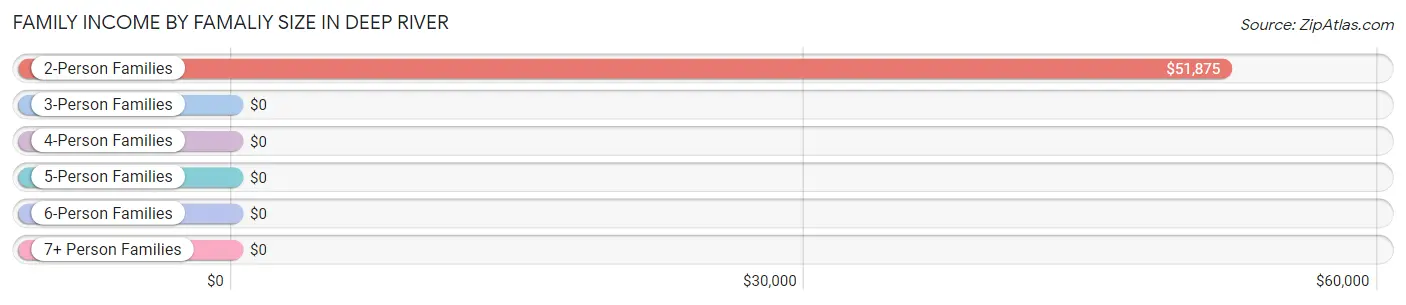
| Income Bracket | # Families | Median Income |
| 2-Person Families | 43 (76.8%) | $51,875 |
| 3-Person Families | 13 (23.2%) | $0 |
| 4-Person Families | 0 (0.0%) | $0 |
| 5-Person Families | 0 (0.0%) | $0 |
| 6-Person Families | 0 (0.0%) | $0 |
| 7+ Person Families | 0 (0.0%) | $0 |
| Total | 56 (100.0%) | $50,417 |
Family Income by Number of Earners in Deep River
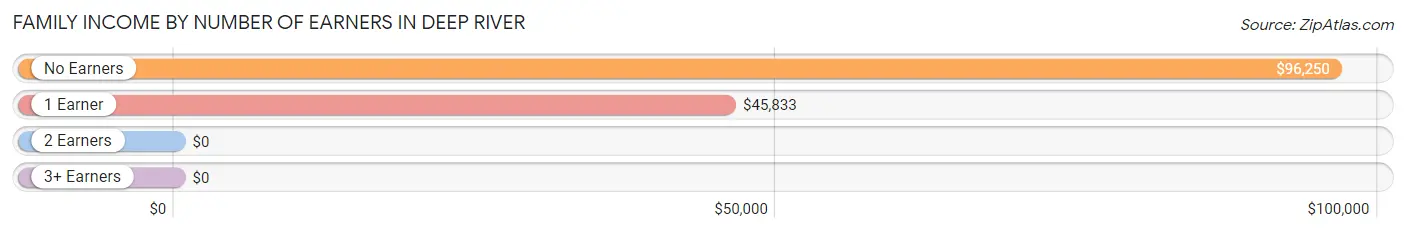
| Number of Earners | # Families | Median Income |
| No Earners | 15 (26.8%) | $96,250 |
| 1 Earner | 38 (67.9%) | $45,833 |
| 2 Earners | 3 (5.4%) | $0 |
| 3+ Earners | 0 (0.0%) | $0 |
| Total | 56 (100.0%) | $50,417 |
Household Income in Deep River
Household Income Brackets in Deep River
With 33 households falling in the category, the $35,000 to $49,999 income range is the most frequent in Deep River, accounting for 34.4% of all households.
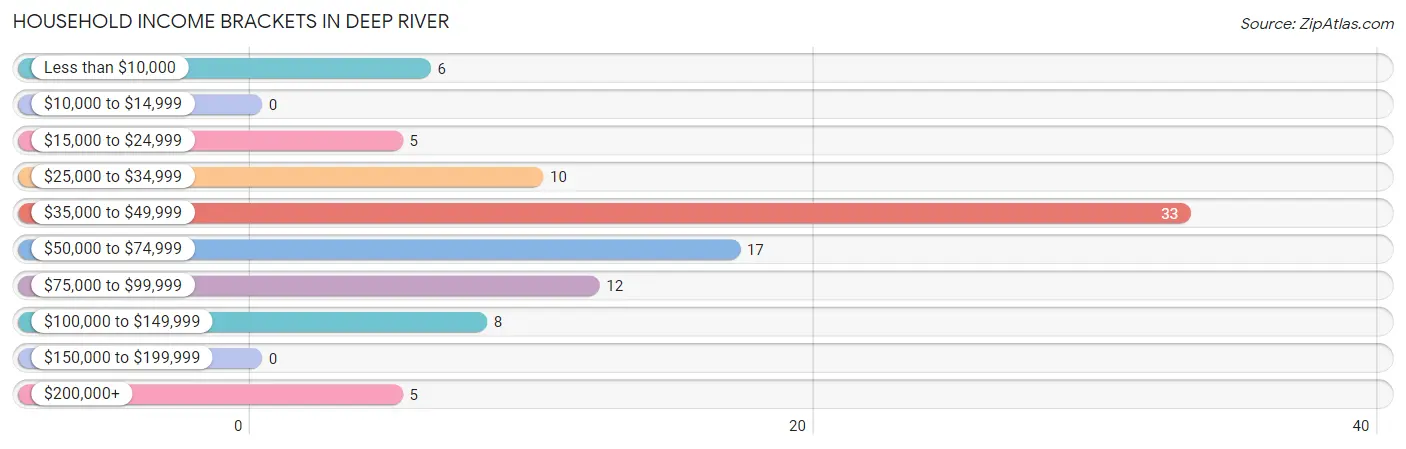
| Income Bracket | # Households | % Households |
| Less than $10,000 | 6 | 6.3% |
| $10,000 to $14,999 | 0 | 0.0% |
| $15,000 to $24,999 | 5 | 5.2% |
| $25,000 to $34,999 | 10 | 10.4% |
| $35,000 to $49,999 | 33 | 34.4% |
| $50,000 to $74,999 | 17 | 17.7% |
| $75,000 to $99,999 | 12 | 12.5% |
| $100,000 to $149,999 | 8 | 8.3% |
| $150,000 to $199,999 | 0 | 0.0% |
| $200,000+ | 5 | 5.2% |
Household Income by Householder Age in Deep River
The median household income in Deep River is $47,000, with the highest median household income of $49,063 found in the 65+ years age bracket for the primary householder. A total of 61 households (63.5%) fall into this category.
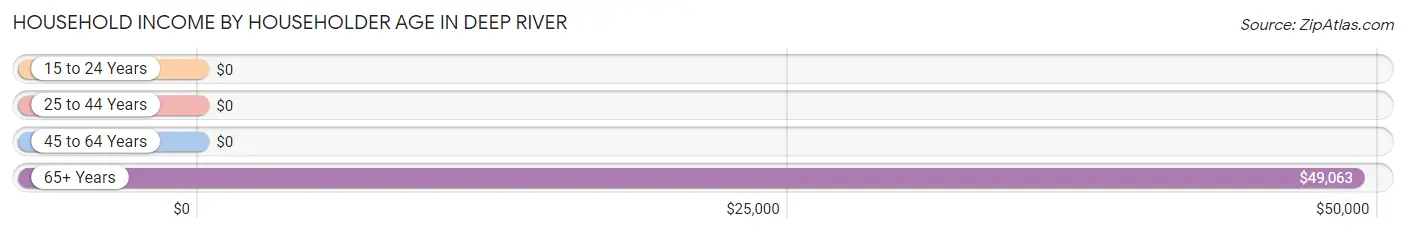
| Income Bracket | # Households | Median Income |
| 15 to 24 Years | 0 (0.0%) | $0 |
| 25 to 44 Years | 13 (13.5%) | $0 |
| 45 to 64 Years | 22 (22.9%) | $0 |
| 65+ Years | 61 (63.5%) | $49,063 |
| Total | 96 (100.0%) | $47,000 |
Poverty in Deep River
Income Below Poverty by Sex and Age in Deep River
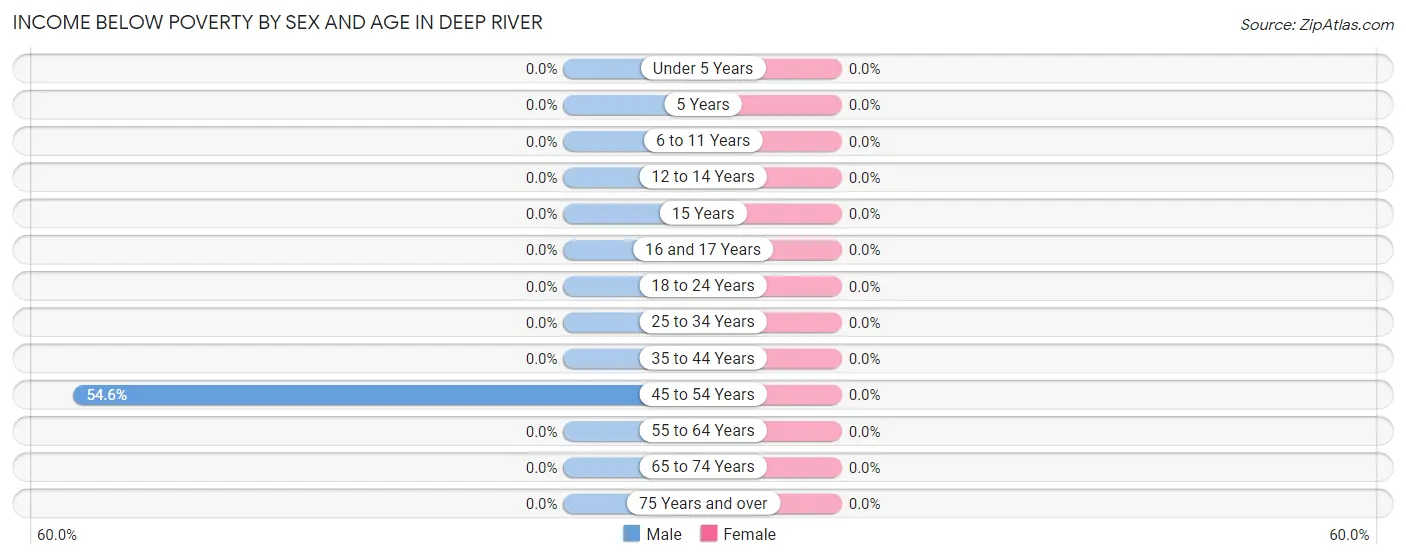
| Age Bracket | Male | Female |
| Under 5 Years | 0 (0.0%) | 0 (0.0%) |
| 5 Years | 0 (0.0%) | 0 (0.0%) |
| 6 to 11 Years | 0 (0.0%) | 0 (0.0%) |
| 12 to 14 Years | 0 (0.0%) | 0 (0.0%) |
| 15 Years | 0 (0.0%) | 0 (0.0%) |
| 16 and 17 Years | 0 (0.0%) | 0 (0.0%) |
| 18 to 24 Years | 0 (0.0%) | 0 (0.0%) |
| 25 to 34 Years | 0 (0.0%) | 0 (0.0%) |
| 35 to 44 Years | 0 (0.0%) | 0 (0.0%) |
| 45 to 54 Years | 6 (54.5%) | 0 (0.0%) |
| 55 to 64 Years | 0 (0.0%) | 0 (0.0%) |
| 65 to 74 Years | 0 (0.0%) | 0 (0.0%) |
| 75 Years and over | 0 (0.0%) | 0 (0.0%) |
| Total | 6 (6.2%) | 0 (0.0%) |
Income Above Poverty by Sex and Age in Deep River
According to the poverty statistics in Deep River, males aged under 5 years and females aged 25 to 34 years are the age groups that are most secure financially, with 100.0% of males and 100.0% of females in these age groups living above the poverty line.
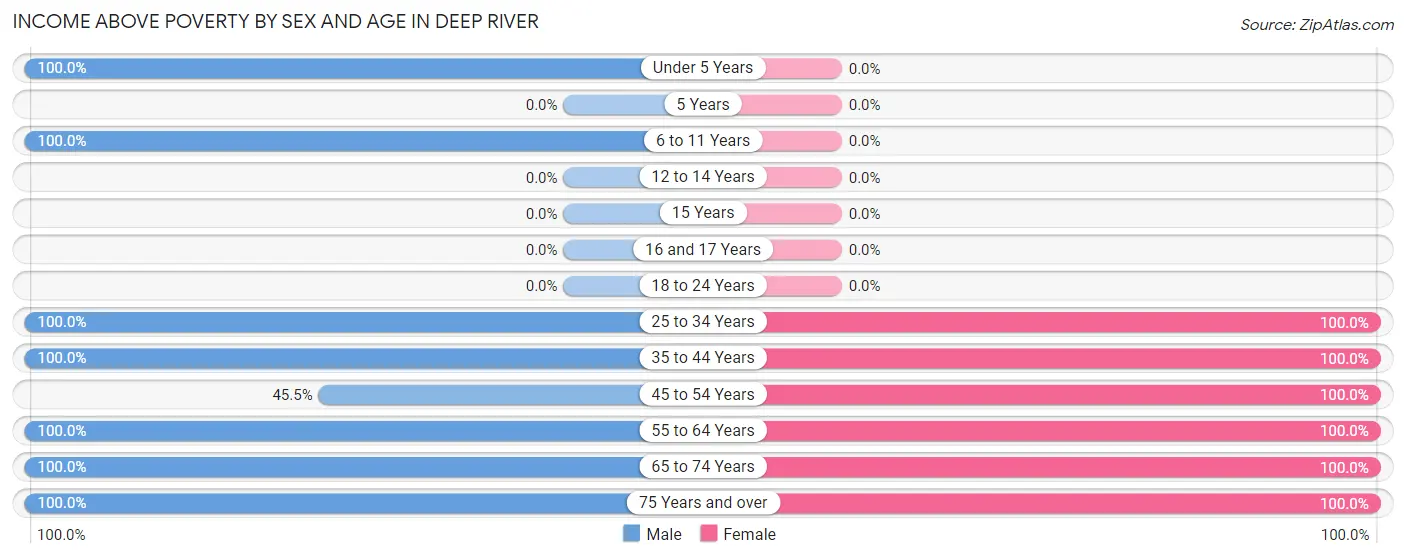
| Age Bracket | Male | Female |
| Under 5 Years | 6 (100.0%) | 0 (0.0%) |
| 5 Years | 0 (0.0%) | 0 (0.0%) |
| 6 to 11 Years | 4 (100.0%) | 0 (0.0%) |
| 12 to 14 Years | 0 (0.0%) | 0 (0.0%) |
| 15 Years | 0 (0.0%) | 0 (0.0%) |
| 16 and 17 Years | 0 (0.0%) | 0 (0.0%) |
| 18 to 24 Years | 0 (0.0%) | 0 (0.0%) |
| 25 to 34 Years | 10 (100.0%) | 10 (100.0%) |
| 35 to 44 Years | 3 (100.0%) | 3 (100.0%) |
| 45 to 54 Years | 5 (45.5%) | 3 (100.0%) |
| 55 to 64 Years | 11 (100.0%) | 17 (100.0%) |
| 65 to 74 Years | 32 (100.0%) | 20 (100.0%) |
| 75 Years and over | 20 (100.0%) | 5 (100.0%) |
| Total | 91 (93.8%) | 58 (100.0%) |
Income Below Poverty Among Married-Couple Families in Deep River
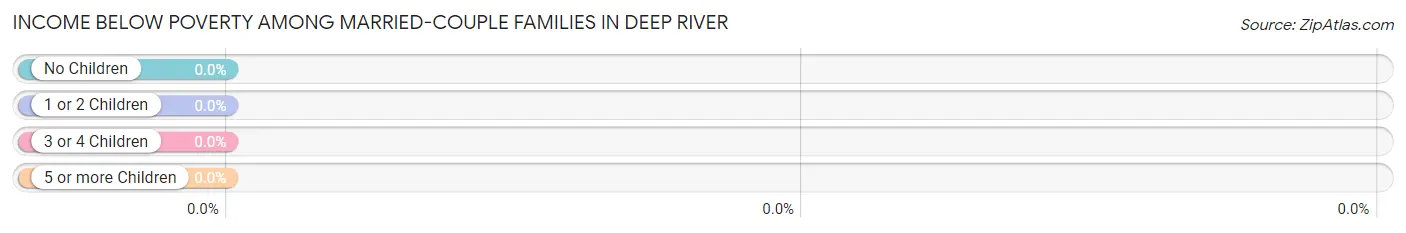
| Children | Above Poverty | Below Poverty |
| No Children | 43 (100.0%) | 0 (0.0%) |
| 1 or 2 Children | 13 (100.0%) | 0 (0.0%) |
| 3 or 4 Children | 0 (0.0%) | 0 (0.0%) |
| 5 or more Children | 0 (0.0%) | 0 (0.0%) |
| Total | 56 (100.0%) | 0 (0.0%) |
Income Below Poverty Among Single-Parent Households in Deep River
| Children | Single Father | Single Mother |
| No Children | 0 (0.0%) | 0 (0.0%) |
| 1 or 2 Children | 0 (0.0%) | 0 (0.0%) |
| 3 or 4 Children | 0 (0.0%) | 0 (0.0%) |
| 5 or more Children | 0 (0.0%) | 0 (0.0%) |
| Total | 0 (0.0%) | 0 (0.0%) |
Income Below Poverty Among Married-Couple vs Single-Parent Households in Deep River
| Children | Married-Couple Families | Single-Parent Households |
| No Children | 0 (0.0%) | 0 (0.0%) |
| 1 or 2 Children | 0 (0.0%) | 0 (0.0%) |
| 3 or 4 Children | 0 (0.0%) | 0 (0.0%) |
| 5 or more Children | 0 (0.0%) | 0 (0.0%) |
| Total | 0 (0.0%) | 0 (0.0%) |
Race in Deep River
The most populous races in Deep River are , and White / Caucasian (159 | 100.0%).
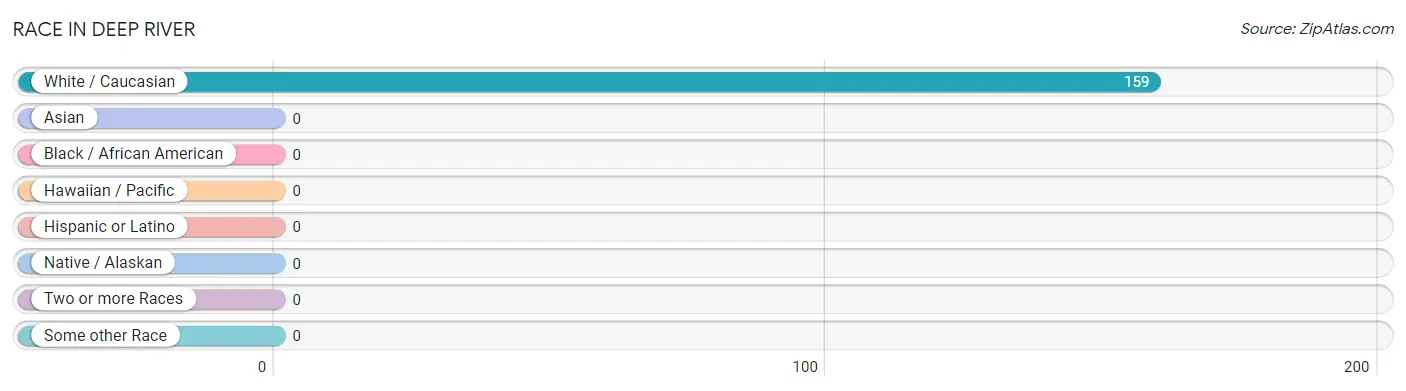
| Race | # Population | % Population |
| Asian | 0 | 0.0% |
| Black / African American | 0 | 0.0% |
| Hawaiian / Pacific | 0 | 0.0% |
| Hispanic or Latino | 0 | 0.0% |
| Native / Alaskan | 0 | 0.0% |
| White / Caucasian | 159 | 100.0% |
| Two or more Races | 0 | 0.0% |
| Some other Race | 0 | 0.0% |
| Total | 159 | 100.0% |
Ancestry in Deep River
The most populous ancestries reported in Deep River are Finnish (38 | 23.9%), German (28 | 17.6%), Irish (19 | 11.9%), French (17 | 10.7%), and Scandinavian (15 | 9.4%), together accounting for 73.6% of all Deep River residents.
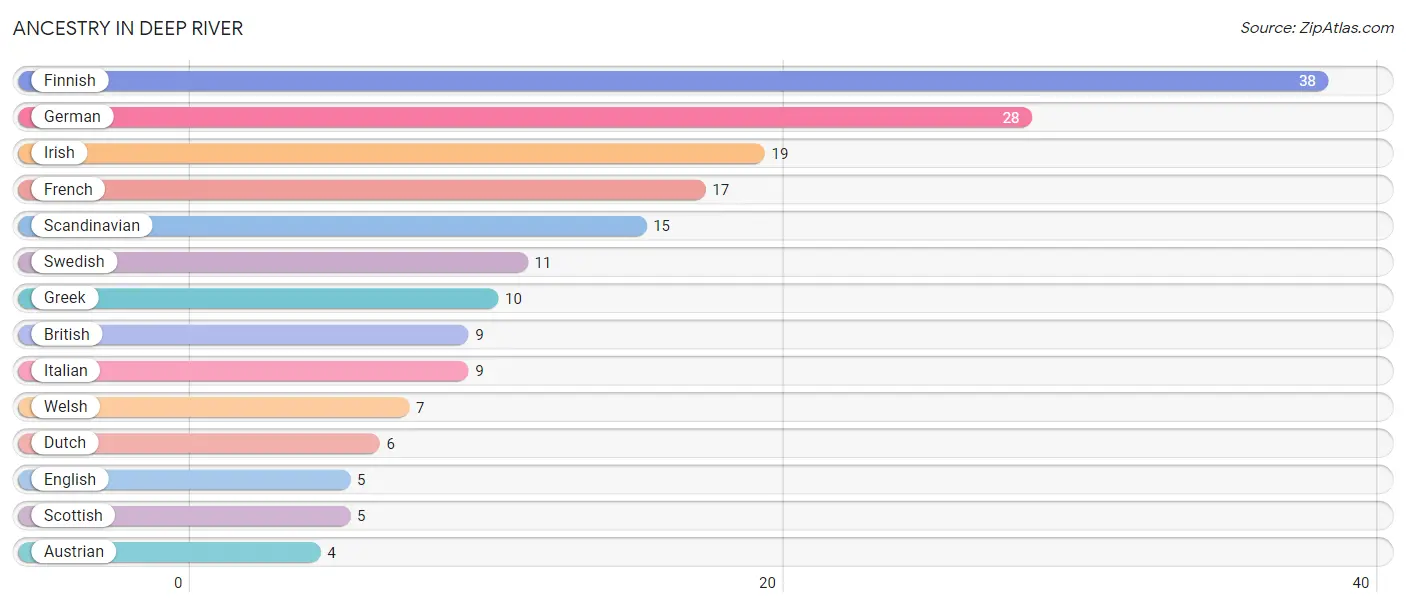
| Ancestry | # Population | % Population |
| Austrian | 4 | 2.5% |
| British | 9 | 5.7% |
| Dutch | 6 | 3.8% |
| English | 5 | 3.1% |
| Finnish | 38 | 23.9% |
| French | 17 | 10.7% |
| German | 28 | 17.6% |
| Greek | 10 | 6.3% |
| Irish | 19 | 11.9% |
| Italian | 9 | 5.7% |
| Scandinavian | 15 | 9.4% |
| Scottish | 5 | 3.1% |
| Swedish | 11 | 6.9% |
| Welsh | 7 | 4.4% | View All 14 Rows |
Immigrants in Deep River
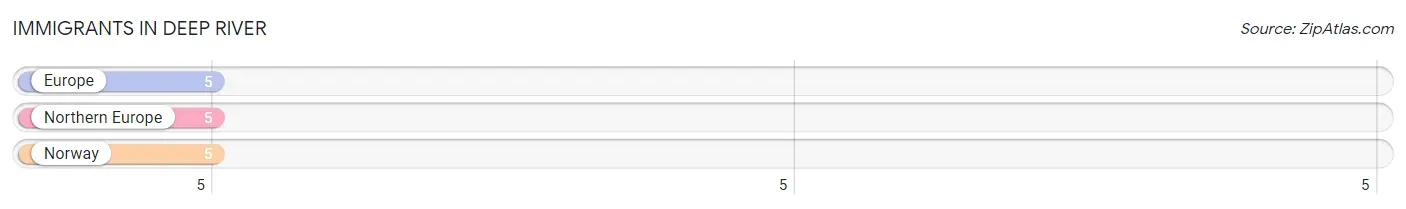
The most numerous immigrant groups reported in Deep River came from Europe (5 | 3.1%), Northern Europe (5 | 3.1%), and Norway (5 | 3.1%), together accounting for 9.4% of all Deep River residents.
| Immigration Origin | # Population | % Population |
| Europe | 5 | 3.1% |
| Northern Europe | 5 | 3.1% |
| Norway | 5 | 3.1% | View All 3 Rows |
Sex and Age in Deep River
Sex and Age in Deep River
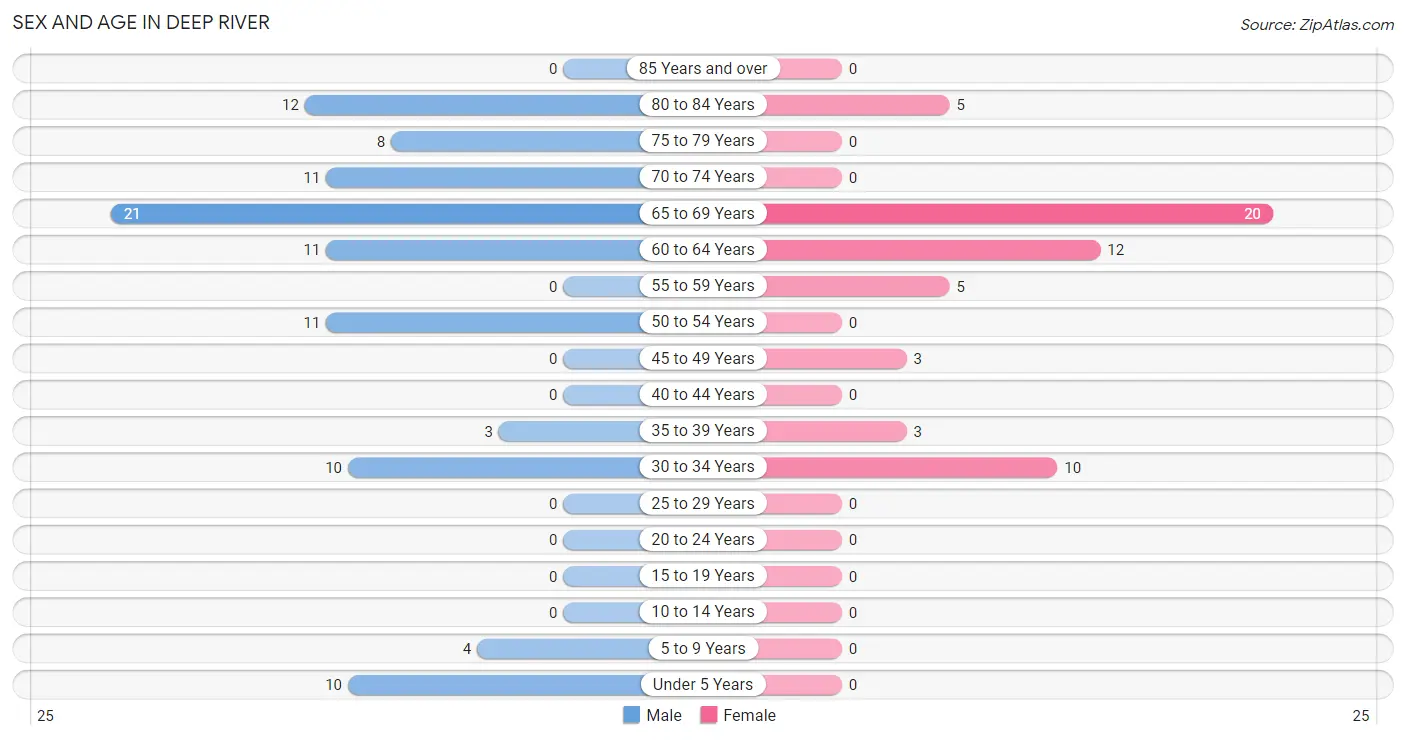
The most populous age groups in Deep River are 65 to 69 Years (21 | 20.8%) for men and 65 to 69 Years (20 | 34.5%) for women.
| Age Bracket | Male | Female |
| Under 5 Years | 10 (9.9%) | 0 (0.0%) |
| 5 to 9 Years | 4 (4.0%) | 0 (0.0%) |
| 10 to 14 Years | 0 (0.0%) | 0 (0.0%) |
| 15 to 19 Years | 0 (0.0%) | 0 (0.0%) |
| 20 to 24 Years | 0 (0.0%) | 0 (0.0%) |
| 25 to 29 Years | 0 (0.0%) | 0 (0.0%) |
| 30 to 34 Years | 10 (9.9%) | 10 (17.2%) |
| 35 to 39 Years | 3 (3.0%) | 3 (5.2%) |
| 40 to 44 Years | 0 (0.0%) | 0 (0.0%) |
| 45 to 49 Years | 0 (0.0%) | 3 (5.2%) |
| 50 to 54 Years | 11 (10.9%) | 0 (0.0%) |
| 55 to 59 Years | 0 (0.0%) | 5 (8.6%) |
| 60 to 64 Years | 11 (10.9%) | 12 (20.7%) |
| 65 to 69 Years | 21 (20.8%) | 20 (34.5%) |
| 70 to 74 Years | 11 (10.9%) | 0 (0.0%) |
| 75 to 79 Years | 8 (7.9%) | 0 (0.0%) |
| 80 to 84 Years | 12 (11.9%) | 5 (8.6%) |
| 85 Years and over | 0 (0.0%) | 0 (0.0%) |
| Total | 101 (100.0%) | 58 (100.0%) |
Families and Households in Deep River
Median Family Size in Deep River
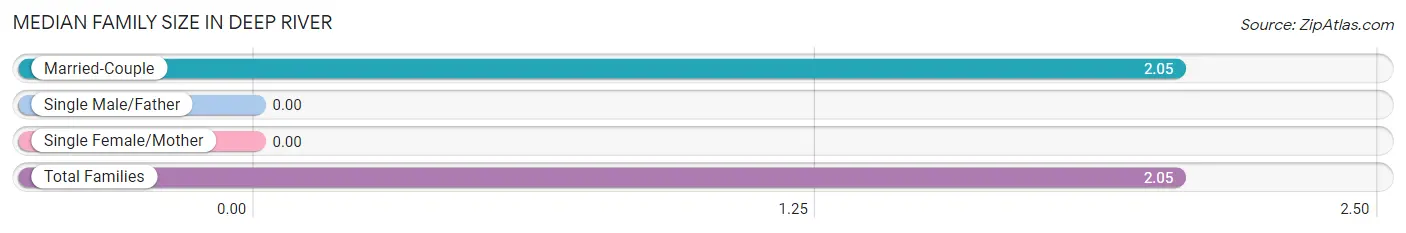
| Family Type | # Families | Family Size |
| Married-Couple | 56 (100.0%) | 2.05 |
| Single Male/Father | 0 (0.0%) | - |
| Single Female/Mother | 0 (0.0%) | - |
| Total Families | 56 (100.0%) | 2.05 |
Median Household Size in Deep River
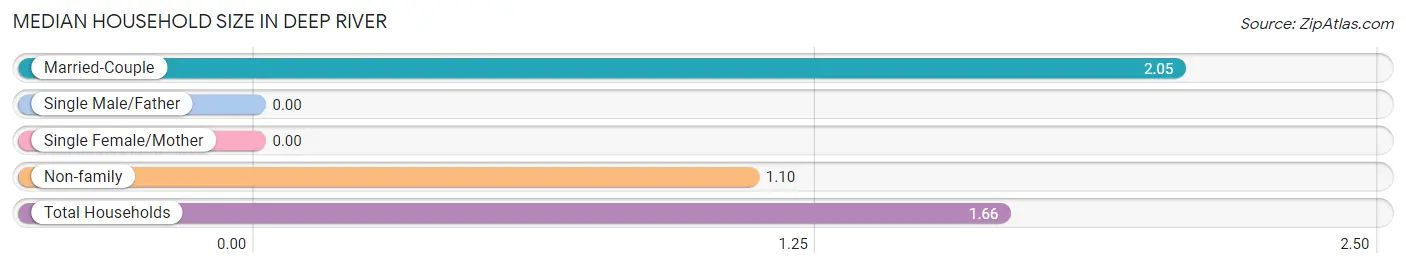
| Household Type | # Households | Household Size |
| Married-Couple | 56 (58.3%) | 2.05 |
| Single Male/Father | 0 (0.0%) | - |
| Single Female/Mother | 0 (0.0%) | - |
| Non-family | 40 (41.7%) | 1.10 |
| Total Households | 96 (100.0%) | 1.66 |
Household Size by Marriage Status in Deep River
Out of a total of 96 households in Deep River, 56 (58.3%) are family households, while 40 (41.7%) are nonfamily households. The most numerous type of family households are 2-person households, comprising 43, and the most common type of nonfamily households are 1-person households, comprising 34.
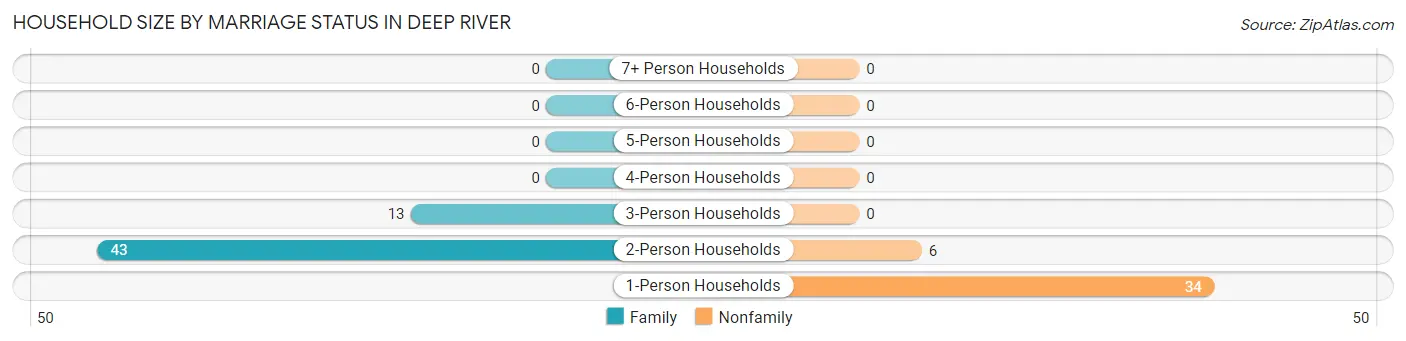
| Household Size | Family Households | Nonfamily Households |
| 1-Person Households | - | 34 (35.4%) |
| 2-Person Households | 43 (44.8%) | 6 (6.2%) |
| 3-Person Households | 13 (13.5%) | 0 (0.0%) |
| 4-Person Households | 0 (0.0%) | 0 (0.0%) |
| 5-Person Households | 0 (0.0%) | 0 (0.0%) |
| 6-Person Households | 0 (0.0%) | 0 (0.0%) |
| 7+ Person Households | 0 (0.0%) | 0 (0.0%) |
| Total | 56 (58.3%) | 40 (41.7%) |
Female Fertility in Deep River
Fertility by Age in Deep River
Average fertility rate in Deep River is 625.0 births per 1,000 women. Women in the age bracket of 20 to 34 years have the highest fertility rate with 1,000.0 births per 1,000 women. Women in the age bracket of 20 to 34 years acount for 100.0% of all women with births.
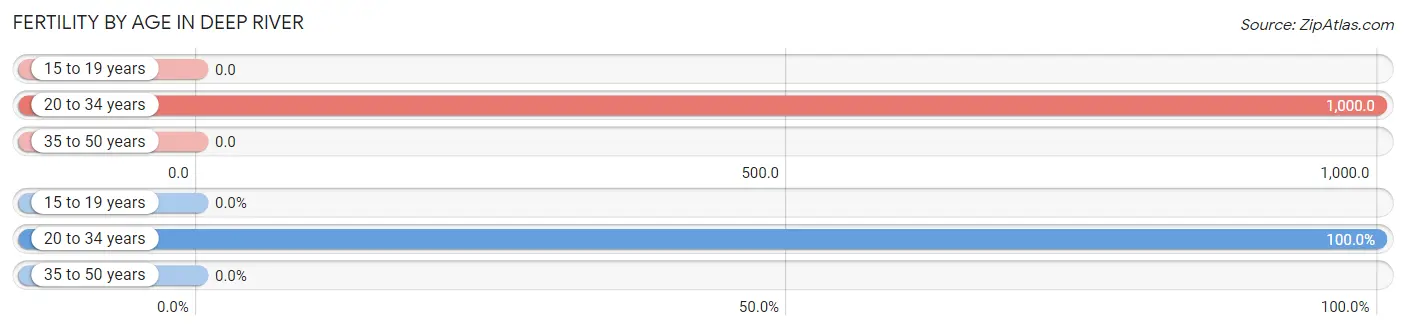
| Age Bracket | Women with Births | Births / 1,000 Women |
| 15 to 19 years | 0 (0.0%) | 0.0 |
| 20 to 34 years | 10 (100.0%) | 1,000.0 |
| 35 to 50 years | 0 (0.0%) | 0.0 |
| Total | 10 (100.0%) | 625.0 |
Fertility by Age by Marriage Status in Deep River
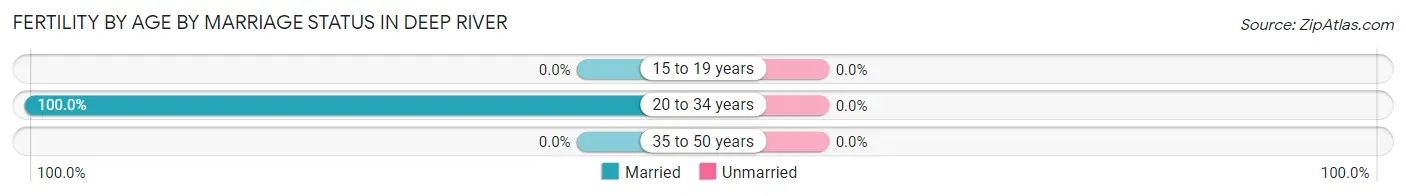
| Age Bracket | Married | Unmarried |
| 15 to 19 years | 0 (0.0%) | 0 (0.0%) |
| 20 to 34 years | 10 (100.0%) | 0 (0.0%) |
| 35 to 50 years | 0 (0.0%) | 0 (0.0%) |
| Total | 10 (100.0%) | 0 (0.0%) |
Fertility by Education in Deep River
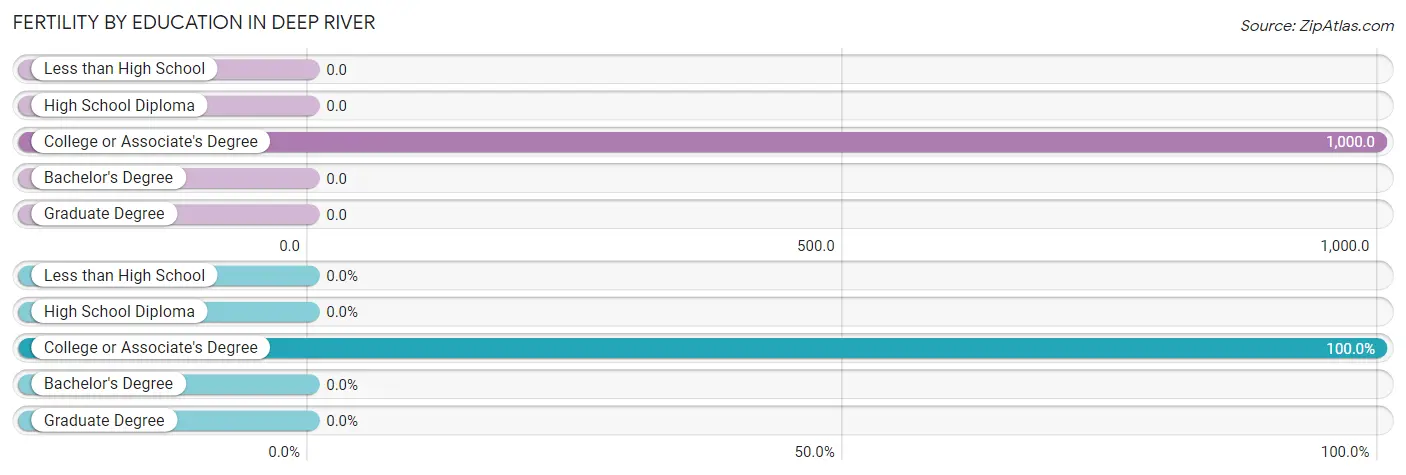
| Educational Attainment | Women with Births | Births / 1,000 Women |
| Less than High School | 0 (0.0%) | 0.0 |
| High School Diploma | 0 (0.0%) | 0.0 |
| College or Associate's Degree | 10 (100.0%) | 1,000.0 |
| Bachelor's Degree | 0 (0.0%) | 0.0 |
| Graduate Degree | 0 (0.0%) | 0.0 |
| Total | 10 (100.0%) | 625.0 |
Fertility by Education by Marriage Status in Deep River
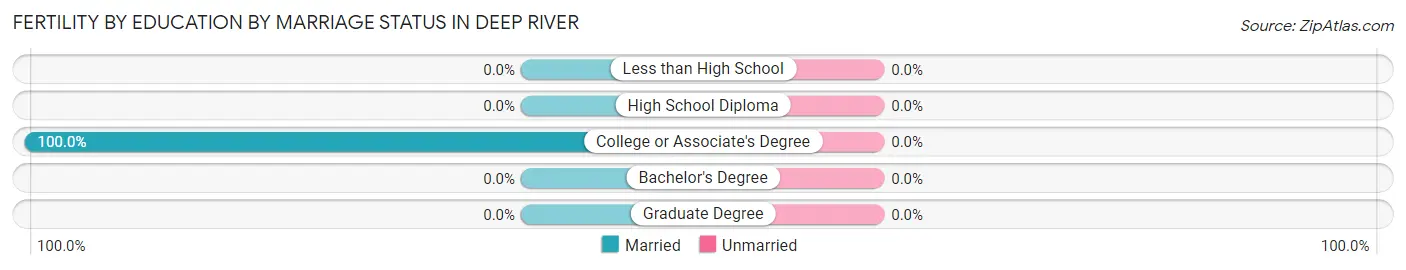
| Educational Attainment | Married | Unmarried |
| Less than High School | 0 (0.0%) | 0 (0.0%) |
| High School Diploma | 0 (0.0%) | 0 (0.0%) |
| College or Associate's Degree | 10 (100.0%) | 0 (0.0%) |
| Bachelor's Degree | 0 (0.0%) | 0 (0.0%) |
| Graduate Degree | 0 (0.0%) | 0 (0.0%) |
| Total | 10 (100.0%) | 0 (0.0%) |
Employment Characteristics in Deep River
Employment by Class of Employer in Deep River
Among the 38 employed individuals in Deep River, private company employees (23 | 60.5%), state government employees (7 | 18.4%), and self-employed (incorporated) (5 | 13.2%) make up the most common classes of employment.
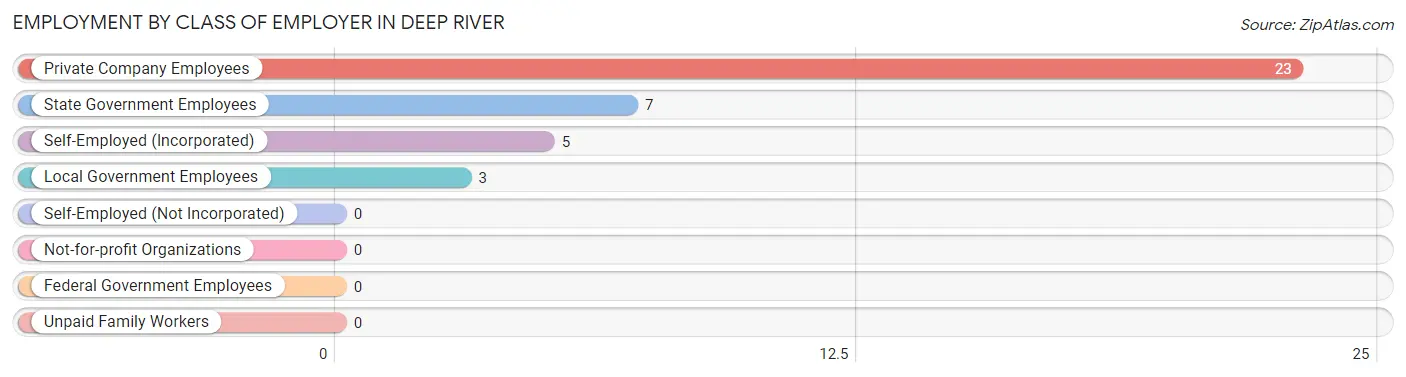
| Employer Class | # Employees | % Employees |
| Private Company Employees | 23 | 60.5% |
| Self-Employed (Incorporated) | 5 | 13.2% |
| Self-Employed (Not Incorporated) | 0 | 0.0% |
| Not-for-profit Organizations | 0 | 0.0% |
| Local Government Employees | 3 | 7.9% |
| State Government Employees | 7 | 18.4% |
| Federal Government Employees | 0 | 0.0% |
| Unpaid Family Workers | 0 | 0.0% |
| Total | 38 | 100.0% |
Employment Status by Age in Deep River
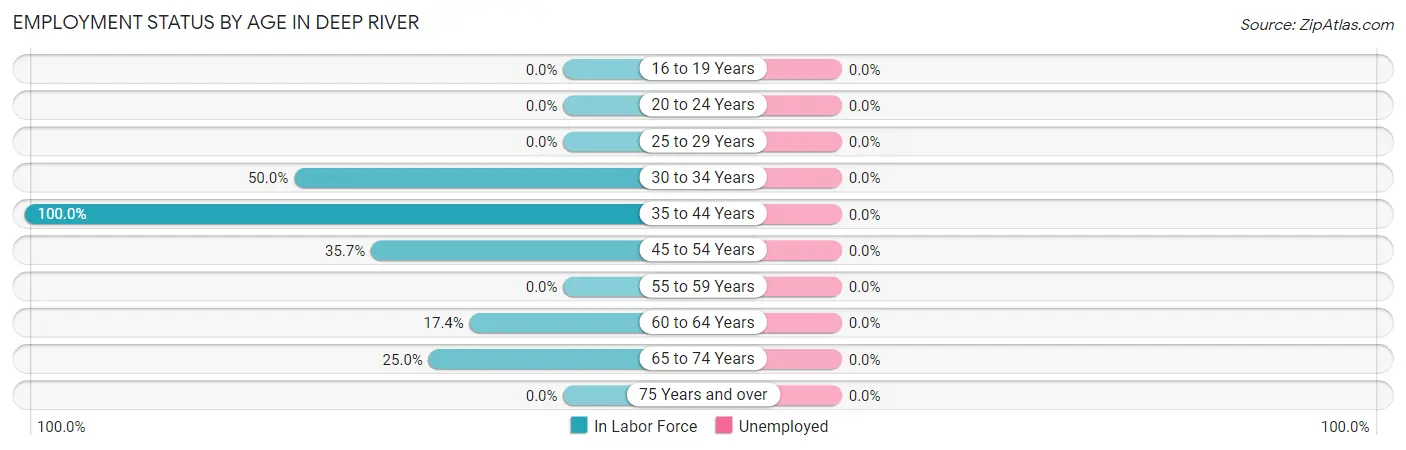
| Age Bracket | In Labor Force | Unemployed |
| 16 to 19 Years | 0 (0.0%) | 0 (0.0%) |
| 20 to 24 Years | 0 (0.0%) | 0 (0.0%) |
| 25 to 29 Years | 0 (0.0%) | 0 (0.0%) |
| 30 to 34 Years | 10 (50.0%) | 0 (0.0%) |
| 35 to 44 Years | 6 (100.0%) | 0 (0.0%) |
| 45 to 54 Years | 5 (35.7%) | 0 (0.0%) |
| 55 to 59 Years | 0 (0.0%) | 0 (0.0%) |
| 60 to 64 Years | 4 (17.4%) | 0 (0.0%) |
| 65 to 74 Years | 13 (25.0%) | 0 (0.0%) |
| 75 Years and over | 0 (0.0%) | 0 (0.0%) |
| Total | 38 (26.2%) | 0 (0.0%) |
Employment Status by Educational Attainment in Deep River
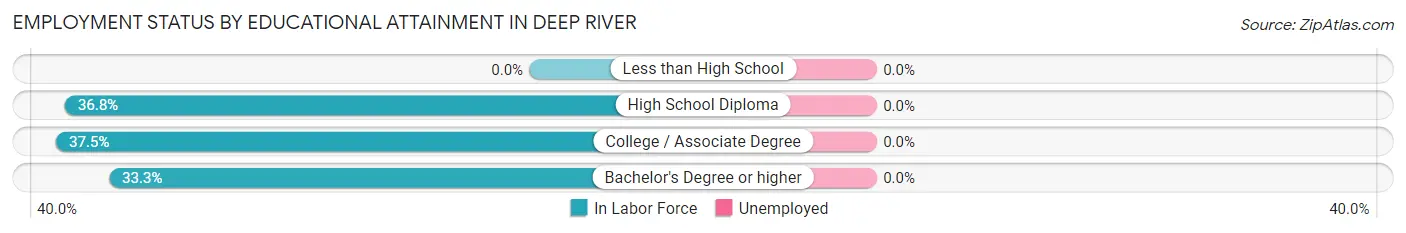
| Educational Attainment | In Labor Force | Unemployed |
| Less than High School | 0 (0.0%) | 0 (0.0%) |
| High School Diploma | 7 (36.8%) | 0 (0.0%) |
| College / Associate Degree | 15 (37.5%) | 0 (0.0%) |
| Bachelor's Degree or higher | 3 (33.3%) | 0 (0.0%) |
| Total | 25 (36.8%) | 0 (0.0%) |
Employment Occupations by Sex in Deep River
Management, Business, Science and Arts Occupations
The most common Management, Business, Science and Arts occupations in Deep River are Community & Social Service (7 | 18.4%), and Education Instruction & Library (7 | 18.4%).
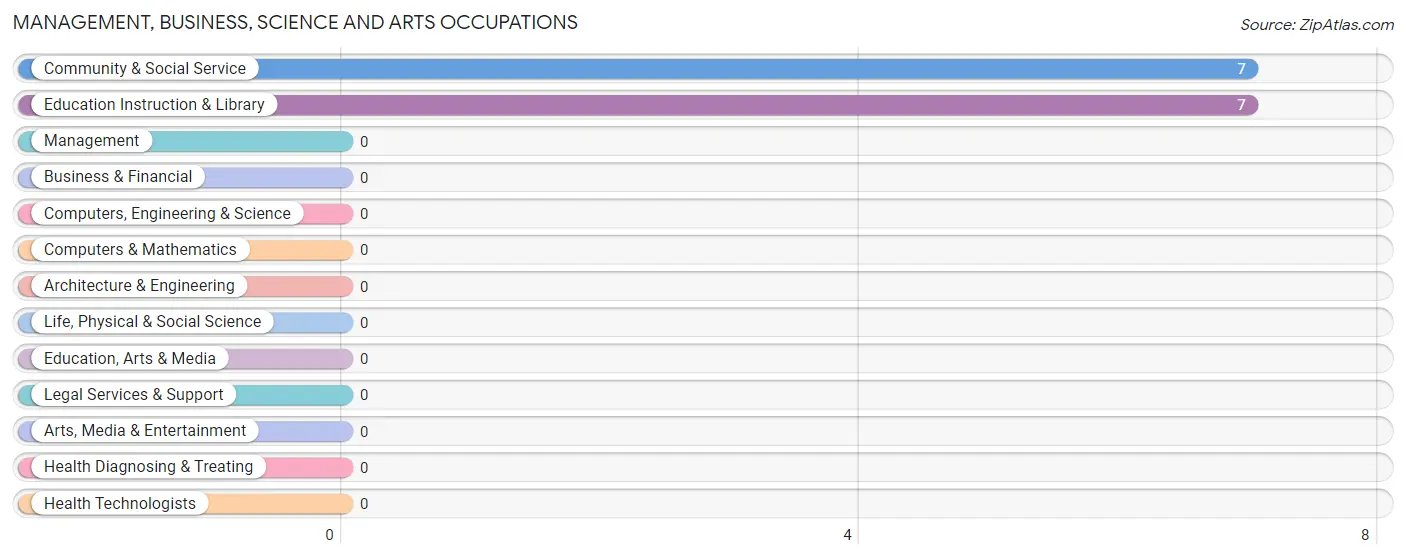
Management, Business, Science and Arts Occupations by Sex
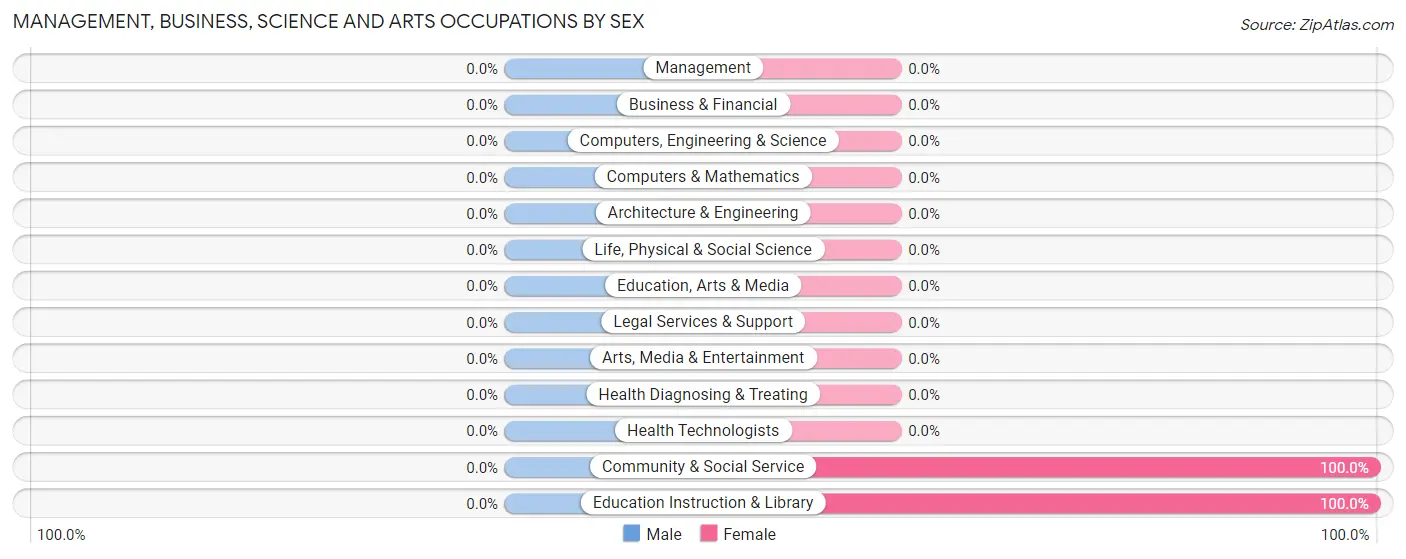
| Occupation | Male | Female |
| Management | 0 (0.0%) | 0 (0.0%) |
| Business & Financial | 0 (0.0%) | 0 (0.0%) |
| Computers, Engineering & Science | 0 (0.0%) | 0 (0.0%) |
| Computers & Mathematics | 0 (0.0%) | 0 (0.0%) |
| Architecture & Engineering | 0 (0.0%) | 0 (0.0%) |
| Life, Physical & Social Science | 0 (0.0%) | 0 (0.0%) |
| Community & Social Service | 0 (0.0%) | 7 (100.0%) |
| Education, Arts & Media | 0 (0.0%) | 0 (0.0%) |
| Legal Services & Support | 0 (0.0%) | 0 (0.0%) |
| Education Instruction & Library | 0 (0.0%) | 7 (100.0%) |
| Arts, Media & Entertainment | 0 (0.0%) | 0 (0.0%) |
| Health Diagnosing & Treating | 0 (0.0%) | 0 (0.0%) |
| Health Technologists | 0 (0.0%) | 0 (0.0%) |
| Total (Category) | 0 (0.0%) | 7 (100.0%) |
| Total (Overall) | 14 (36.8%) | 24 (63.2%) |
Services Occupations
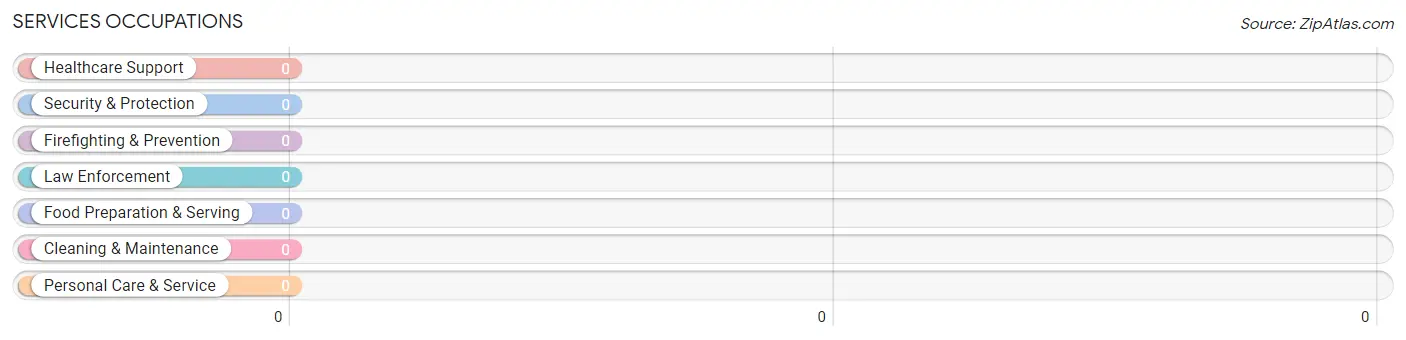
Services Occupations by Sex
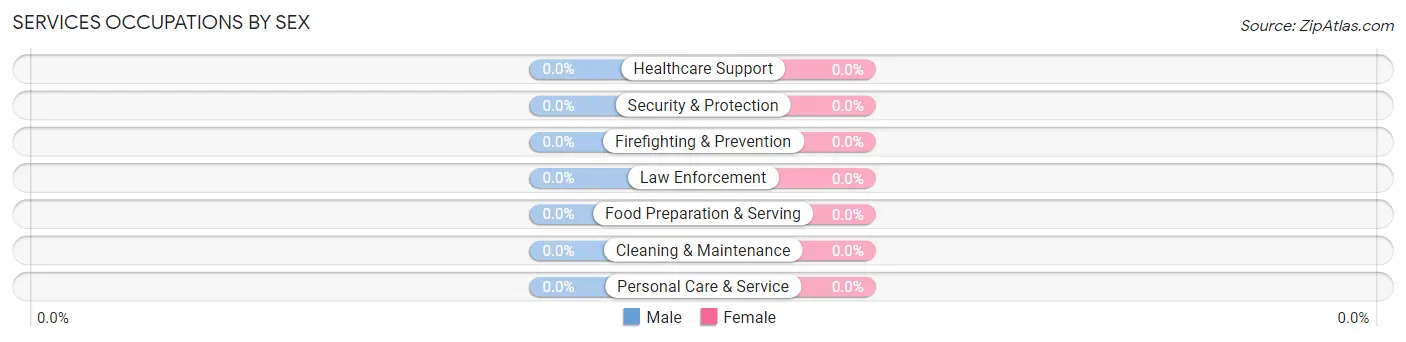
| Occupation | Male | Female |
| Healthcare Support | 0 (0.0%) | 0 (0.0%) |
| Security & Protection | 0 (0.0%) | 0 (0.0%) |
| Firefighting & Prevention | 0 (0.0%) | 0 (0.0%) |
| Law Enforcement | 0 (0.0%) | 0 (0.0%) |
| Food Preparation & Serving | 0 (0.0%) | 0 (0.0%) |
| Cleaning & Maintenance | 0 (0.0%) | 0 (0.0%) |
| Personal Care & Service | 0 (0.0%) | 0 (0.0%) |
| Total (Category) | 0 (0.0%) | 0 (0.0%) |
| Total (Overall) | 14 (36.8%) | 24 (63.2%) |
Sales and Office Occupations
The most common Sales and Office occupations in Deep River are Office & Administration (17 | 44.7%), and Sales & Related (6 | 15.8%).
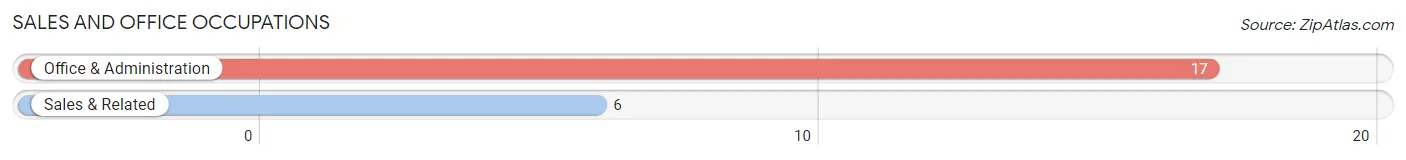
Sales and Office Occupations by Sex

| Occupation | Male | Female |
| Sales & Related | 6 (100.0%) | 0 (0.0%) |
| Office & Administration | 0 (0.0%) | 17 (100.0%) |
| Total (Category) | 6 (26.1%) | 17 (73.9%) |
| Total (Overall) | 14 (36.8%) | 24 (63.2%) |
Natural Resources, Construction and Maintenance Occupations
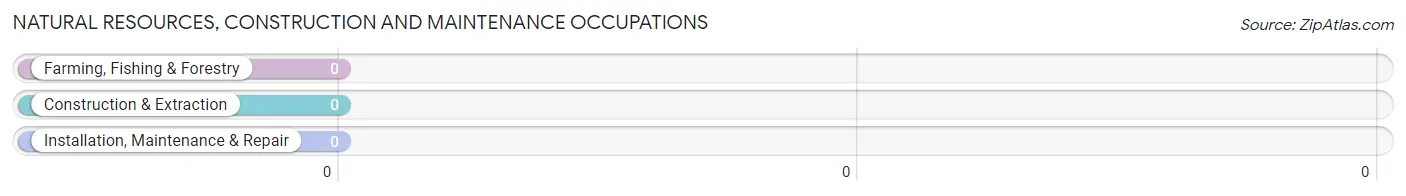
Natural Resources, Construction and Maintenance Occupations by Sex
| Occupation | Male | Female |
| Farming, Fishing & Forestry | 0 (0.0%) | 0 (0.0%) |
| Construction & Extraction | 0 (0.0%) | 0 (0.0%) |
| Installation, Maintenance & Repair | 0 (0.0%) | 0 (0.0%) |
| Total (Category) | 0 (0.0%) | 0 (0.0%) |
| Total (Overall) | 14 (36.8%) | 24 (63.2%) |
Production, Transportation and Moving Occupations
The most common Production, Transportation and Moving occupations in Deep River are , and Transportation (8 | 21.0%).
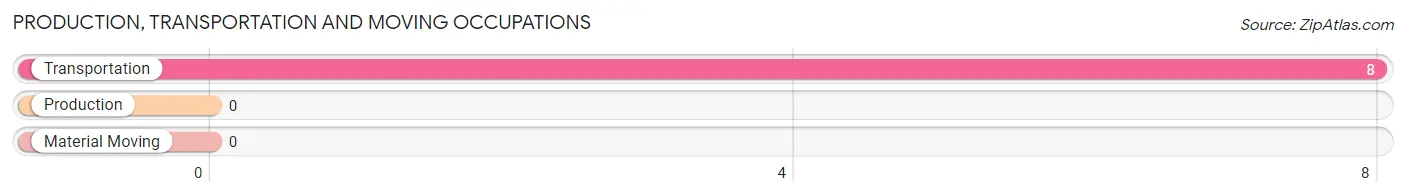
Production, Transportation and Moving Occupations by Sex
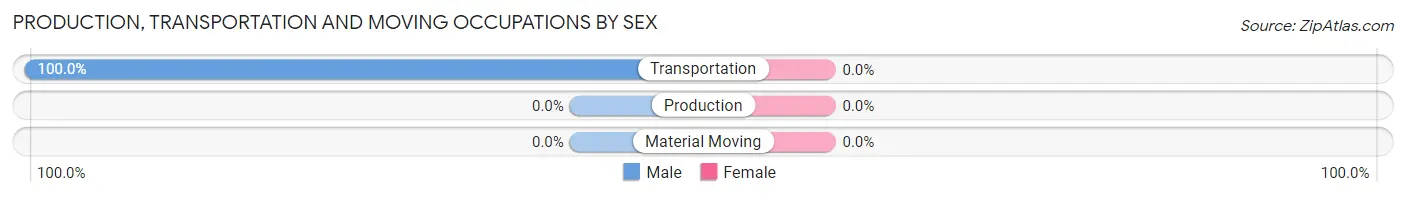
| Occupation | Male | Female |
| Production | 0 (0.0%) | 0 (0.0%) |
| Transportation | 8 (100.0%) | 0 (0.0%) |
| Material Moving | 0 (0.0%) | 0 (0.0%) |
| Total (Category) | 8 (100.0%) | 0 (0.0%) |
| Total (Overall) | 14 (36.8%) | 24 (63.2%) |
Employment Industries by Sex in Deep River
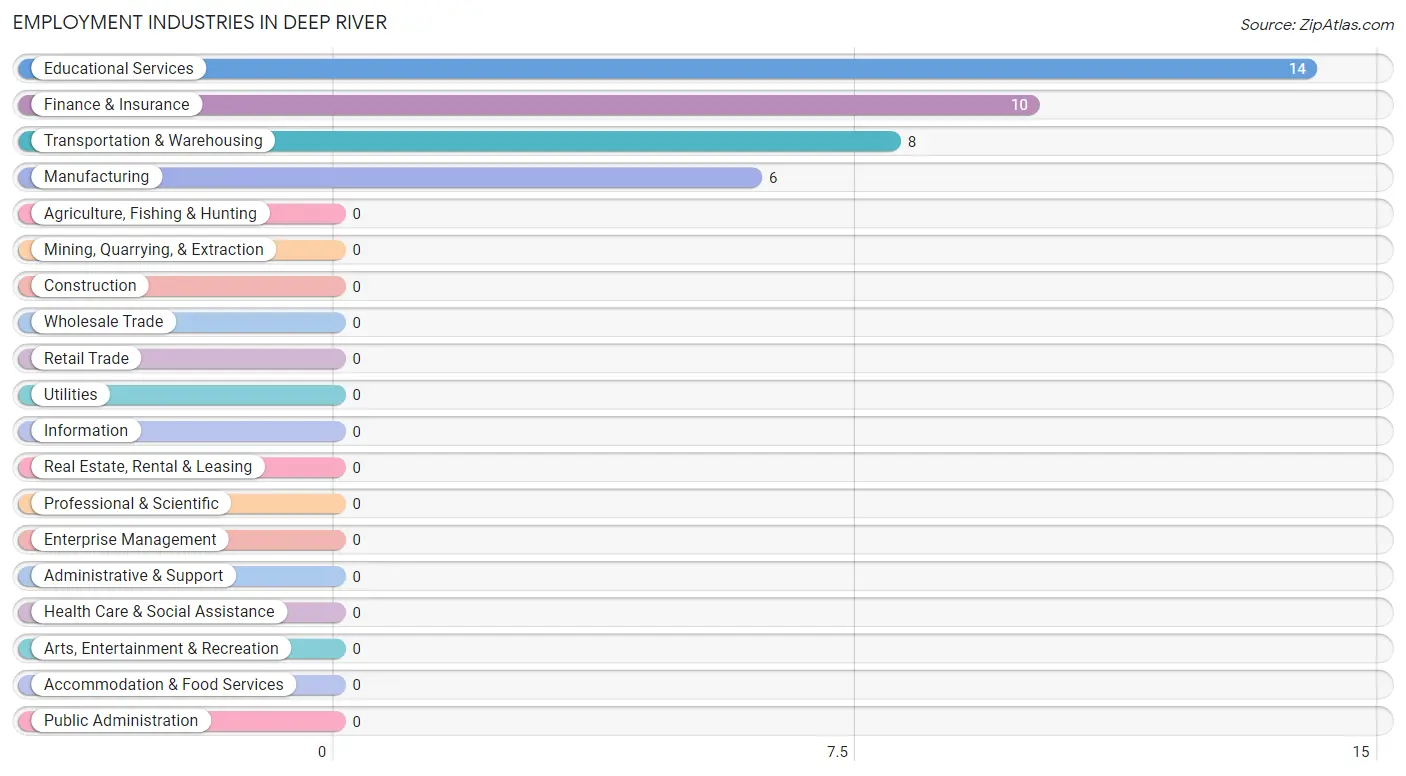
Employment Industries in Deep River
The major employment industries in Deep River include Educational Services (14 | 36.8%), Finance & Insurance (10 | 26.3%), Transportation & Warehousing (8 | 21.0%), and Manufacturing (6 | 15.8%).
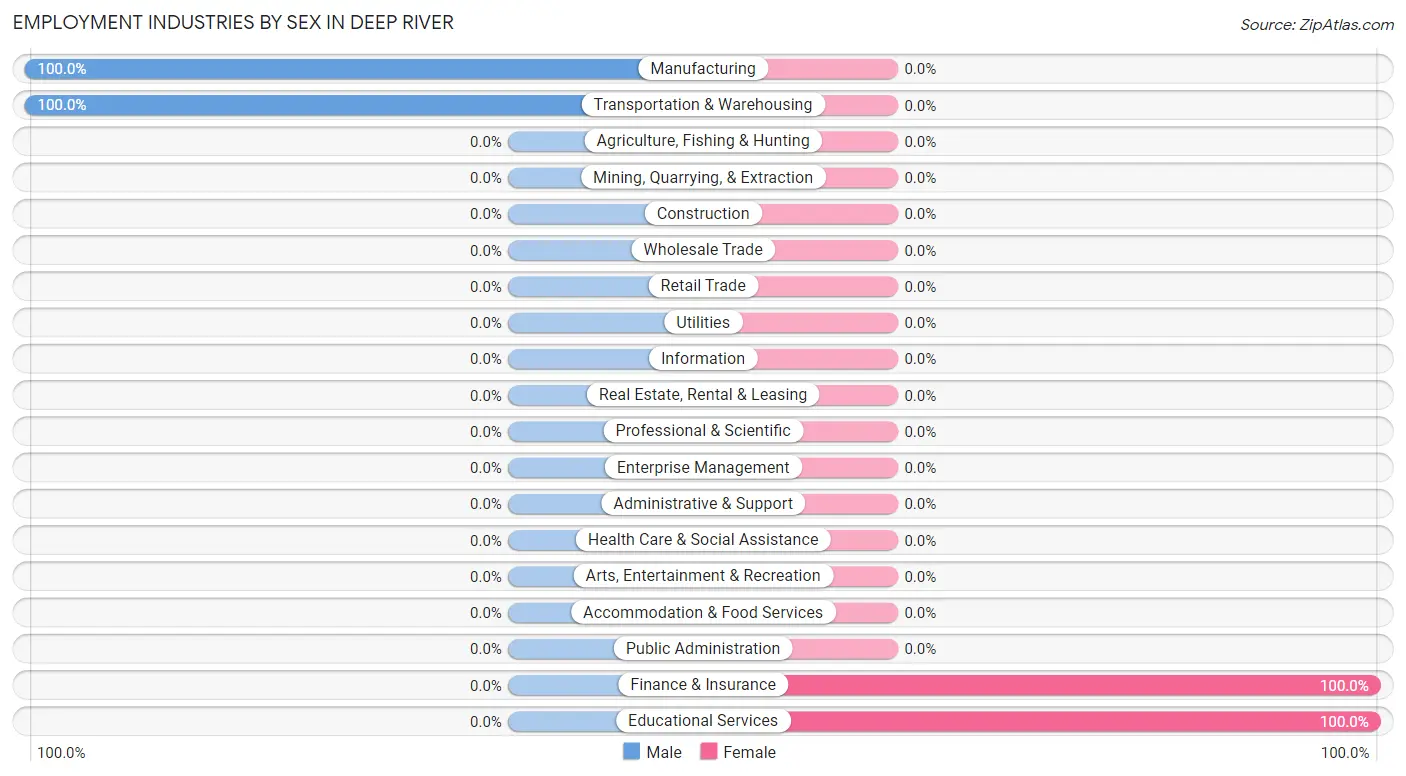
Employment Industries by Sex in Deep River
The Deep River industries that see more men than women are Manufacturing (100.0%), and Transportation & Warehousing (100.0%), whereas the industries that tend to have a higher number of women are Finance & Insurance (100.0%), and Educational Services (100.0%).
| Industry | Male | Female |
| Agriculture, Fishing & Hunting | 0 (0.0%) | 0 (0.0%) |
| Mining, Quarrying, & Extraction | 0 (0.0%) | 0 (0.0%) |
| Construction | 0 (0.0%) | 0 (0.0%) |
| Manufacturing | 6 (100.0%) | 0 (0.0%) |
| Wholesale Trade | 0 (0.0%) | 0 (0.0%) |
| Retail Trade | 0 (0.0%) | 0 (0.0%) |
| Transportation & Warehousing | 8 (100.0%) | 0 (0.0%) |
| Utilities | 0 (0.0%) | 0 (0.0%) |
| Information | 0 (0.0%) | 0 (0.0%) |
| Finance & Insurance | 0 (0.0%) | 10 (100.0%) |
| Real Estate, Rental & Leasing | 0 (0.0%) | 0 (0.0%) |
| Professional & Scientific | 0 (0.0%) | 0 (0.0%) |
| Enterprise Management | 0 (0.0%) | 0 (0.0%) |
| Administrative & Support | 0 (0.0%) | 0 (0.0%) |
| Educational Services | 0 (0.0%) | 14 (100.0%) |
| Health Care & Social Assistance | 0 (0.0%) | 0 (0.0%) |
| Arts, Entertainment & Recreation | 0 (0.0%) | 0 (0.0%) |
| Accommodation & Food Services | 0 (0.0%) | 0 (0.0%) |
| Public Administration | 0 (0.0%) | 0 (0.0%) |
| Total | 14 (36.8%) | 24 (63.2%) |
Education in Deep River
School Enrollment in Deep River
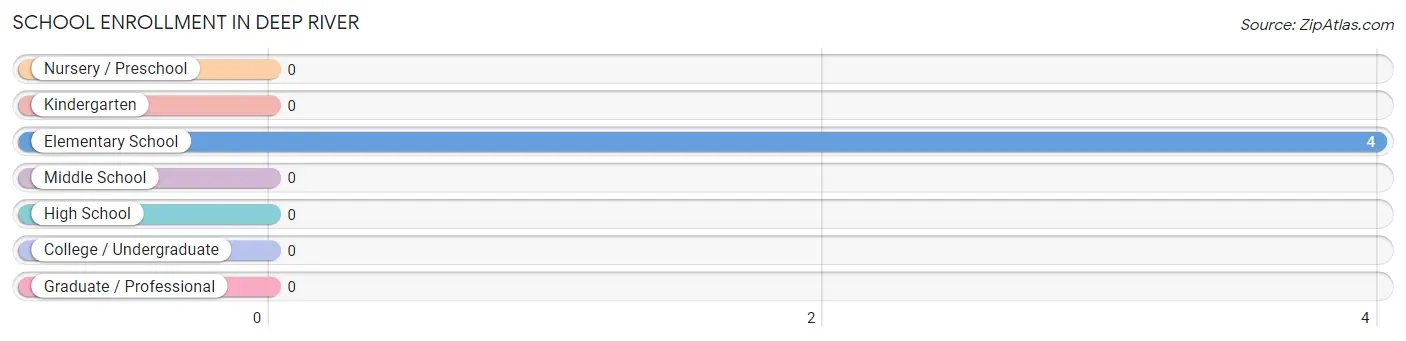
| School Level | # Students | % Students |
| Nursery / Preschool | 0 | 0.0% |
| Kindergarten | 0 | 0.0% |
| Elementary School | 4 | 100.0% |
| Middle School | 0 | 0.0% |
| High School | 0 | 0.0% |
| College / Undergraduate | 0 | 0.0% |
| Graduate / Professional | 0 | 0.0% |
| Total | 4 | 100.0% |
School Enrollment by Age by Funding Source in Deep River
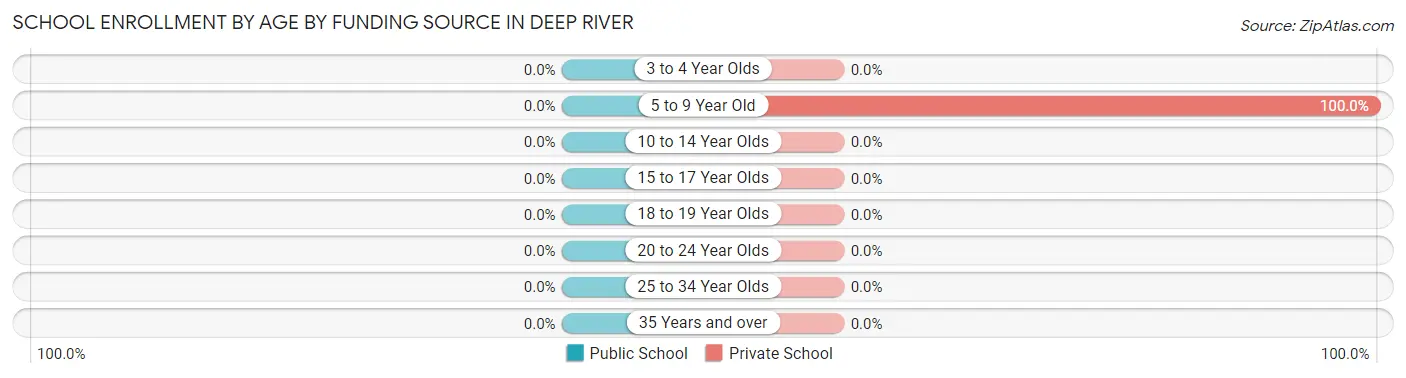
| Age Bracket | Public School | Private School |
| 3 to 4 Year Olds | 0 (0.0%) | 0 (0.0%) |
| 5 to 9 Year Old | 0 (0.0%) | 4 (100.0%) |
| 10 to 14 Year Olds | 0 (0.0%) | 0 (0.0%) |
| 15 to 17 Year Olds | 0 (0.0%) | 0 (0.0%) |
| 18 to 19 Year Olds | 0 (0.0%) | 0 (0.0%) |
| 20 to 24 Year Olds | 0 (0.0%) | 0 (0.0%) |
| 25 to 34 Year Olds | 0 (0.0%) | 0 (0.0%) |
| 35 Years and over | 0 (0.0%) | 0 (0.0%) |
| Total | 0 (0.0%) | 4 (100.0%) |
Educational Attainment by Field of Study in Deep River
Education (11 | 35.5%), psychology (9 | 29.0%), business (7 | 22.6%), and bio, nature & agricultural (4 | 12.9%) are the most common fields of study among 31 individuals in Deep River who have obtained a bachelor's degree or higher.
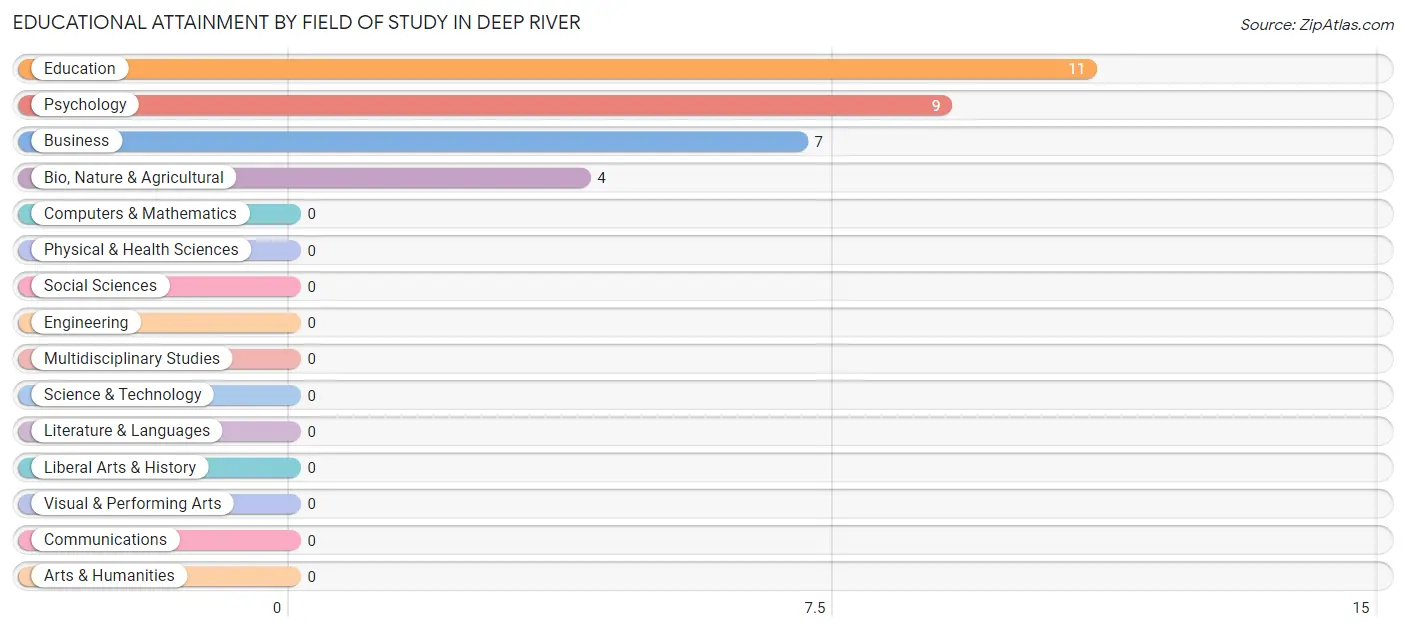
| Field of Study | # Graduates | % Graduates |
| Computers & Mathematics | 0 | 0.0% |
| Bio, Nature & Agricultural | 4 | 12.9% |
| Physical & Health Sciences | 0 | 0.0% |
| Psychology | 9 | 29.0% |
| Social Sciences | 0 | 0.0% |
| Engineering | 0 | 0.0% |
| Multidisciplinary Studies | 0 | 0.0% |
| Science & Technology | 0 | 0.0% |
| Business | 7 | 22.6% |
| Education | 11 | 35.5% |
| Literature & Languages | 0 | 0.0% |
| Liberal Arts & History | 0 | 0.0% |
| Visual & Performing Arts | 0 | 0.0% |
| Communications | 0 | 0.0% |
| Arts & Humanities | 0 | 0.0% |
| Total | 31 | 100.0% |
Transportation & Commute in Deep River
Vehicle Availability by Sex in Deep River
The most prevalent vehicle ownership categories in Deep River are males with 2 vehicles (11, accounting for 78.6%) and females with 2 vehicles (14, making up 45.8%).
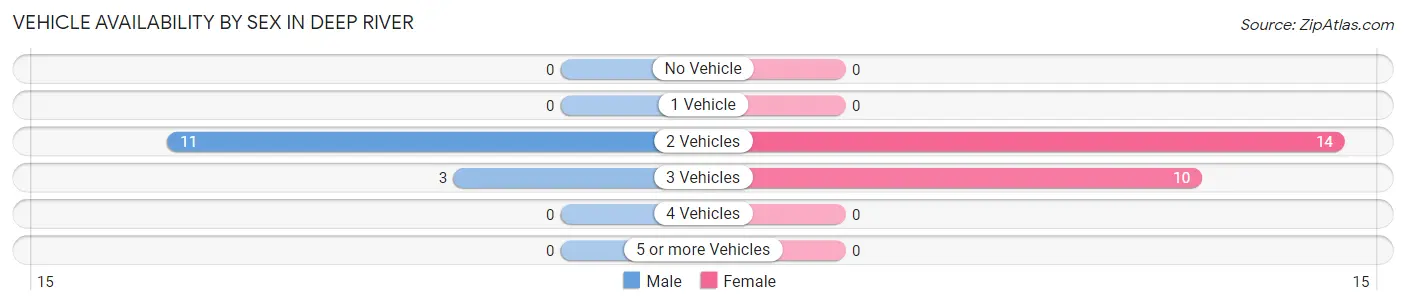
| Vehicles Available | Male | Female |
| No Vehicle | 0 (0.0%) | 0 (0.0%) |
| 1 Vehicle | 0 (0.0%) | 0 (0.0%) |
| 2 Vehicles | 11 (78.6%) | 14 (58.3%) |
| 3 Vehicles | 3 (21.4%) | 10 (41.7%) |
| 4 Vehicles | 0 (0.0%) | 0 (0.0%) |
| 5 or more Vehicles | 0 (0.0%) | 0 (0.0%) |
| Total | 14 (100.0%) | 24 (100.0%) |
Commute Time in Deep River
The most frequently occuring commute durations in Deep River are 20 to 24 minutes (17 commuters, 44.7%), 90 or more minutes (14 commuters, 36.8%), and 45 to 59 minutes (4 commuters, 10.5%).
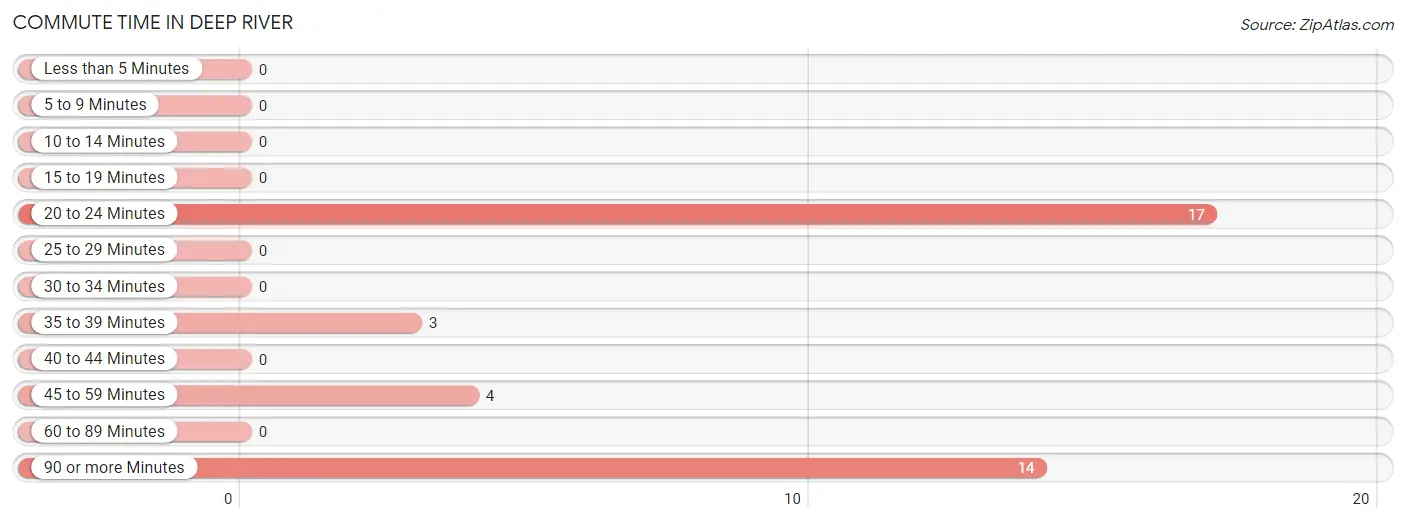
| Commute Time | # Commuters | % Commuters |
| Less than 5 Minutes | 0 | 0.0% |
| 5 to 9 Minutes | 0 | 0.0% |
| 10 to 14 Minutes | 0 | 0.0% |
| 15 to 19 Minutes | 0 | 0.0% |
| 20 to 24 Minutes | 17 | 44.7% |
| 25 to 29 Minutes | 0 | 0.0% |
| 30 to 34 Minutes | 0 | 0.0% |
| 35 to 39 Minutes | 3 | 7.9% |
| 40 to 44 Minutes | 0 | 0.0% |
| 45 to 59 Minutes | 4 | 10.5% |
| 60 to 89 Minutes | 0 | 0.0% |
| 90 or more Minutes | 14 | 36.8% |
Commute Time by Sex in Deep River
The most common commute times in Deep River are 90 or more minutes (14 commuters, 100.0%) for males and 20 to 24 minutes (17 commuters, 70.8%) for females.
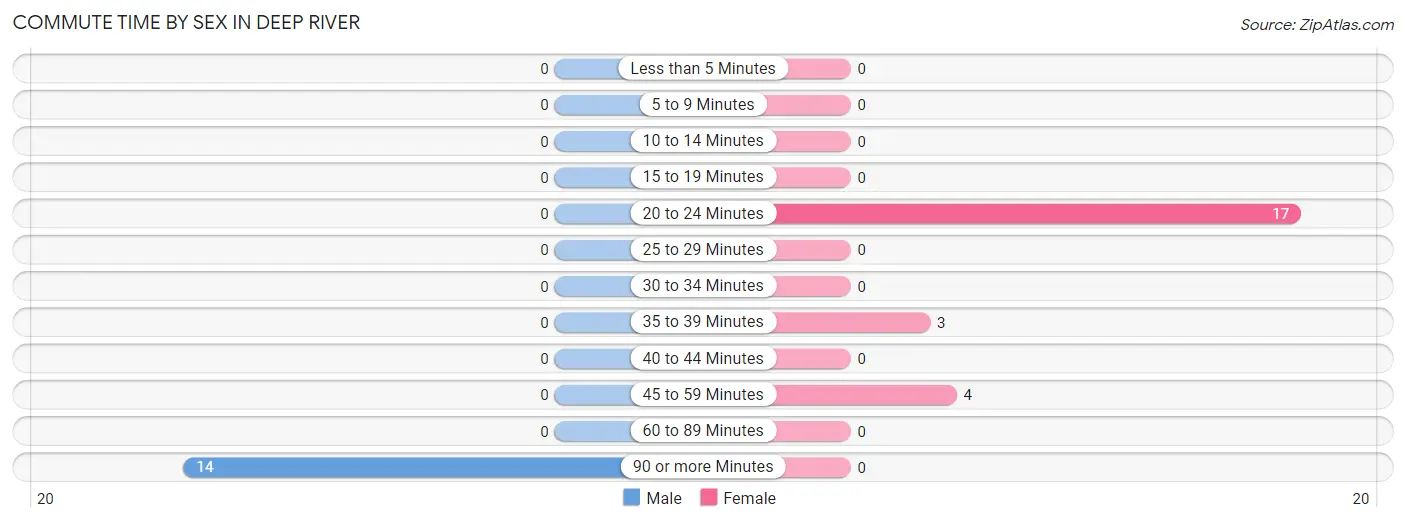
| Commute Time | Male | Female |
| Less than 5 Minutes | 0 (0.0%) | 0 (0.0%) |
| 5 to 9 Minutes | 0 (0.0%) | 0 (0.0%) |
| 10 to 14 Minutes | 0 (0.0%) | 0 (0.0%) |
| 15 to 19 Minutes | 0 (0.0%) | 0 (0.0%) |
| 20 to 24 Minutes | 0 (0.0%) | 17 (70.8%) |
| 25 to 29 Minutes | 0 (0.0%) | 0 (0.0%) |
| 30 to 34 Minutes | 0 (0.0%) | 0 (0.0%) |
| 35 to 39 Minutes | 0 (0.0%) | 3 (12.5%) |
| 40 to 44 Minutes | 0 (0.0%) | 0 (0.0%) |
| 45 to 59 Minutes | 0 (0.0%) | 4 (16.7%) |
| 60 to 89 Minutes | 0 (0.0%) | 0 (0.0%) |
| 90 or more Minutes | 14 (100.0%) | 0 (0.0%) |
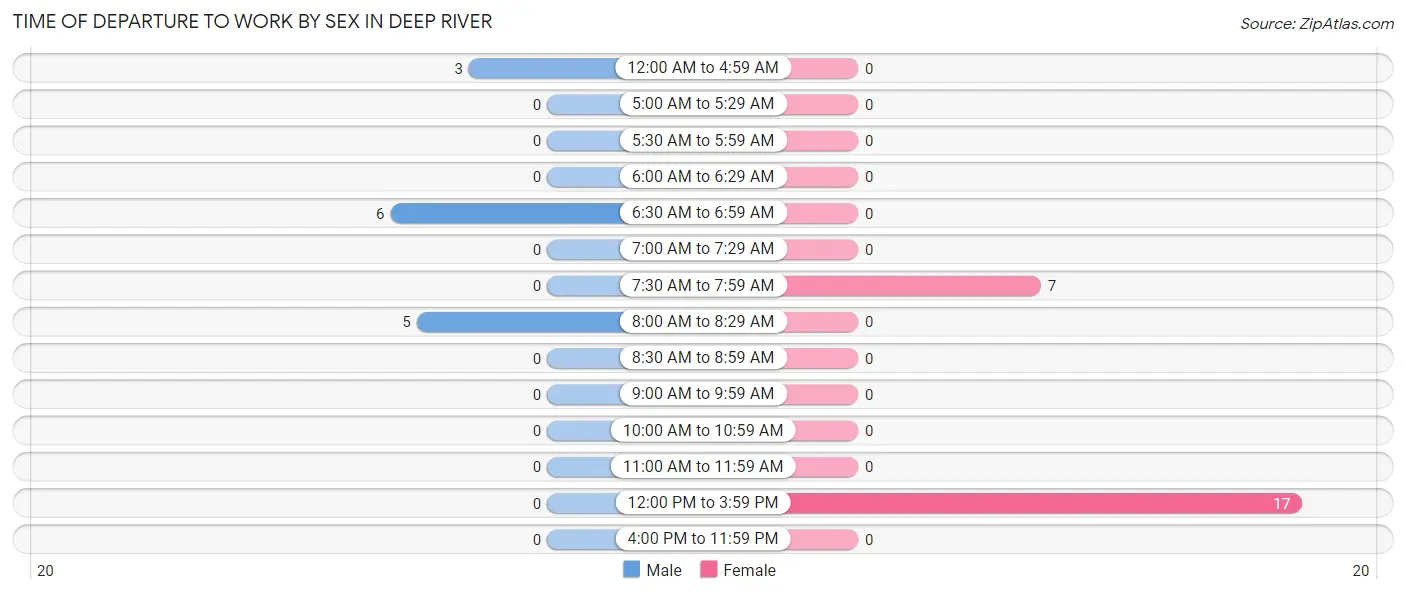
Time of Departure to Work by Sex in Deep River
The most frequent times of departure to work in Deep River are 6:30 AM to 6:59 AM (6, 42.9%) for males and 12:00 PM to 3:59 PM (17, 70.8%) for females.
| Time of Departure | Male | Female |
| 12:00 AM to 4:59 AM | 3 (21.4%) | 0 (0.0%) |
| 5:00 AM to 5:29 AM | 0 (0.0%) | 0 (0.0%) |
| 5:30 AM to 5:59 AM | 0 (0.0%) | 0 (0.0%) |
| 6:00 AM to 6:29 AM | 0 (0.0%) | 0 (0.0%) |
| 6:30 AM to 6:59 AM | 6 (42.9%) | 0 (0.0%) |
| 7:00 AM to 7:29 AM | 0 (0.0%) | 0 (0.0%) |
| 7:30 AM to 7:59 AM | 0 (0.0%) | 7 (29.2%) |
| 8:00 AM to 8:29 AM | 5 (35.7%) | 0 (0.0%) |
| 8:30 AM to 8:59 AM | 0 (0.0%) | 0 (0.0%) |
| 9:00 AM to 9:59 AM | 0 (0.0%) | 0 (0.0%) |
| 10:00 AM to 10:59 AM | 0 (0.0%) | 0 (0.0%) |
| 11:00 AM to 11:59 AM | 0 (0.0%) | 0 (0.0%) |
| 12:00 PM to 3:59 PM | 0 (0.0%) | 17 (70.8%) |
| 4:00 PM to 11:59 PM | 0 (0.0%) | 0 (0.0%) |
| Total | 14 (100.0%) | 24 (100.0%) |
Housing Occupancy in Deep River
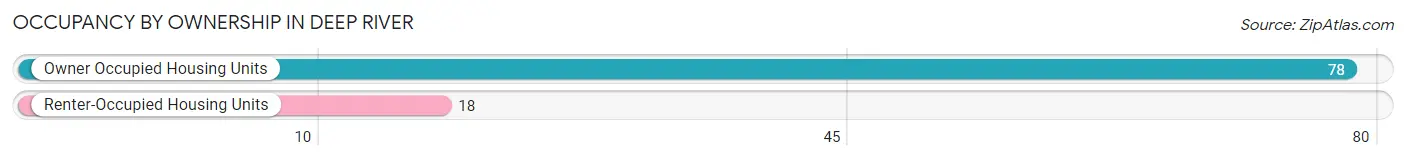
Occupancy by Ownership in Deep River
Of the total 96 dwellings in Deep River, owner-occupied units account for 78 (81.2%), while renter-occupied units make up 18 (18.8%).
| Occupancy | # Housing Units | % Housing Units |
| Owner Occupied Housing Units | 78 | 81.2% |
| Renter-Occupied Housing Units | 18 | 18.8% |
| Total Occupied Housing Units | 96 | 100.0% |
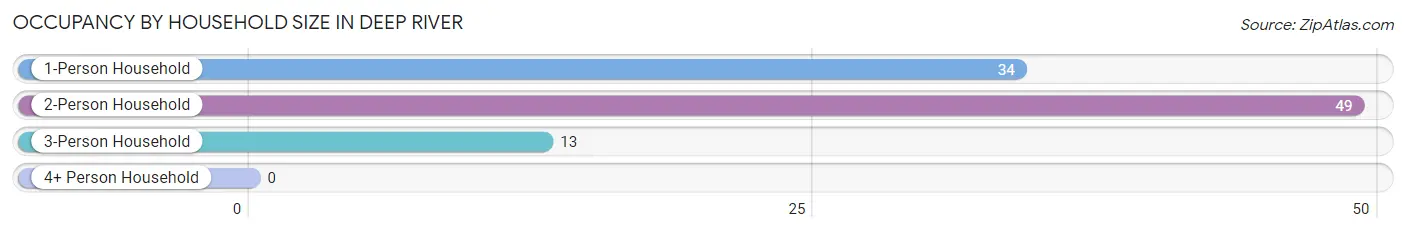
Occupancy by Household Size in Deep River
| Household Size | # Housing Units | % Housing Units |
| 1-Person Household | 34 | 35.4% |
| 2-Person Household | 49 | 51.0% |
| 3-Person Household | 13 | 13.5% |
| 4+ Person Household | 0 | 0.0% |
| Total Housing Units | 96 | 100.0% |
Occupancy by Ownership by Household Size in Deep River
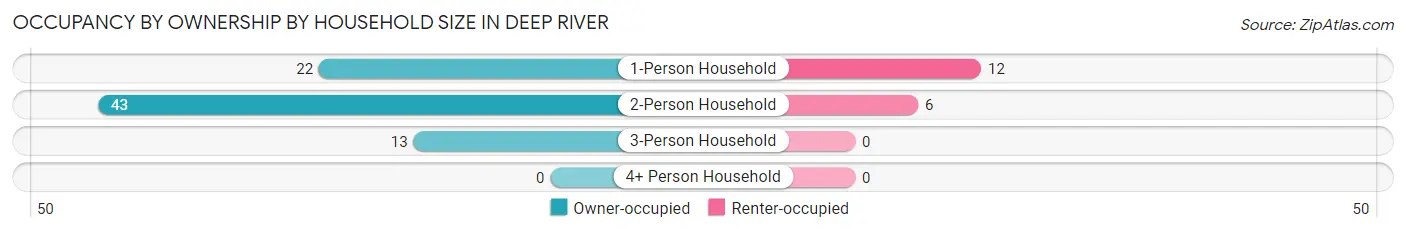
| Household Size | Owner-occupied | Renter-occupied |
| 1-Person Household | 22 (64.7%) | 12 (35.3%) |
| 2-Person Household | 43 (87.8%) | 6 (12.2%) |
| 3-Person Household | 13 (100.0%) | 0 (0.0%) |
| 4+ Person Household | 0 (0.0%) | 0 (0.0%) |
| Total Housing Units | 78 (81.2%) | 18 (18.8%) |
Occupancy by Educational Attainment in Deep River
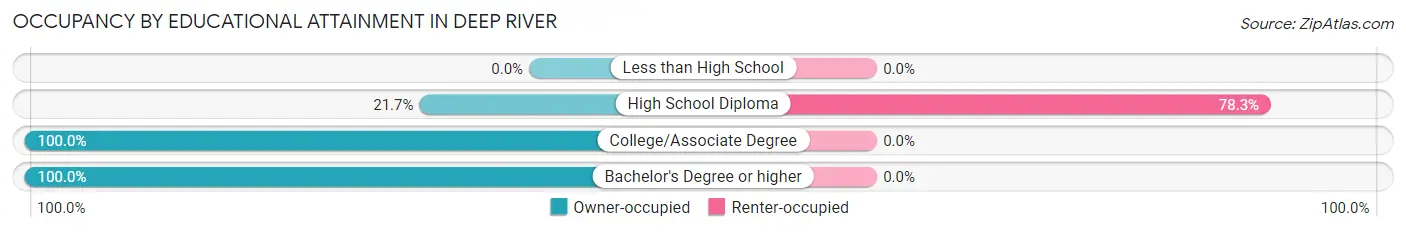
| Household Size | Owner-occupied | Renter-occupied |
| Less than High School | 0 (0.0%) | 0 (0.0%) |
| High School Diploma | 5 (21.7%) | 18 (78.3%) |
| College/Associate Degree | 42 (100.0%) | 0 (0.0%) |
| Bachelor's Degree or higher | 31 (100.0%) | 0 (0.0%) |
Occupancy by Age of Householder in Deep River
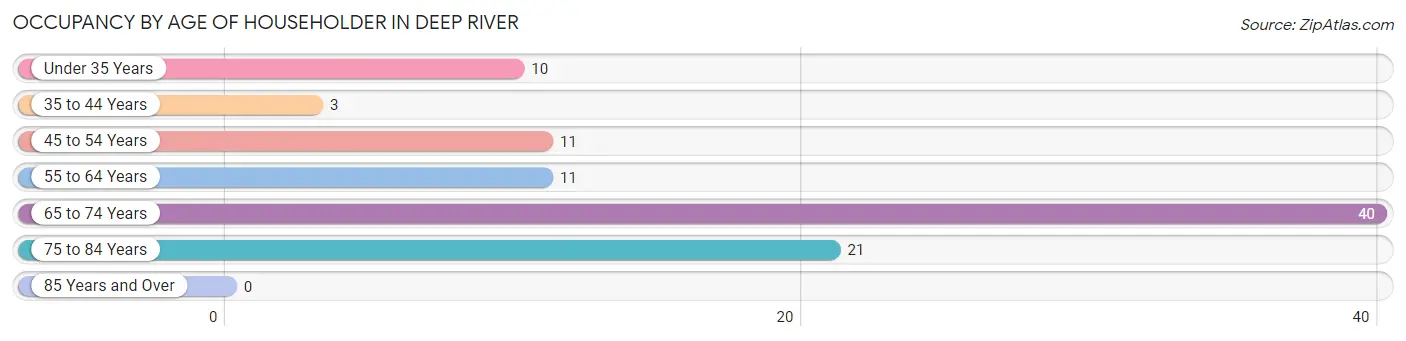
| Age Bracket | # Households | % Households |
| Under 35 Years | 10 | 10.4% |
| 35 to 44 Years | 3 | 3.1% |
| 45 to 54 Years | 11 | 11.5% |
| 55 to 64 Years | 11 | 11.5% |
| 65 to 74 Years | 40 | 41.7% |
| 75 to 84 Years | 21 | 21.9% |
| 85 Years and Over | 0 | 0.0% |
| Total | 96 | 100.0% |
Housing Finances in Deep River
Median Income by Occupancy in Deep River
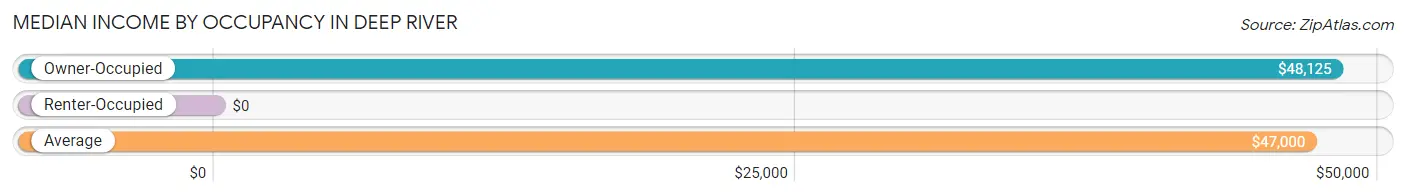
| Occupancy Type | # Households | Median Income |
| Owner-Occupied | 78 (81.2%) | $48,125 |
| Renter-Occupied | 18 (18.8%) | $0 |
| Average | 96 (100.0%) | $47,000 |
Occupancy by Householder Income Bracket in Deep River
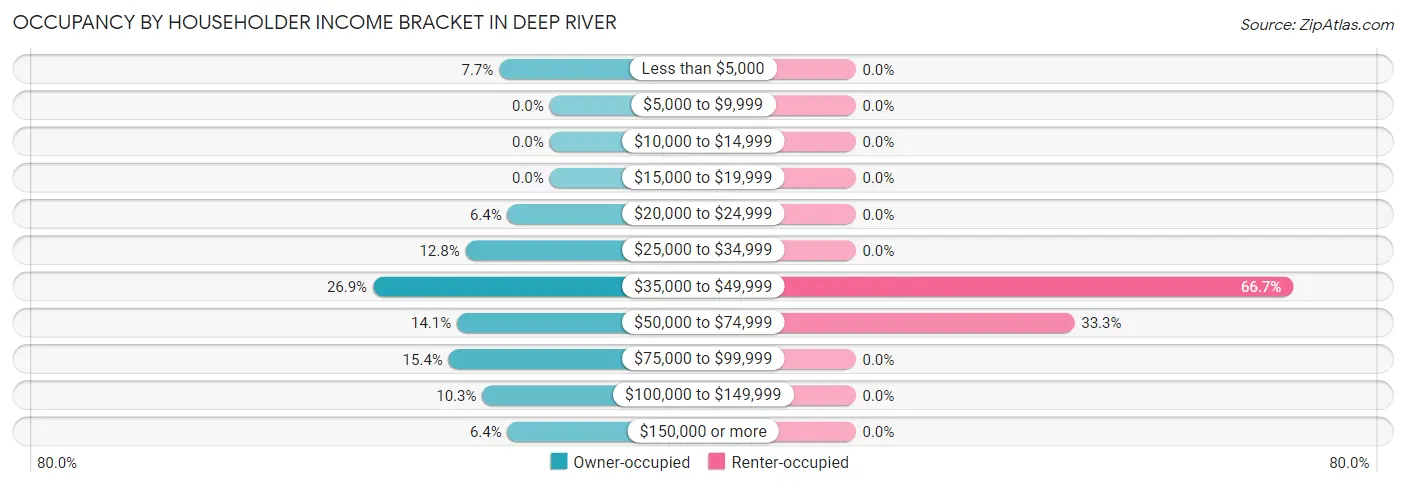
| Income Bracket | Owner-occupied | Renter-occupied |
| Less than $5,000 | 6 (7.7%) | 0 (0.0%) |
| $5,000 to $9,999 | 0 (0.0%) | 0 (0.0%) |
| $10,000 to $14,999 | 0 (0.0%) | 0 (0.0%) |
| $15,000 to $19,999 | 0 (0.0%) | 0 (0.0%) |
| $20,000 to $24,999 | 5 (6.4%) | 0 (0.0%) |
| $25,000 to $34,999 | 10 (12.8%) | 0 (0.0%) |
| $35,000 to $49,999 | 21 (26.9%) | 12 (66.7%) |
| $50,000 to $74,999 | 11 (14.1%) | 6 (33.3%) |
| $75,000 to $99,999 | 12 (15.4%) | 0 (0.0%) |
| $100,000 to $149,999 | 8 (10.3%) | 0 (0.0%) |
| $150,000 or more | 5 (6.4%) | 0 (0.0%) |
| Total | 78 (100.0%) | 18 (100.0%) |
Monthly Housing Cost Tiers in Deep River
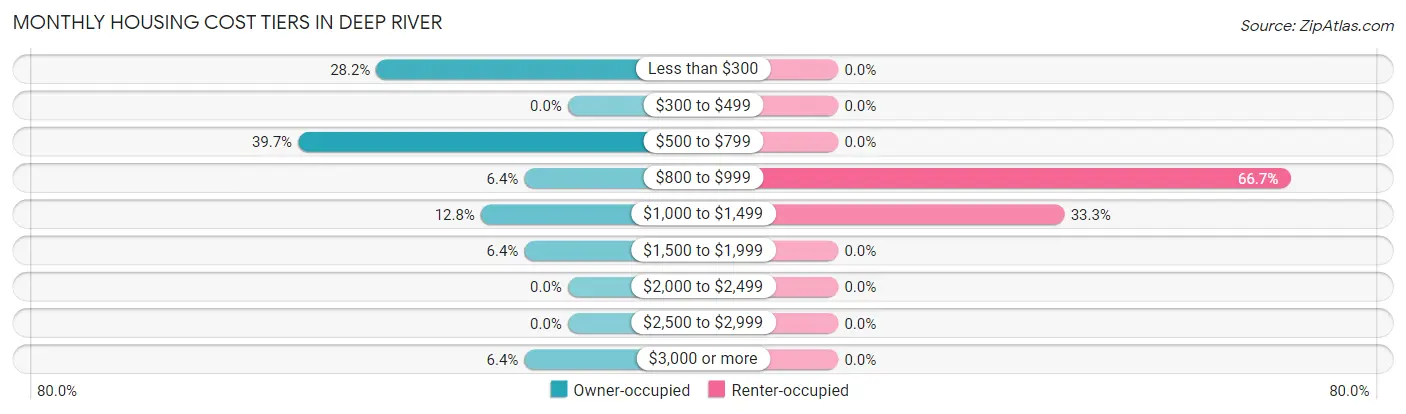
| Monthly Cost | Owner-occupied | Renter-occupied |
| Less than $300 | 22 (28.2%) | 0 (0.0%) |
| $300 to $499 | 0 (0.0%) | 0 (0.0%) |
| $500 to $799 | 31 (39.7%) | 0 (0.0%) |
| $800 to $999 | 5 (6.4%) | 12 (66.7%) |
| $1,000 to $1,499 | 10 (12.8%) | 6 (33.3%) |
| $1,500 to $1,999 | 5 (6.4%) | 0 (0.0%) |
| $2,000 to $2,499 | 0 (0.0%) | 0 (0.0%) |
| $2,500 to $2,999 | 0 (0.0%) | 0 (0.0%) |
| $3,000 or more | 5 (6.4%) | 0 (0.0%) |
| Total | 78 (100.0%) | 18 (100.0%) |
Physical Housing Characteristics in Deep River
Housing Structures in Deep River
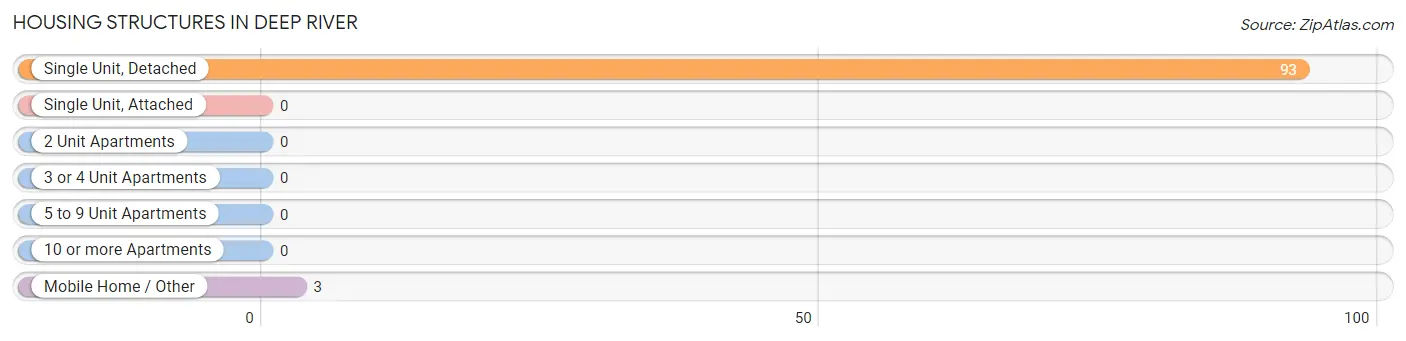
| Structure Type | # Housing Units | % Housing Units |
| Single Unit, Detached | 93 | 96.9% |
| Single Unit, Attached | 0 | 0.0% |
| 2 Unit Apartments | 0 | 0.0% |
| 3 or 4 Unit Apartments | 0 | 0.0% |
| 5 to 9 Unit Apartments | 0 | 0.0% |
| 10 or more Apartments | 0 | 0.0% |
| Mobile Home / Other | 3 | 3.1% |
| Total | 96 | 100.0% |
Housing Structures by Occupancy in Deep River
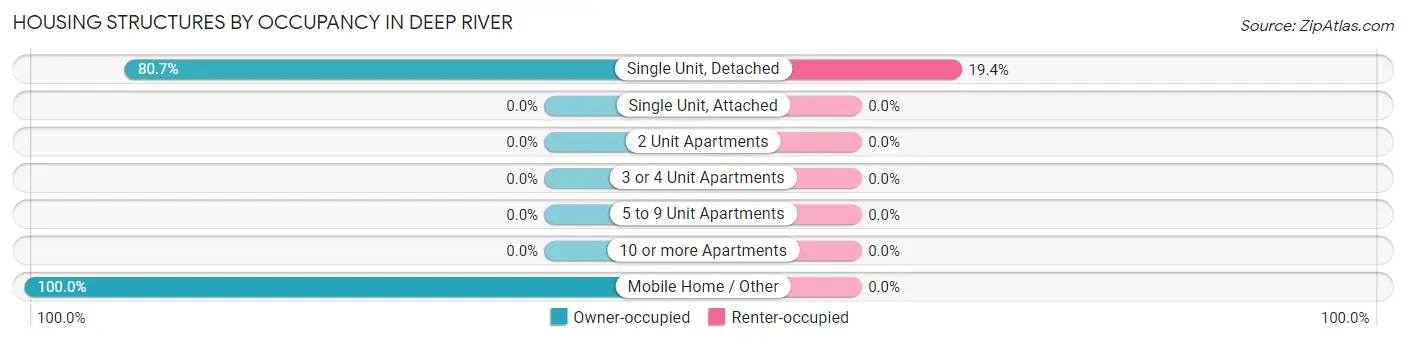
| Structure Type | Owner-occupied | Renter-occupied |
| Single Unit, Detached | 75 (80.6%) | 18 (19.4%) |
| Single Unit, Attached | 0 (0.0%) | 0 (0.0%) |
| 2 Unit Apartments | 0 (0.0%) | 0 (0.0%) |
| 3 or 4 Unit Apartments | 0 (0.0%) | 0 (0.0%) |
| 5 to 9 Unit Apartments | 0 (0.0%) | 0 (0.0%) |
| 10 or more Apartments | 0 (0.0%) | 0 (0.0%) |
| Mobile Home / Other | 3 (100.0%) | 0 (0.0%) |
| Total | 78 (81.2%) | 18 (18.8%) |
Housing Structures by Number of Rooms in Deep River
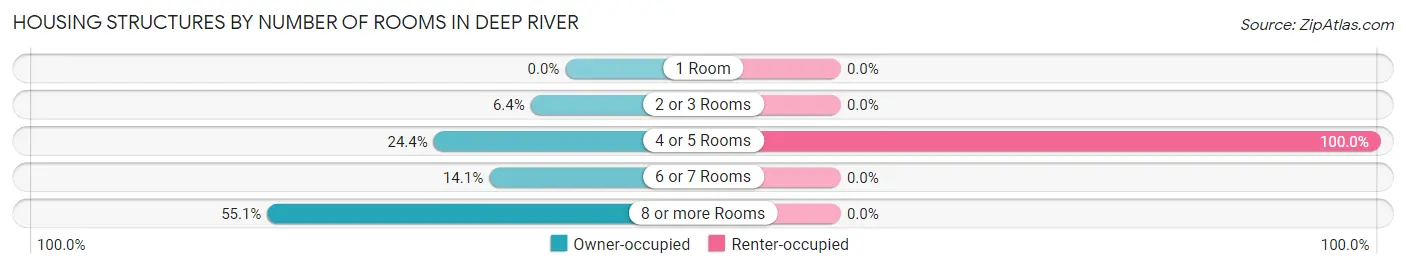
| Number of Rooms | Owner-occupied | Renter-occupied |
| 1 Room | 0 (0.0%) | 0 (0.0%) |
| 2 or 3 Rooms | 5 (6.4%) | 0 (0.0%) |
| 4 or 5 Rooms | 19 (24.4%) | 18 (100.0%) |
| 6 or 7 Rooms | 11 (14.1%) | 0 (0.0%) |
| 8 or more Rooms | 43 (55.1%) | 0 (0.0%) |
| Total | 78 (100.0%) | 18 (100.0%) |
Housing Structure by Heating Type in Deep River
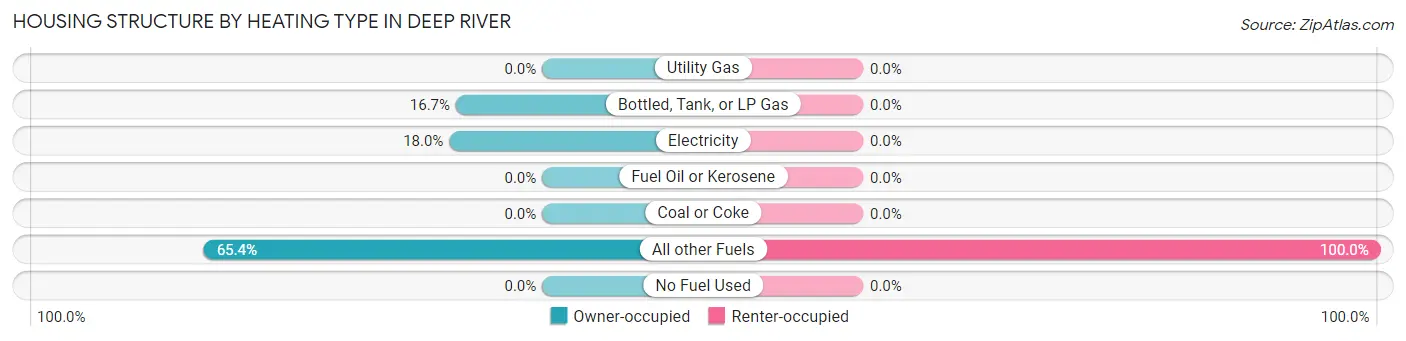
| Heating Type | Owner-occupied | Renter-occupied |
| Utility Gas | 0 (0.0%) | 0 (0.0%) |
| Bottled, Tank, or LP Gas | 13 (16.7%) | 0 (0.0%) |
| Electricity | 14 (17.9%) | 0 (0.0%) |
| Fuel Oil or Kerosene | 0 (0.0%) | 0 (0.0%) |
| Coal or Coke | 0 (0.0%) | 0 (0.0%) |
| All other Fuels | 51 (65.4%) | 18 (100.0%) |
| No Fuel Used | 0 (0.0%) | 0 (0.0%) |
| Total | 78 (100.0%) | 18 (100.0%) |
Household Vehicle Usage in Deep River
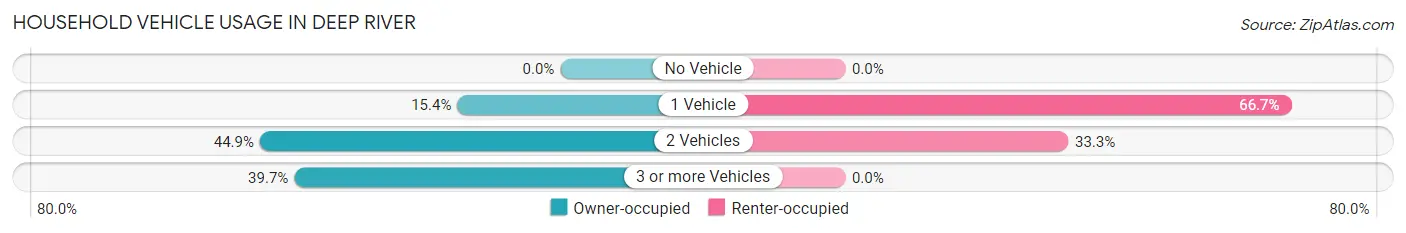
| Vehicles per Household | Owner-occupied | Renter-occupied |
| No Vehicle | 0 (0.0%) | 0 (0.0%) |
| 1 Vehicle | 12 (15.4%) | 12 (66.7%) |
| 2 Vehicles | 35 (44.9%) | 6 (33.3%) |
| 3 or more Vehicles | 31 (39.7%) | 0 (0.0%) |
| Total | 78 (100.0%) | 18 (100.0%) |
Real Estate & Mortgages in Deep River
Real Estate and Mortgage Overview in Deep River
| Characteristic | Without Mortgage | With Mortgage |
| Housing Units | 58 | 20 |
| Median Property Value | $375,000 | $0 |
| Median Household Income | $48,125 | $5 |
| Monthly Housing Costs | $564 | $5 |
| Real Estate Taxes | $1,403 | $0 |
Property Value by Mortgage Status in Deep River
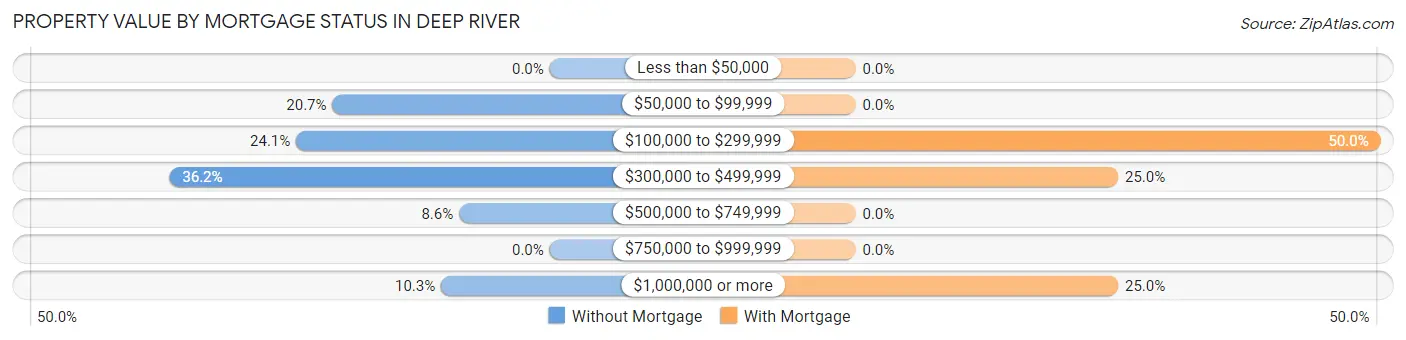
| Property Value | Without Mortgage | With Mortgage |
| Less than $50,000 | 0 (0.0%) | 0 (0.0%) |
| $50,000 to $99,999 | 12 (20.7%) | 0 (0.0%) |
| $100,000 to $299,999 | 14 (24.1%) | 10 (50.0%) |
| $300,000 to $499,999 | 21 (36.2%) | 5 (25.0%) |
| $500,000 to $749,999 | 5 (8.6%) | 0 (0.0%) |
| $750,000 to $999,999 | 0 (0.0%) | 0 (0.0%) |
| $1,000,000 or more | 6 (10.3%) | 5 (25.0%) |
| Total | 58 (100.0%) | 20 (100.0%) |
Household Income by Mortgage Status in Deep River
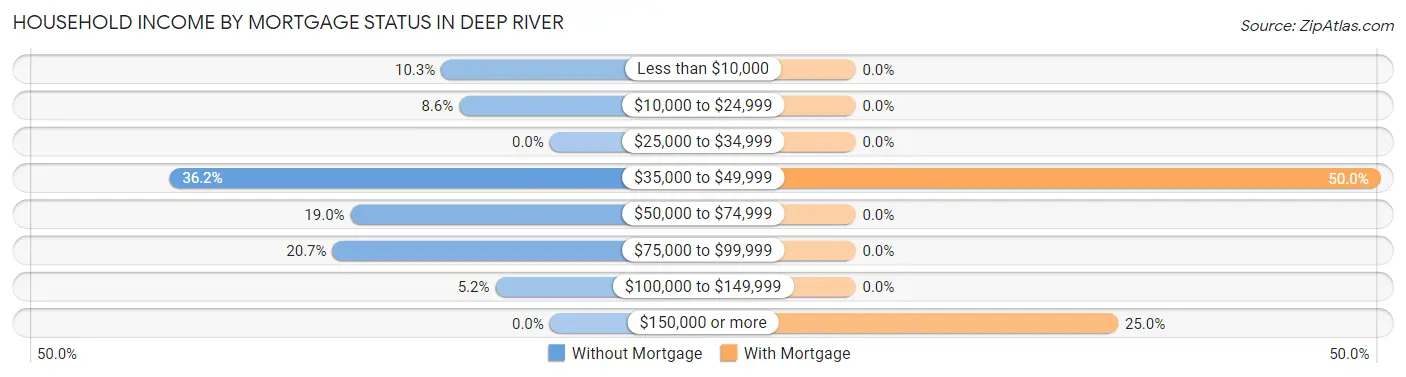
| Household Income | Without Mortgage | With Mortgage |
| Less than $10,000 | 6 (10.3%) | 0 (0.0%) |
| $10,000 to $24,999 | 5 (8.6%) | 0 (0.0%) |
| $25,000 to $34,999 | 0 (0.0%) | 0 (0.0%) |
| $35,000 to $49,999 | 21 (36.2%) | 10 (50.0%) |
| $50,000 to $74,999 | 11 (19.0%) | 0 (0.0%) |
| $75,000 to $99,999 | 12 (20.7%) | 0 (0.0%) |
| $100,000 to $149,999 | 3 (5.2%) | 0 (0.0%) |
| $150,000 or more | 0 (0.0%) | 5 (25.0%) |
| Total | 58 (100.0%) | 20 (100.0%) |
Property Value to Household Income Ratio in Deep River
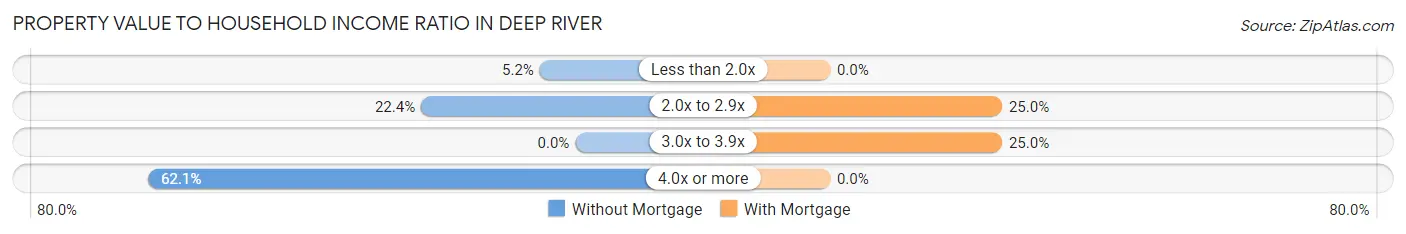
| Value-to-Income Ratio | Without Mortgage | With Mortgage |
| Less than 2.0x | 3 (5.2%) | 0 (0.0%) |
| 2.0x to 2.9x | 13 (22.4%) | 5 (25.0%) |
| 3.0x to 3.9x | 0 (0.0%) | 5 (25.0%) |
| 4.0x or more | 36 (62.1%) | 0 (0.0%) |
| Total | 58 (100.0%) | 20 (100.0%) |
Real Estate Taxes by Mortgage Status in Deep River
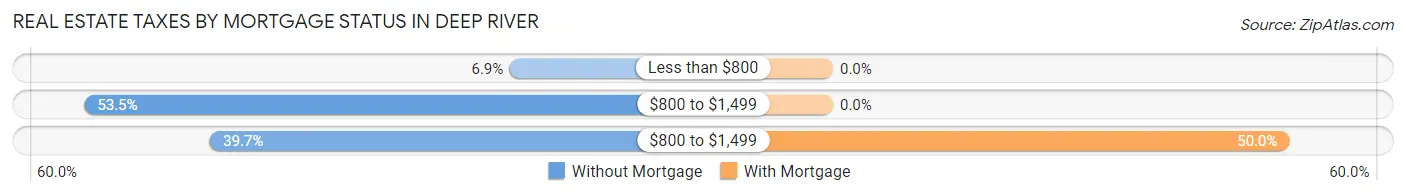
| Property Taxes | Without Mortgage | With Mortgage |
| Less than $800 | 4 (6.9%) | 0 (0.0%) |
| $800 to $1,499 | 31 (53.4%) | 0 (0.0%) |
| $800 to $1,499 | 23 (39.7%) | 10 (50.0%) |
| Total | 58 (100.0%) | 20 (100.0%) |
Health & Disability in Deep River
Health Insurance Coverage by Age in Deep River
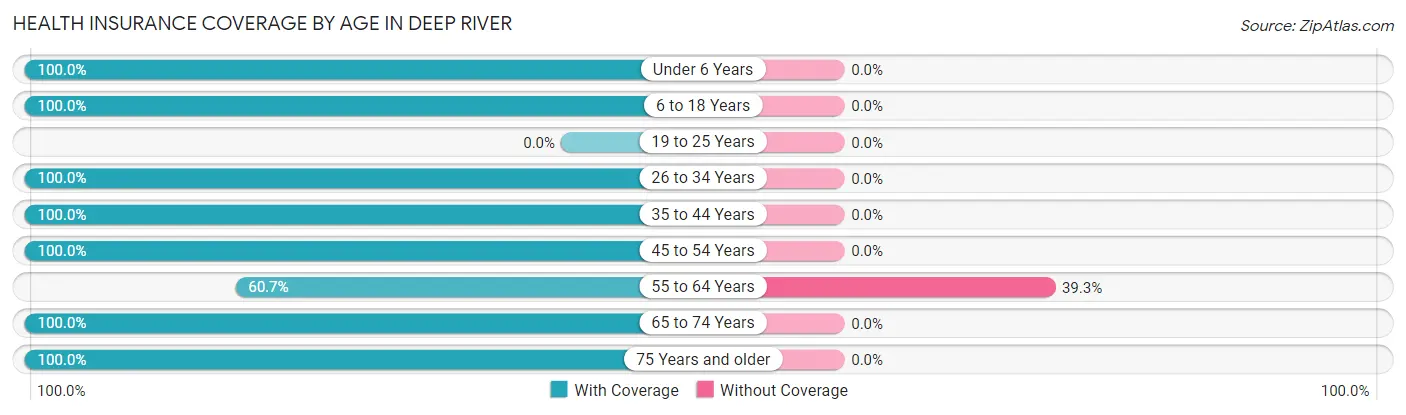
| Age Bracket | With Coverage | Without Coverage |
| Under 6 Years | 10 (100.0%) | 0 (0.0%) |
| 6 to 18 Years | 4 (100.0%) | 0 (0.0%) |
| 19 to 25 Years | 0 (0.0%) | 0 (0.0%) |
| 26 to 34 Years | 20 (100.0%) | 0 (0.0%) |
| 35 to 44 Years | 6 (100.0%) | 0 (0.0%) |
| 45 to 54 Years | 14 (100.0%) | 0 (0.0%) |
| 55 to 64 Years | 17 (60.7%) | 11 (39.3%) |
| 65 to 74 Years | 52 (100.0%) | 0 (0.0%) |
| 75 Years and older | 25 (100.0%) | 0 (0.0%) |
| Total | 148 (93.1%) | 11 (6.9%) |
Health Insurance Coverage by Citizenship Status in Deep River
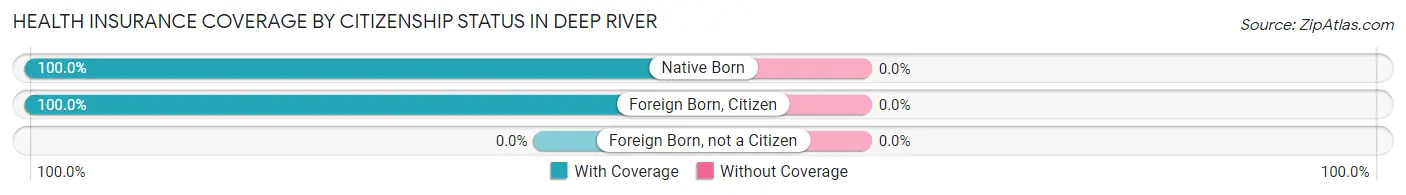
| Citizenship Status | With Coverage | Without Coverage |
| Native Born | 10 (100.0%) | 0 (0.0%) |
| Foreign Born, Citizen | 4 (100.0%) | 0 (0.0%) |
| Foreign Born, not a Citizen | 0 (0.0%) | 0 (0.0%) |
Health Insurance Coverage by Household Income in Deep River
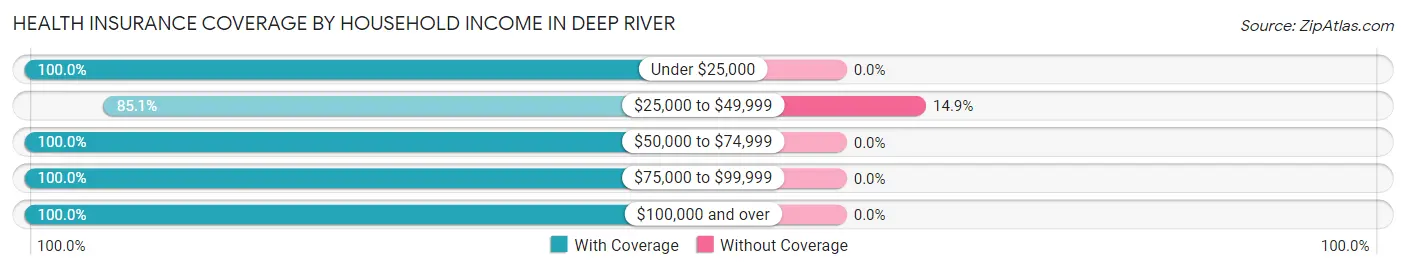
| Household Income | With Coverage | Without Coverage |
| Under $25,000 | 15 (100.0%) | 0 (0.0%) |
| $25,000 to $49,999 | 63 (85.1%) | 11 (14.9%) |
| $50,000 to $74,999 | 25 (100.0%) | 0 (0.0%) |
| $75,000 to $99,999 | 18 (100.0%) | 0 (0.0%) |
| $100,000 and over | 27 (100.0%) | 0 (0.0%) |
Public vs Private Health Insurance Coverage by Age in Deep River
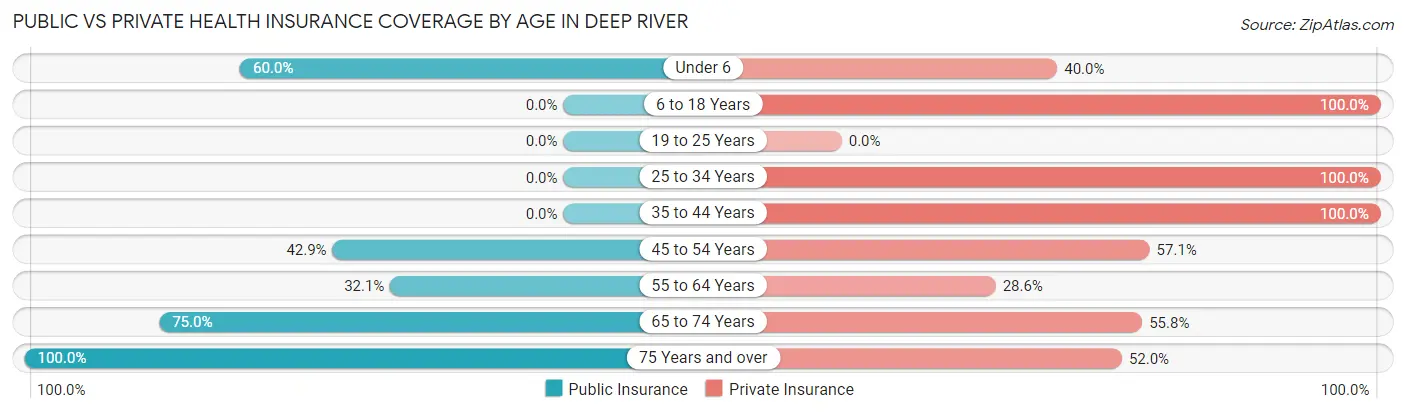
| Age Bracket | Public Insurance | Private Insurance |
| Under 6 | 6 (60.0%) | 4 (40.0%) |
| 6 to 18 Years | 0 (0.0%) | 4 (100.0%) |
| 19 to 25 Years | 0 (0.0%) | 0 (0.0%) |
| 25 to 34 Years | 0 (0.0%) | 20 (100.0%) |
| 35 to 44 Years | 0 (0.0%) | 6 (100.0%) |
| 45 to 54 Years | 6 (42.9%) | 8 (57.1%) |
| 55 to 64 Years | 9 (32.1%) | 8 (28.6%) |
| 65 to 74 Years | 39 (75.0%) | 29 (55.8%) |
| 75 Years and over | 25 (100.0%) | 13 (52.0%) |
| Total | 85 (53.5%) | 92 (57.9%) |
Disability Status by Sex by Age in Deep River
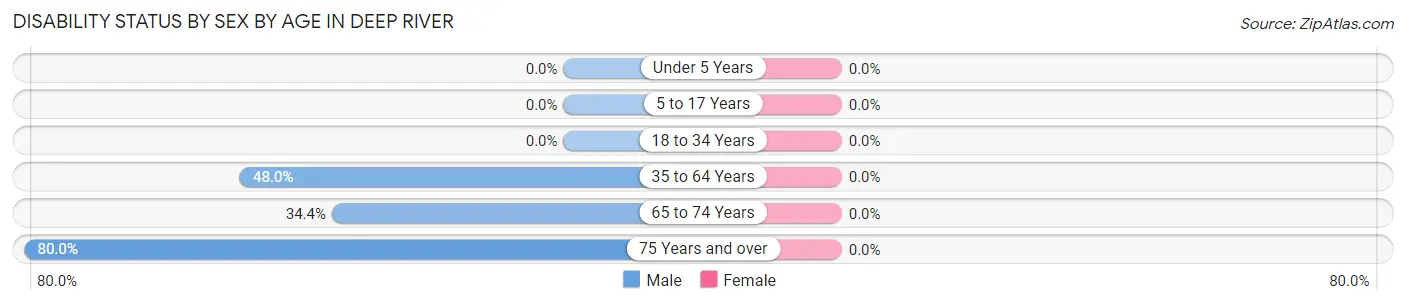
| Age Bracket | Male | Female |
| Under 5 Years | 0 (0.0%) | 0 (0.0%) |
| 5 to 17 Years | 0 (0.0%) | 0 (0.0%) |
| 18 to 34 Years | 0 (0.0%) | 0 (0.0%) |
| 35 to 64 Years | 12 (48.0%) | 0 (0.0%) |
| 65 to 74 Years | 11 (34.4%) | 0 (0.0%) |
| 75 Years and over | 16 (80.0%) | 0 (0.0%) |
Disability Class by Sex by Age in Deep River
Disability Class: Hearing Difficulty
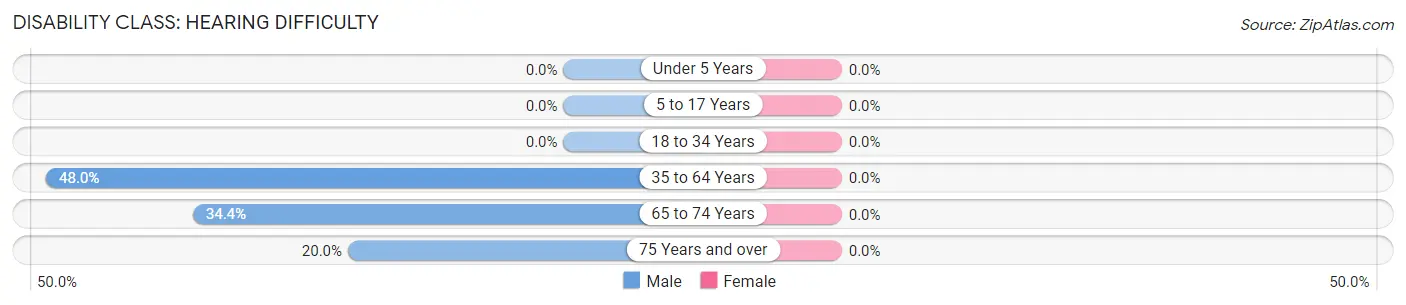
| Age Bracket | Male | Female |
| Under 5 Years | 0 (0.0%) | 0 (0.0%) |
| 5 to 17 Years | 0 (0.0%) | 0 (0.0%) |
| 18 to 34 Years | 0 (0.0%) | 0 (0.0%) |
| 35 to 64 Years | 12 (48.0%) | 0 (0.0%) |
| 65 to 74 Years | 11 (34.4%) | 0 (0.0%) |
| 75 Years and over | 4 (20.0%) | 0 (0.0%) |
Disability Class: Vision Difficulty
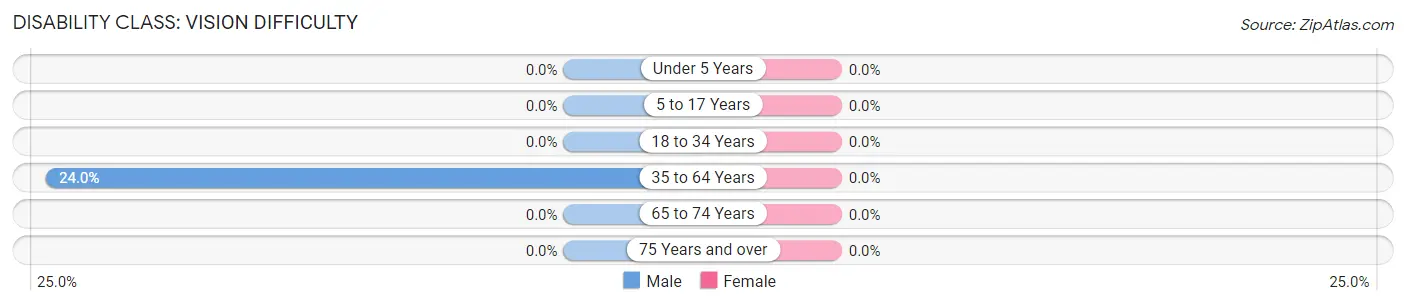
| Age Bracket | Male | Female |
| Under 5 Years | 0 (0.0%) | 0 (0.0%) |
| 5 to 17 Years | 0 (0.0%) | 0 (0.0%) |
| 18 to 34 Years | 0 (0.0%) | 0 (0.0%) |
| 35 to 64 Years | 6 (24.0%) | 0 (0.0%) |
| 65 to 74 Years | 0 (0.0%) | 0 (0.0%) |
| 75 Years and over | 0 (0.0%) | 0 (0.0%) |
Disability Class: Cognitive Difficulty
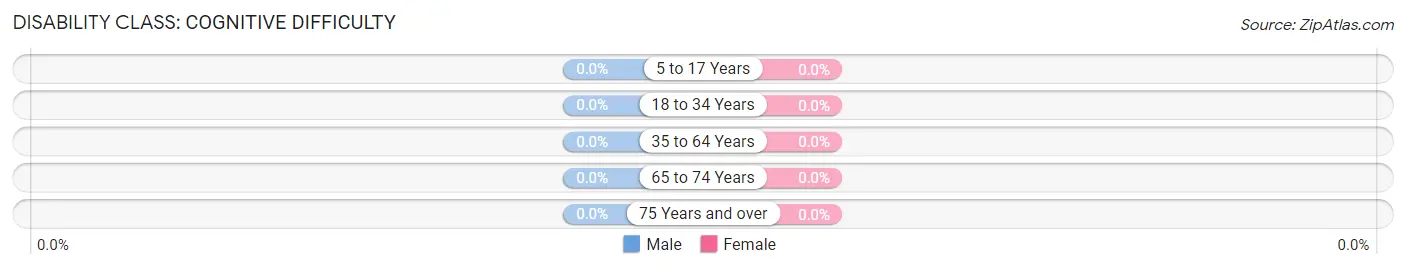
| Age Bracket | Male | Female |
| 5 to 17 Years | 0 (0.0%) | 0 (0.0%) |
| 18 to 34 Years | 0 (0.0%) | 0 (0.0%) |
| 35 to 64 Years | 0 (0.0%) | 0 (0.0%) |
| 65 to 74 Years | 0 (0.0%) | 0 (0.0%) |
| 75 Years and over | 0 (0.0%) | 0 (0.0%) |
Disability Class: Ambulatory Difficulty
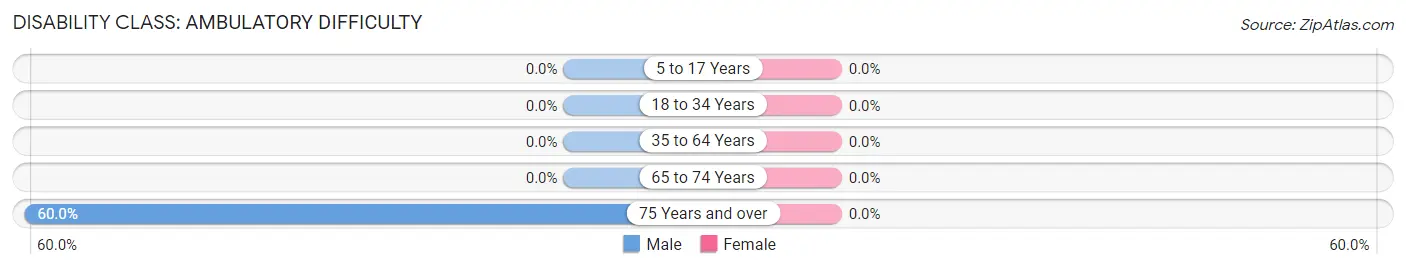
| Age Bracket | Male | Female |
| 5 to 17 Years | 0 (0.0%) | 0 (0.0%) |
| 18 to 34 Years | 0 (0.0%) | 0 (0.0%) |
| 35 to 64 Years | 0 (0.0%) | 0 (0.0%) |
| 65 to 74 Years | 0 (0.0%) | 0 (0.0%) |
| 75 Years and over | 12 (60.0%) | 0 (0.0%) |
Disability Class: Self-Care Difficulty
| Age Bracket | Male | Female |
| 5 to 17 Years | 0 (0.0%) | 0 (0.0%) |
| 18 to 34 Years | 0 (0.0%) | 0 (0.0%) |
| 35 to 64 Years | 0 (0.0%) | 0 (0.0%) |
| 65 to 74 Years | 0 (0.0%) | 0 (0.0%) |
| 75 Years and over | 0 (0.0%) | 0 (0.0%) |
Technology Access in Deep River
Computing Device Access in Deep River
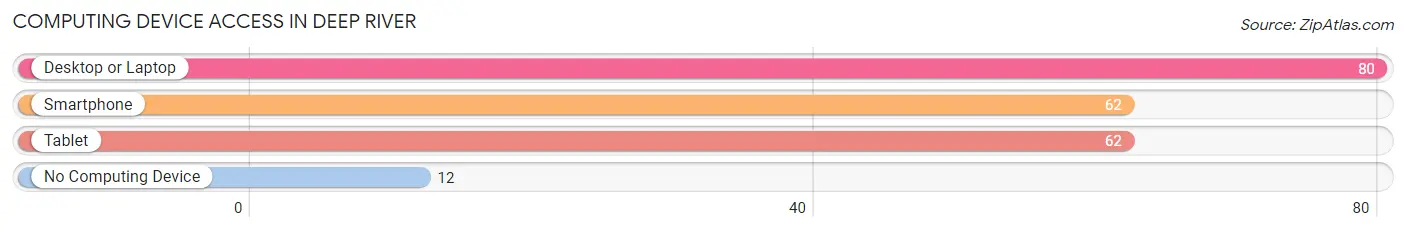
| Device Type | # Households | % Households |
| Desktop or Laptop | 80 | 83.3% |
| Smartphone | 62 | 64.6% |
| Tablet | 62 | 64.6% |
| No Computing Device | 12 | 12.5% |
| Total | 96 | 100.0% |
Internet Access in Deep River
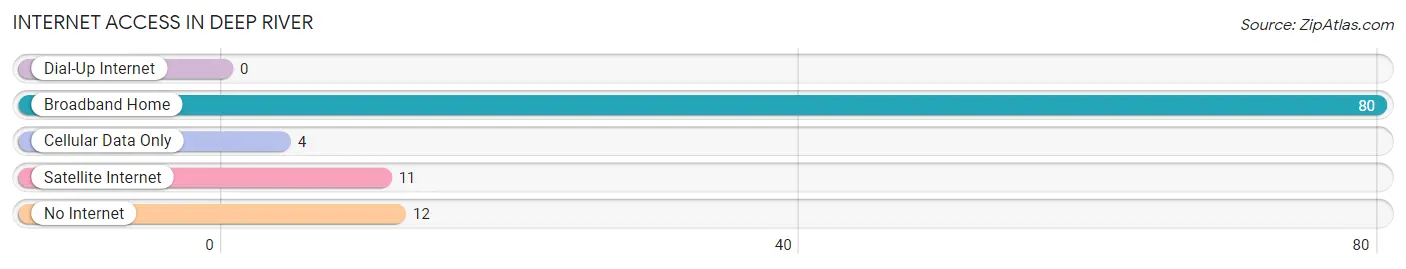
| Internet Type | # Households | % Households |
| Dial-Up Internet | 0 | 0.0% |
| Broadband Home | 80 | 83.3% |
| Cellular Data Only | 4 | 4.2% |
| Satellite Internet | 11 | 11.5% |
| No Internet | 12 | 12.5% |
| Total | 96 | 100.0% |
Deep River Summary
Deep River is a small unincorporated community located in the foothills of the Cascade Mountains in Washington State. It is situated in the upper reaches of the Skagit River Valley, approximately 25 miles east of the city of Mount Vernon. The population of Deep River was estimated to be around 200 people in 2020.
History
The area around Deep River has been inhabited by Native Americans for thousands of years. The earliest known inhabitants were the Upper Skagit people, who lived in the area for centuries before the arrival of European settlers. The first European settlers arrived in the area in the late 1800s, and the town of Deep River was officially established in 1891.
The town was named after the nearby Deep River, which was a popular fishing spot for the local Native Americans. The river was also used by the settlers for transportation and irrigation.
The town of Deep River grew slowly over the years, and by the early 1900s it had become a popular destination for tourists and outdoor enthusiasts. The town was home to several resorts, including the Deep River Inn, which was built in 1910.
Geography
Deep River is located in the foothills of the Cascade Mountains in Washington State. It is situated in the upper reaches of the Skagit River Valley, approximately 25 miles east of the city of Mount Vernon. The town is surrounded by lush forests and rolling hills, and is home to several small lakes and streams.
The climate in Deep River is mild and temperate, with warm summers and cool winters. The average annual temperature is around 50 degrees Fahrenheit, and the average annual precipitation is around 40 inches.
Economy
The economy of Deep River is largely based on tourism and outdoor recreation. The town is home to several resorts and lodges, as well as a variety of outdoor activities such as fishing, hunting, camping, and hiking. The town is also home to several small businesses, including a general store, a gas station, and a post office.
Demographics
The population of Deep River was estimated to be around 200 people in 2020. The town is predominantly white, with a small minority population. The median household income in Deep River is around $50,000, and the median home value is around $200,000. The town has a low unemployment rate, and the majority of the population is employed in the tourism and outdoor recreation industries.
Common Questions
What is Per Capita Income in Deep River?
Per Capita income in Deep River is $48,172.
What is the Median Family Income in Deep River?
Median Family Income in Deep River is $50,417.
What is the Median Household income in Deep River?
Median Household Income in Deep River is $47,000.
What is Inequality or Gini Index in Deep River?
Inequality or Gini Index in Deep River is 0.51.
What is the Total Population of Deep River?
Total Population of Deep River is 159.
What is the Total Male Population of Deep River?
Total Male Population of Deep River is 101.
What is the Total Female Population of Deep River?
Total Female Population of Deep River is 58.
What is the Ratio of Males per 100 Females in Deep River?
There are 174.14 Males per 100 Females in Deep River.
What is the Ratio of Females per 100 Males in Deep River?
There are 57.43 Females per 100 Males in Deep River.
What is the Median Population Age in Deep River?
Median Population Age in Deep River is 64.4 Years.
What is the Average Family Size in Deep River
Average Family Size in Deep River is 2.0 People.
What is the Average Household Size in Deep River
Average Household Size in Deep River is 1.7 People.
How Large is the Labor Force in Deep River?
There are 38 People in the Labor Forcein in Deep River.
What is the Percentage of People in the Labor Force in Deep River?
26.2% of People are in the Labor Force in Deep River.