Cities with the Highest Percentage of Immigrants from Eastern Asia in Ohio
RELATED REPORTS & OPTIONS
Eastern Asia
Ohio
Compare Cities
Map of Cities with the Highest Percentage of Immigrants from Eastern Asia in Ohio
0.00%
20.00%
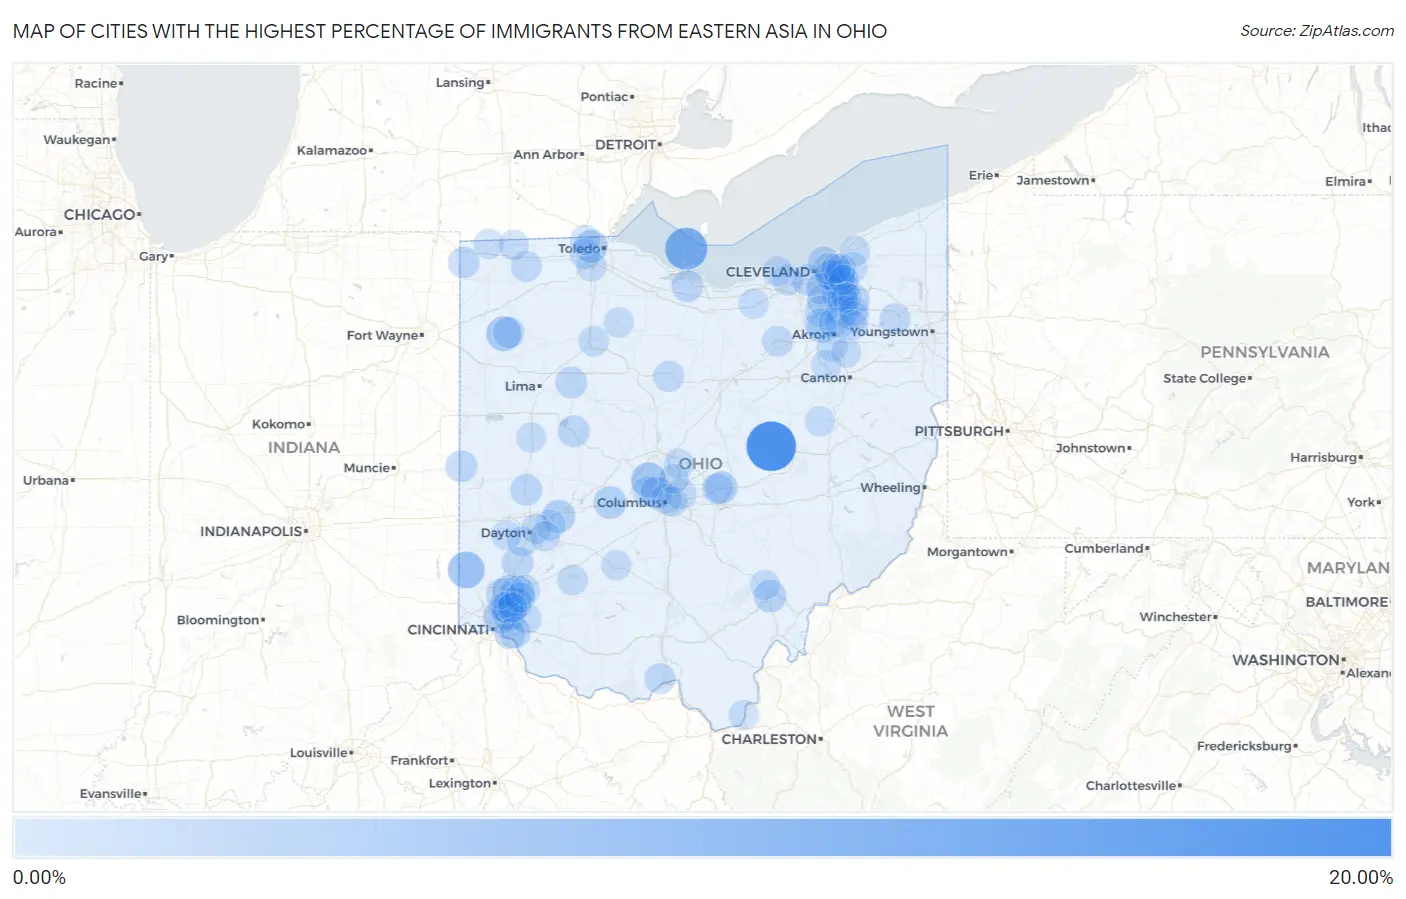
Cities with the Highest Percentage of Immigrants from Eastern Asia in Ohio
| City | Eastern Asia | vs State | vs National | |
| 1. | Nellie | 18.18% | 0.52%(+17.7)#1 | 1.28%(+16.9)#56 |
| 2. | Put In Bay | 11.24% | 0.52%(+10.7)#2 | 1.28%(+9.96)#135 |
| 3. | Oxford | 6.50% | 0.52%(+5.98)#3 | 1.28%(+5.22)#332 |
| 4. | Dublin | 5.23% | 0.52%(+4.71)#4 | 1.28%(+3.95)#464 |
| 5. | Glenwillow | 5.06% | 0.52%(+4.55)#5 | 1.28%(+3.79)#483 |
| 6. | Melrose | 4.90% | 0.52%(+4.38)#6 | 1.28%(+3.62)#506 |
| 7. | Sharon Center | 4.26% | 0.52%(+3.74)#7 | 1.28%(+2.98)#620 |
| 8. | Solon | 3.86% | 0.52%(+3.34)#8 | 1.28%(+2.59)#691 |
| 9. | Golf Manor | 3.75% | 0.52%(+3.23)#9 | 1.28%(+2.47)#725 |
| 10. | Mason | 3.68% | 0.52%(+3.16)#10 | 1.28%(+2.40)#752 |
| 11. | Kenwood | 3.64% | 0.52%(+3.12)#11 | 1.28%(+2.37)#758 |
| 12. | Sixteen Mile Stand | 3.48% | 0.52%(+2.96)#12 | 1.28%(+2.21)#802 |
| 13. | Enon | 3.19% | 0.52%(+2.67)#13 | 1.28%(+1.91)#901 |
| 14. | Ottawa Hills | 3.12% | 0.52%(+2.60)#14 | 1.28%(+1.84)#919 |
| 15. | Choctaw Lake | 2.98% | 0.52%(+2.46)#15 | 1.28%(+1.71)#963 |
| 16. | Wetherington | 2.91% | 0.52%(+2.39)#16 | 1.28%(+1.63)#995 |
| 17. | Granville | 2.89% | 0.52%(+2.37)#17 | 1.28%(+1.61)#1,006 |
| 18. | Athens | 2.71% | 0.52%(+2.19)#18 | 1.28%(+1.43)#1,085 |
| 19. | Upper Arlington | 2.68% | 0.52%(+2.16)#19 | 1.28%(+1.40)#1,095 |
| 20. | Beachwood | 2.56% | 0.52%(+2.04)#20 | 1.28%(+1.28)#1,154 |
| 21. | Orange | 2.42% | 0.52%(+1.90)#21 | 1.28%(+1.14)#1,213 |
| 22. | Bratenahl | 2.32% | 0.52%(+1.80)#22 | 1.28%(+1.05)#1,273 |
| 23. | Ada | 2.24% | 0.52%(+1.72)#23 | 1.28%(+0.965)#1,323 |
| 24. | Blue Ash | 2.22% | 0.52%(+1.70)#24 | 1.28%(+0.946)#1,336 |
| 25. | Troy | 2.20% | 0.52%(+1.68)#25 | 1.28%(+0.929)#1,345 |
| 26. | Castalia | 2.17% | 0.52%(+1.65)#26 | 1.28%(+0.890)#1,370 |
| 27. | Hudson | 2.14% | 0.52%(+1.62)#27 | 1.28%(+0.867)#1,388 |
| 28. | Huntsville | 2.10% | 0.52%(+1.58)#28 | 1.28%(+0.825)#1,420 |
| 29. | Union City | 2.09% | 0.52%(+1.57)#29 | 1.28%(+0.819)#1,427 |
| 30. | Aurora | 2.04% | 0.52%(+1.52)#30 | 1.28%(+0.762)#1,460 |
| 31. | Cleveland Heights | 2.03% | 0.52%(+1.51)#31 | 1.28%(+0.753)#1,466 |
| 32. | Brooklyn | 1.91% | 0.52%(+1.39)#32 | 1.28%(+0.634)#1,573 |
| 33. | Oakwood | 1.87% | 0.52%(+1.35)#33 | 1.28%(+0.599)#1,595 |
| 34. | Franklin | 1.82% | 0.52%(+1.31)#34 | 1.28%(+0.549)#1,647 |
| 35. | Edon | 1.77% | 0.52%(+1.25)#35 | 1.28%(+0.498)#1,692 |
| 36. | Jersey | 1.77% | 0.52%(+1.25)#36 | 1.28%(+0.494)#1,697 |
| 37. | Cherry Grove | 1.73% | 0.52%(+1.21)#37 | 1.28%(+0.451)#1,735 |
| 38. | Westlake | 1.67% | 0.52%(+1.15)#38 | 1.28%(+0.391)#1,815 |
| 39. | Bucyrus | 1.67% | 0.52%(+1.15)#39 | 1.28%(+0.391)#1,816 |
| 40. | Pepper Pike | 1.64% | 0.52%(+1.12)#40 | 1.28%(+0.362)#1,863 |
| 41. | Newton Falls | 1.62% | 0.52%(+1.10)#41 | 1.28%(+0.346)#1,883 |
| 42. | West Portsmouth | 1.57% | 0.52%(+1.06)#42 | 1.28%(+0.299)#1,927 |
| 43. | Pettisville | 1.52% | 0.52%(+0.996)#43 | 1.28%(+0.239)#1,989 |
| 44. | Brecksville | 1.51% | 0.52%(+0.993)#44 | 1.28%(+0.237)#1,994 |
| 45. | Fairlawn | 1.47% | 0.52%(+0.948)#45 | 1.28%(+0.192)#2,050 |
| 46. | Granville South | 1.46% | 0.52%(+0.936)#46 | 1.28%(+0.180)#2,071 |
| 47. | Independence | 1.42% | 0.52%(+0.900)#47 | 1.28%(+0.144)#2,127 |
| 48. | Lodi | 1.41% | 0.52%(+0.891)#48 | 1.28%(+0.135)#2,142 |
| 49. | Richfield | 1.34% | 0.52%(+0.825)#49 | 1.28%(+0.069)#2,255 |
| 50. | Fairborn | 1.30% | 0.52%(+0.779)#50 | 1.28%(+0.023)#2,341 |
| 51. | Gahanna | 1.29% | 0.52%(+0.775)#51 | 1.28%(+0.019)#2,349 |
| 52. | Holland | 1.28% | 0.52%(+0.762)#52 | 1.28%(+0.006)#2,374 |
| 53. | Montrose Ghent | 1.28% | 0.52%(+0.762)#53 | 1.28%(+0.006)#2,375 |
| 54. | Evendale | 1.28% | 0.52%(+0.757)#54 | 1.28%(+0.001)#2,385 |
| 55. | Beckett Ridge | 1.24% | 0.52%(+0.725)#55 | 1.28%(-0.031)#2,434 |
| 56. | Ridgewood | 1.24% | 0.52%(+0.724)#56 | 1.28%(-0.032)#2,437 |
| 57. | Findlay | 1.24% | 0.52%(+0.720)#57 | 1.28%(-0.036)#2,444 |
| 58. | Wilmington | 1.20% | 0.52%(+0.680)#58 | 1.28%(-0.076)#2,518 |
| 59. | Shaker Heights | 1.19% | 0.52%(+0.670)#59 | 1.28%(-0.086)#2,532 |
| 60. | Hilliard | 1.17% | 0.52%(+0.652)#60 | 1.28%(-0.104)#2,568 |
| 61. | Columbus | 1.16% | 0.52%(+0.639)#61 | 1.28%(-0.117)#2,597 |
| 62. | Silver Lake | 1.14% | 0.52%(+0.625)#62 | 1.28%(-0.131)#2,633 |
| 63. | Day Heights | 1.10% | 0.52%(+0.576)#63 | 1.28%(-0.180)#2,708 |
| 64. | Portage Lakes | 1.09% | 0.52%(+0.570)#64 | 1.28%(-0.187)#2,727 |
| 65. | Fruit Hill | 1.08% | 0.52%(+0.563)#65 | 1.28%(-0.193)#2,744 |
| 66. | Galena | 1.08% | 0.52%(+0.559)#66 | 1.28%(-0.197)#2,756 |
| 67. | Chesterland | 1.07% | 0.52%(+0.546)#67 | 1.28%(-0.210)#2,787 |
| 68. | Moraine | 1.06% | 0.52%(+0.545)#68 | 1.28%(-0.212)#2,792 |
| 69. | Landen | 1.04% | 0.52%(+0.523)#69 | 1.28%(-0.233)#2,838 |
| 70. | Canal Fulton | 1.03% | 0.52%(+0.515)#70 | 1.28%(-0.241)#2,853 |
| 71. | Kirtland Hills | 1.03% | 0.52%(+0.513)#71 | 1.28%(-0.243)#2,864 |
| 72. | Perrysburg | 1.02% | 0.52%(+0.498)#72 | 1.28%(-0.258)#2,905 |
| 73. | Oberlin | 1.00% | 0.52%(+0.481)#73 | 1.28%(-0.275)#2,965 |
| 74. | Mayfield Heights | 1.00% | 0.52%(+0.479)#74 | 1.28%(-0.277)#2,975 |
| 75. | Riverside | 1.00% | 0.52%(+0.477)#75 | 1.28%(-0.279)#2,978 |
| 76. | Anna | 0.98% | 0.52%(+0.465)#76 | 1.28%(-0.291)#3,007 |
| 77. | Sugarcreek | 0.96% | 0.52%(+0.439)#77 | 1.28%(-0.317)#3,081 |
| 78. | New Lebanon | 0.94% | 0.52%(+0.424)#78 | 1.28%(-0.332)#3,133 |
| 79. | Pioneer | 0.90% | 0.52%(+0.381)#79 | 1.28%(-0.375)#3,259 |
| 80. | Twinsburg | 0.89% | 0.52%(+0.372)#80 | 1.28%(-0.384)#3,276 |
| 81. | Cuyahoga Falls | 0.89% | 0.52%(+0.368)#81 | 1.28%(-0.388)#3,285 |
| 82. | Athalia | 0.88% | 0.52%(+0.360)#82 | 1.28%(-0.396)#3,315 |
| 83. | Bexley | 0.88% | 0.52%(+0.359)#83 | 1.28%(-0.397)#3,319 |
| 84. | Moreland Hills | 0.87% | 0.52%(+0.352)#84 | 1.28%(-0.404)#3,335 |
| 85. | Fostoria | 0.87% | 0.52%(+0.348)#85 | 1.28%(-0.408)#3,347 |
| 86. | Westerville | 0.87% | 0.52%(+0.346)#86 | 1.28%(-0.410)#3,354 |
| 87. | Sugar Bush Knolls | 0.86% | 0.52%(+0.342)#87 | 1.28%(-0.414)#3,374 |
| 88. | Fayette | 0.85% | 0.52%(+0.330)#88 | 1.28%(-0.426)#3,410 |
| 89. | Uniontown | 0.85% | 0.52%(+0.330)#89 | 1.28%(-0.427)#3,413 |
| 90. | Streetsboro | 0.83% | 0.52%(+0.315)#90 | 1.28%(-0.441)#3,461 |
| 91. | Washington Court House | 0.83% | 0.52%(+0.314)#91 | 1.28%(-0.442)#3,463 |
| 92. | South Lebanon | 0.83% | 0.52%(+0.312)#92 | 1.28%(-0.444)#3,473 |
| 93. | Avon Lake | 0.82% | 0.52%(+0.305)#93 | 1.28%(-0.451)#3,486 |
| 94. | Montgomery | 0.81% | 0.52%(+0.294)#94 | 1.28%(-0.462)#3,531 |
| 95. | Reminderville | 0.81% | 0.52%(+0.291)#95 | 1.28%(-0.465)#3,544 |
| 96. | Lyndhurst | 0.81% | 0.52%(+0.290)#96 | 1.28%(-0.466)#3,546 |
| 97. | Sylvania | 0.80% | 0.52%(+0.284)#97 | 1.28%(-0.472)#3,572 |
| 98. | Chauncey | 0.80% | 0.52%(+0.281)#98 | 1.28%(-0.475)#3,583 |
| 99. | Beavercreek | 0.80% | 0.52%(+0.279)#99 | 1.28%(-0.477)#3,591 |
| 100. | Kent | 0.80% | 0.52%(+0.278)#100 | 1.28%(-0.478)#3,596 |
Common Questions
What are the Top 10 Cities with the Highest Percentage of Immigrants from Eastern Asia in Ohio?
Top 10 Cities with the Highest Percentage of Immigrants from Eastern Asia in Ohio are:
#1
18.18%
#2
11.24%
#3
6.50%
#4
5.23%
#5
5.06%
#6
4.90%
#7
3.86%
#8
3.75%
#9
3.68%
#10
3.64%
What city has the Highest Percentage of Immigrants from Eastern Asia in Ohio?
Nellie has the Highest Percentage of Immigrants from Eastern Asia in Ohio with 18.18%.
What is the Percentage of Immigrants from Eastern Asia in the State of Ohio?
Percentage of Immigrants from Eastern Asia in Ohio is 0.52%.
What is the Percentage of Immigrants from Eastern Asia in the United States?
Percentage of Immigrants from Eastern Asia in the United States is 1.28%.