Cities with the Highest Percentage of Immigrants from Eastern Asia in Pennsylvania
RELATED REPORTS & OPTIONS
Eastern Asia
Pennsylvania
Compare Cities
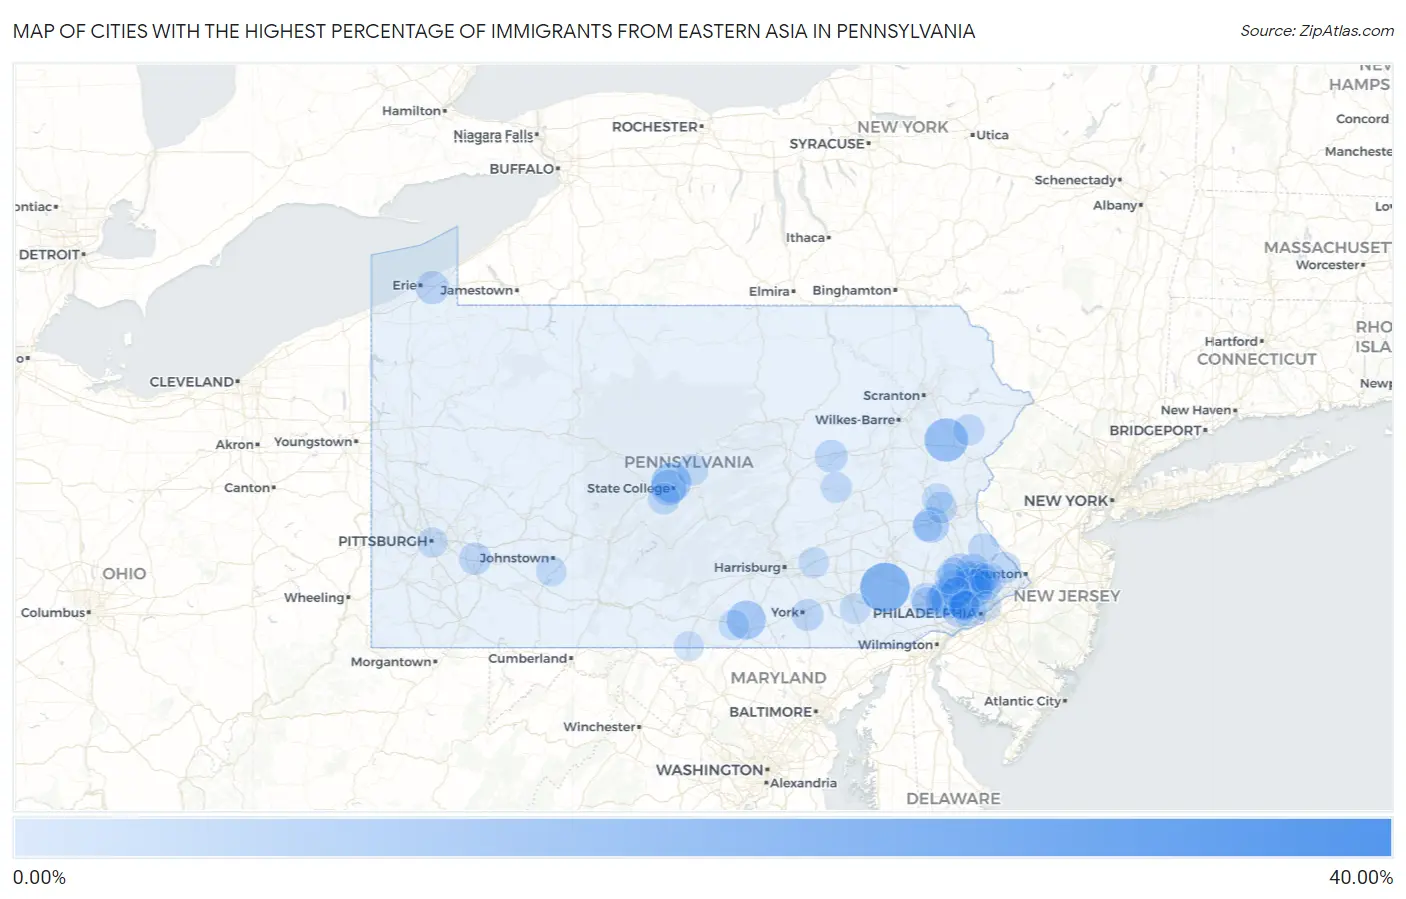
Map of Cities with the Highest Percentage of Immigrants from Eastern Asia in Pennsylvania
0.00%
40.00%
Cities with the Highest Percentage of Immigrants from Eastern Asia in Pennsylvania
| City | Eastern Asia | vs State | vs National | |
| 1. | Morgan Hill | 32.74% | 0.84%(+31.9)#1 | 1.28%(+31.5)#16 |
| 2. | Goodville | 17.79% | 0.84%(+17.0)#2 | 1.28%(+16.5)#58 |
| 3. | Pocono Pines | 12.69% | 0.84%(+11.8)#3 | 1.28%(+11.4)#99 |
| 4. | Aspinwall Borough | 11.87% | 0.84%(+11.0)#4 | 1.28%(+10.6)#113 |
| 5. | Toftrees | 9.63% | 0.84%(+8.78)#5 | 1.28%(+8.35)#173 |
| 6. | Table Rock | 9.00% | 0.84%(+8.16)#6 | 1.28%(+7.72)#198 |
| 7. | Chesterbrook | 7.11% | 0.84%(+6.27)#7 | 1.28%(+5.84)#287 |
| 8. | Spring House | 6.84% | 0.84%(+6.00)#8 | 1.28%(+5.56)#304 |
| 9. | Park Forest Village | 6.54% | 0.84%(+5.70)#9 | 1.28%(+5.26)#326 |
| 10. | Trexlertown | 6.26% | 0.84%(+5.42)#10 | 1.28%(+4.98)#349 |
| 11. | Rosemont | 5.96% | 0.84%(+5.11)#11 | 1.28%(+4.68)#376 |
| 12. | Penn Wynne | 5.65% | 0.84%(+4.80)#12 | 1.28%(+4.37)#417 |
| 13. | Maple Glen | 5.54% | 0.84%(+4.70)#13 | 1.28%(+4.27)#427 |
| 14. | Dudley Borough | 5.35% | 0.84%(+4.51)#14 | 1.28%(+4.07)#448 |
| 15. | State College Borough | 5.29% | 0.84%(+4.45)#15 | 1.28%(+4.02)#452 |
| 16. | St. Davids | 5.22% | 0.84%(+4.38)#16 | 1.28%(+3.94)#466 |
| 17. | Berwyn | 5.22% | 0.84%(+4.37)#17 | 1.28%(+3.94)#467 |
| 18. | Swarthmore Borough | 5.09% | 0.84%(+4.24)#18 | 1.28%(+3.81)#479 |
| 19. | Avondale Borough | 4.94% | 0.84%(+4.10)#19 | 1.28%(+3.67)#498 |
| 20. | Hopewell Borough | 4.93% | 0.84%(+4.09)#20 | 1.28%(+3.65)#499 |
| 21. | Malvern Borough | 4.90% | 0.84%(+4.06)#21 | 1.28%(+3.62)#505 |
| 22. | Dilworthtown | 4.85% | 0.84%(+4.01)#22 | 1.28%(+3.57)#514 |
| 23. | Narberth Borough | 4.71% | 0.84%(+3.87)#23 | 1.28%(+3.44)#534 |
| 24. | Paoli | 4.69% | 0.84%(+3.85)#24 | 1.28%(+3.41)#538 |
| 25. | Kulpsville | 4.48% | 0.84%(+3.64)#25 | 1.28%(+3.21)#578 |
| 26. | Penn State Erie Behrend | 4.41% | 0.84%(+3.56)#26 | 1.28%(+3.13)#587 |
| 27. | Penn Farms | 4.32% | 0.84%(+3.48)#27 | 1.28%(+3.05)#604 |
| 28. | Paxtang Borough | 4.22% | 0.84%(+3.38)#28 | 1.28%(+2.95)#626 |
| 29. | Fernville | 4.02% | 0.84%(+3.18)#29 | 1.28%(+2.74)#661 |
| 30. | Montgomeryville | 3.95% | 0.84%(+3.11)#30 | 1.28%(+2.68)#673 |
| 31. | Rutledge Borough | 3.91% | 0.84%(+3.07)#31 | 1.28%(+2.63)#681 |
| 32. | Eagleville Cdp Montgomery County | 3.86% | 0.84%(+3.01)#32 | 1.28%(+2.58)#694 |
| 33. | Fort Washington | 3.82% | 0.84%(+2.98)#33 | 1.28%(+2.54)#703 |
| 34. | Blue Bell | 3.81% | 0.84%(+2.97)#34 | 1.28%(+2.54)#706 |
| 35. | Loganton Borough | 3.81% | 0.84%(+2.97)#35 | 1.28%(+2.53)#709 |
| 36. | Franklin Park Borough | 3.61% | 0.84%(+2.76)#36 | 1.28%(+2.33)#770 |
| 37. | Skippack | 3.58% | 0.84%(+2.74)#37 | 1.28%(+2.31)#777 |
| 38. | Grapeville | 3.50% | 0.84%(+2.66)#38 | 1.28%(+2.22)#792 |
| 39. | Broomall | 3.47% | 0.84%(+2.63)#39 | 1.28%(+2.19)#808 |
| 40. | Millbourne Borough | 3.44% | 0.84%(+2.60)#40 | 1.28%(+2.16)#819 |
| 41. | Fox Chapel Borough | 3.42% | 0.84%(+2.57)#41 | 1.28%(+2.14)#833 |
| 42. | Lionville | 3.33% | 0.84%(+2.49)#42 | 1.28%(+2.06)#853 |
| 43. | Wesleyville Borough | 3.27% | 0.84%(+2.43)#43 | 1.28%(+2.00)#873 |
| 44. | Queens Gate | 3.27% | 0.84%(+2.42)#44 | 1.28%(+1.99)#878 |
| 45. | Garrett Borough | 3.18% | 0.84%(+2.34)#45 | 1.28%(+1.90)#903 |
| 46. | Bryn Mawr | 3.07% | 0.84%(+2.23)#46 | 1.28%(+1.79)#939 |
| 47. | Big Beaver Borough | 3.01% | 0.84%(+2.16)#47 | 1.28%(+1.73)#959 |
| 48. | Stroudsburg Borough | 2.97% | 0.84%(+2.13)#48 | 1.28%(+1.69)#972 |
| 49. | Ramblewood | 2.97% | 0.84%(+2.12)#49 | 1.28%(+1.69)#974 |
| 50. | Stiles | 2.92% | 0.84%(+2.07)#50 | 1.28%(+1.64)#992 |
| 51. | Flourtown | 2.91% | 0.84%(+2.07)#51 | 1.28%(+1.64)#993 |
| 52. | Warminster Heights | 2.88% | 0.84%(+2.04)#52 | 1.28%(+1.61)#1,009 |
| 53. | Trooper | 2.87% | 0.84%(+2.03)#53 | 1.28%(+1.60)#1,015 |
| 54. | North Belle Vernon Borough | 2.82% | 0.84%(+1.97)#54 | 1.28%(+1.54)#1,035 |
| 55. | Zion | 2.82% | 0.84%(+1.97)#55 | 1.28%(+1.54)#1,036 |
| 56. | Mountainhome | 2.81% | 0.84%(+1.96)#56 | 1.28%(+1.53)#1,042 |
| 57. | Newtown Grant | 2.75% | 0.84%(+1.91)#57 | 1.28%(+1.48)#1,063 |
| 58. | Blawnox Borough | 2.74% | 0.84%(+1.90)#58 | 1.28%(+1.47)#1,068 |
| 59. | King Of Prussia | 2.71% | 0.84%(+1.87)#59 | 1.28%(+1.44)#1,080 |
| 60. | Atlas | 2.56% | 0.84%(+1.72)#60 | 1.28%(+1.28)#1,152 |
| 61. | Morton Borough | 2.54% | 0.84%(+1.69)#61 | 1.28%(+1.26)#1,163 |
| 62. | Exton | 2.54% | 0.84%(+1.69)#62 | 1.28%(+1.26)#1,166 |
| 63. | Bradford Woods Borough | 2.51% | 0.84%(+1.67)#63 | 1.28%(+1.23)#1,179 |
| 64. | Conyngham Borough | 2.50% | 0.84%(+1.66)#64 | 1.28%(+1.23)#1,185 |
| 65. | Plumsteadville | 2.49% | 0.84%(+1.65)#65 | 1.28%(+1.22)#1,188 |
| 66. | Haverford College | 2.46% | 0.84%(+1.62)#66 | 1.28%(+1.19)#1,203 |
| 67. | Willow Street | 2.41% | 0.84%(+1.56)#67 | 1.28%(+1.13)#1,219 |
| 68. | Horsham | 2.34% | 0.84%(+1.50)#68 | 1.28%(+1.06)#1,263 |
| 69. | Laurys Station | 2.34% | 0.84%(+1.49)#69 | 1.28%(+1.06)#1,267 |
| 70. | Evansburg | 2.33% | 0.84%(+1.49)#70 | 1.28%(+1.06)#1,268 |
| 71. | Media Borough | 2.30% | 0.84%(+1.46)#71 | 1.28%(+1.03)#1,283 |
| 72. | Elkins Park | 2.28% | 0.84%(+1.44)#72 | 1.28%(+1.00)#1,299 |
| 73. | Hatboro Borough | 2.26% | 0.84%(+1.42)#73 | 1.28%(+0.987)#1,308 |
| 74. | Apollo Borough | 2.25% | 0.84%(+1.40)#74 | 1.28%(+0.970)#1,318 |
| 75. | Palmdale | 2.23% | 0.84%(+1.38)#75 | 1.28%(+0.952)#1,329 |
| 76. | Bala Cynwyd | 2.21% | 0.84%(+1.36)#76 | 1.28%(+0.931)#1,343 |
| 77. | Ardmore | 2.20% | 0.84%(+1.36)#77 | 1.28%(+0.927)#1,350 |
| 78. | Mcknightstown | 2.19% | 0.84%(+1.35)#78 | 1.28%(+0.913)#1,357 |
| 79. | Fredonia Borough | 2.17% | 0.84%(+1.33)#79 | 1.28%(+0.898)#1,364 |
| 80. | Connoquenessing Borough | 2.16% | 0.84%(+1.32)#80 | 1.28%(+0.888)#1,372 |
| 81. | Davidsville | 2.14% | 0.84%(+1.30)#81 | 1.28%(+0.866)#1,390 |
| 82. | Hatfield Borough | 2.09% | 0.84%(+1.25)#82 | 1.28%(+0.816)#1,429 |
| 83. | Merion Station | 2.02% | 0.84%(+1.18)#83 | 1.28%(+0.745)#1,471 |
| 84. | Willow Grove | 1.98% | 0.84%(+1.13)#84 | 1.28%(+0.701)#1,514 |
| 85. | Philadelphia | 1.97% | 0.84%(+1.12)#85 | 1.28%(+0.692)#1,522 |
| 86. | Pittsburgh | 1.95% | 0.84%(+1.11)#86 | 1.28%(+0.678)#1,535 |
| 87. | Phoenixville Borough | 1.94% | 0.84%(+1.10)#87 | 1.28%(+0.668)#1,540 |
| 88. | Hughestown Borough | 1.93% | 0.84%(+1.08)#88 | 1.28%(+0.651)#1,558 |
| 89. | Breinigsville | 1.91% | 0.84%(+1.07)#89 | 1.28%(+0.639)#1,566 |
| 90. | Wayne | 1.89% | 0.84%(+1.05)#90 | 1.28%(+0.615)#1,584 |
| 91. | University Of Pittsburgh Bradford | 1.85% | 0.84%(+1.00)#91 | 1.28%(+0.572)#1,621 |
| 92. | State Line | 1.83% | 0.84%(+0.984)#92 | 1.28%(+0.551)#1,644 |
| 93. | Castle Shannon Borough | 1.81% | 0.84%(+0.969)#93 | 1.28%(+0.535)#1,662 |
| 94. | Millersville Borough | 1.79% | 0.84%(+0.950)#94 | 1.28%(+0.516)#1,678 |
| 95. | Great Bend Borough | 1.78% | 0.84%(+0.941)#95 | 1.28%(+0.507)#1,681 |
| 96. | Kulpmont Borough | 1.78% | 0.84%(+0.934)#96 | 1.28%(+0.501)#1,688 |
| 97. | West Reading Borough | 1.76% | 0.84%(+0.922)#97 | 1.28%(+0.489)#1,700 |
| 98. | Villanova | 1.68% | 0.84%(+0.841)#98 | 1.28%(+0.407)#1,791 |
| 99. | Mckinley | 1.68% | 0.84%(+0.834)#99 | 1.28%(+0.401)#1,802 |
| 100. | Saegertown Borough | 1.65% | 0.84%(+0.812)#100 | 1.28%(+0.379)#1,832 |
Common Questions
What are the Top 10 Cities with the Highest Percentage of Immigrants from Eastern Asia in Pennsylvania?
Top 10 Cities with the Highest Percentage of Immigrants from Eastern Asia in Pennsylvania are:
#1
17.79%
#2
12.69%
#3
9.63%
#4
9.00%
#5
7.11%
#6
6.84%
#7
6.54%
#8
6.26%
#9
5.65%
#10
5.54%
What city has the Highest Percentage of Immigrants from Eastern Asia in Pennsylvania?
Goodville has the Highest Percentage of Immigrants from Eastern Asia in Pennsylvania with 17.79%.
What is the Percentage of Immigrants from Eastern Asia in the State of Pennsylvania?
Percentage of Immigrants from Eastern Asia in Pennsylvania is 0.84%.
What is the Percentage of Immigrants from Eastern Asia in the United States?
Percentage of Immigrants from Eastern Asia in the United States is 1.28%.