Cities with the Largest Belgian Community in Georgia
RELATED REPORTS & OPTIONS
Belgian
Georgia
Compare Cities
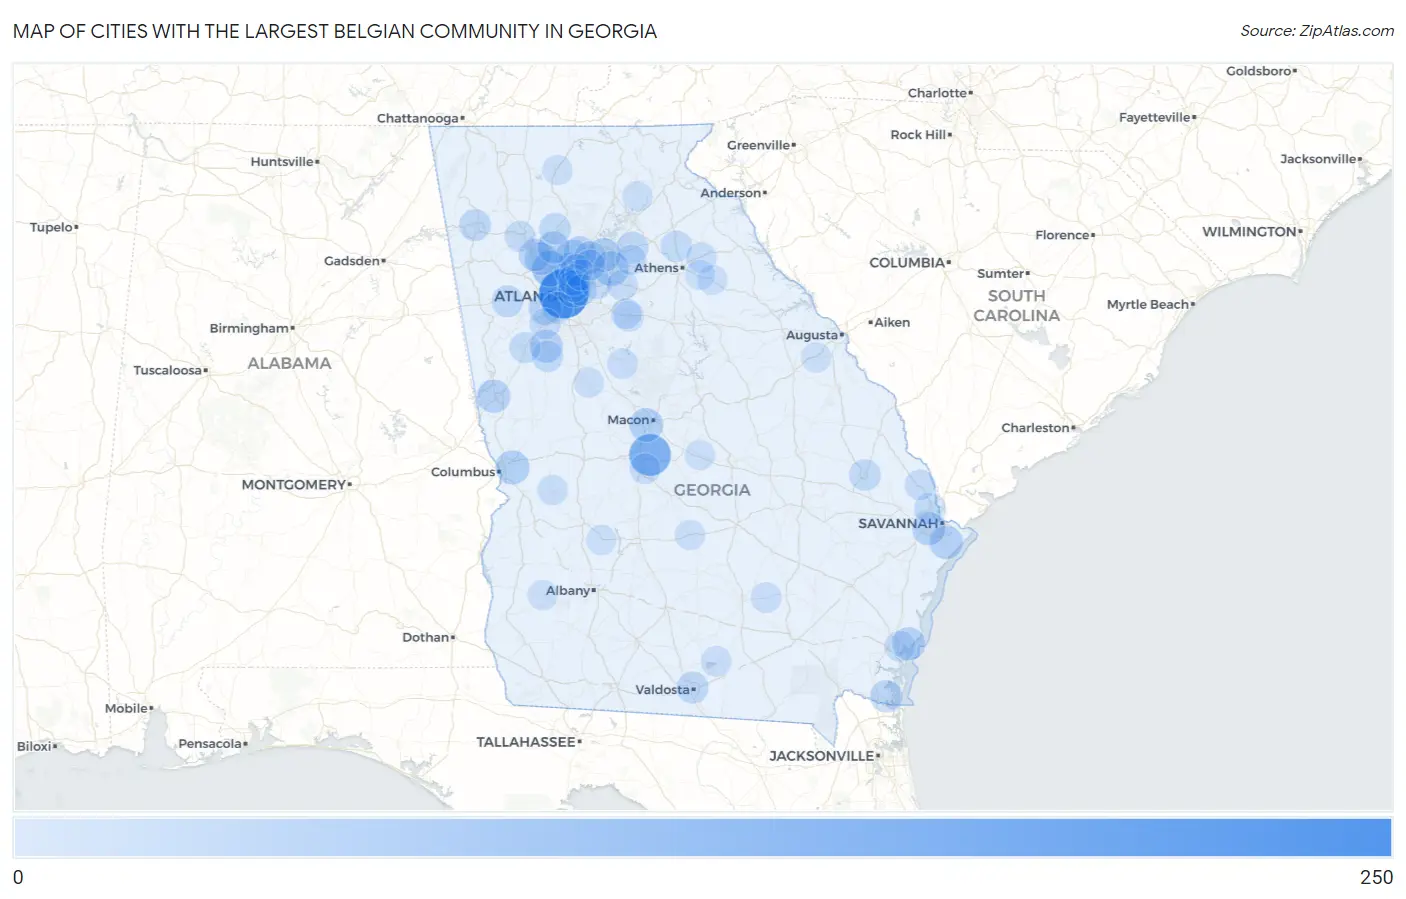
Map of Cities with the Largest Belgian Community in Georgia
0
250
Cities with the Largest Belgian Community in Georgia
| City | Belgian | vs State | vs National | |
| 1. | Atlanta | 247 | 3,893(6.34%)#1 | 327,258(0.08%)#129 |
| 2. | Warner Robins | 145 | 3,893(3.72%)#2 | 327,258(0.04%)#279 |
| 3. | Athens-Clarke County Unified Government (Balance) | 98 | 3,893(2.52%)#3 | 327,258(0.03%)#444 |
| 4. | Marietta | 70 | 3,893(1.80%)#4 | 327,258(0.02%)#697 |
| 5. | Lawrenceville | 56 | 3,893(1.44%)#5 | 327,258(0.02%)#907 |
| 6. | Sandy Springs | 53 | 3,893(1.36%)#6 | 327,258(0.02%)#965 |
| 7. | Columbus | 48 | 3,893(1.23%)#7 | 327,258(0.01%)#1,054 |
| 8. | Suwanee | 48 | 3,893(1.23%)#8 | 327,258(0.01%)#1,064 |
| 9. | Macon Bibb County | 45 | 3,893(1.16%)#9 | 327,258(0.01%)#1,120 |
| 10. | Skidaway Island | 40 | 3,893(1.03%)#10 | 327,258(0.01%)#1,271 |
| 11. | Roswell | 39 | 3,893(1.00%)#11 | 327,258(0.01%)#1,284 |
| 12. | Lagrange | 37 | 3,893(0.95%)#12 | 327,258(0.01%)#1,348 |
| 13. | Savannah | 36 | 3,893(0.92%)#13 | 327,258(0.01%)#1,372 |
| 14. | St Simons | 36 | 3,893(0.92%)#14 | 327,258(0.01%)#1,384 |
| 15. | Peachtree City | 33 | 3,893(0.85%)#15 | 327,258(0.01%)#1,486 |
| 16. | Kennesaw | 32 | 3,893(0.82%)#16 | 327,258(0.01%)#1,528 |
| 17. | South Fulton | 31 | 3,893(0.80%)#17 | 327,258(0.01%)#1,561 |
| 18. | Alpharetta | 29 | 3,893(0.74%)#18 | 327,258(0.01%)#1,651 |
| 19. | Druid Hills | 29 | 3,893(0.74%)#19 | 327,258(0.01%)#1,672 |
| 20. | Acworth | 28 | 3,893(0.72%)#20 | 327,258(0.01%)#1,701 |
| 21. | Johns Creek | 26 | 3,893(0.67%)#21 | 327,258(0.01%)#1,769 |
| 22. | Woodstock | 26 | 3,893(0.67%)#22 | 327,258(0.01%)#1,780 |
| 23. | St Marys | 25 | 3,893(0.64%)#23 | 327,258(0.01%)#1,839 |
| 24. | Valdosta | 22 | 3,893(0.57%)#24 | 327,258(0.01%)#2,003 |
| 25. | Dunwoody | 21 | 3,893(0.54%)#25 | 327,258(0.01%)#2,070 |
| 26. | Rome | 21 | 3,893(0.54%)#26 | 327,258(0.01%)#2,072 |
| 27. | Villa Rica | 20 | 3,893(0.51%)#27 | 327,258(0.01%)#2,136 |
| 28. | Braselton | 20 | 3,893(0.51%)#28 | 327,258(0.01%)#2,141 |
| 29. | Canton | 19 | 3,893(0.49%)#29 | 327,258(0.01%)#2,210 |
| 30. | Statesboro | 18 | 3,893(0.46%)#30 | 327,258(0.01%)#2,290 |
| 31. | North Druid Hills | 17 | 3,893(0.44%)#31 | 327,258(0.01%)#2,399 |
| 32. | Port Wentworth | 16 | 3,893(0.41%)#32 | 327,258(0.00%)#2,492 |
| 33. | Senoia | 16 | 3,893(0.41%)#33 | 327,258(0.00%)#2,515 |
| 34. | Newnan | 15 | 3,893(0.39%)#34 | 327,258(0.00%)#2,555 |
| 35. | Nicholson | 15 | 3,893(0.39%)#35 | 327,258(0.00%)#2,632 |
| 36. | Brookhaven | 14 | 3,893(0.36%)#36 | 327,258(0.00%)#2,659 |
| 37. | East Point | 14 | 3,893(0.36%)#37 | 327,258(0.00%)#2,666 |
| 38. | Scottdale | 13 | 3,893(0.33%)#38 | 327,258(0.00%)#2,837 |
| 39. | Brunswick | 11 | 3,893(0.28%)#39 | 327,258(0.00%)#3,088 |
| 40. | Doraville | 11 | 3,893(0.28%)#40 | 327,258(0.00%)#3,104 |
| 41. | Cartersville | 10 | 3,893(0.26%)#41 | 327,258(0.00%)#3,246 |
| 42. | Fairburn | 10 | 3,893(0.26%)#42 | 327,258(0.00%)#3,258 |
| 43. | Mountain Park | 10 | 3,893(0.26%)#43 | 327,258(0.00%)#3,265 |
| 44. | Augusta-Richmond County Consolidated Government (Balance) | 8 | 3,893(0.21%)#44 | 327,258(0.00%)#3,535 |
| 45. | Perry | 8 | 3,893(0.21%)#45 | 327,258(0.00%)#3,576 |
| 46. | Loganville | 8 | 3,893(0.21%)#46 | 327,258(0.00%)#3,607 |
| 47. | Springfield | 8 | 3,893(0.21%)#47 | 327,258(0.00%)#3,666 |
| 48. | Berkeley Lake | 8 | 3,893(0.21%)#48 | 327,258(0.00%)#3,674 |
| 49. | Flovilla | 7 | 3,893(0.18%)#49 | 327,258(0.00%)#3,896 |
| 50. | Covington | 6 | 3,893(0.15%)#50 | 327,258(0.00%)#3,969 |
| 51. | Nicholls | 6 | 3,893(0.15%)#51 | 327,258(0.00%)#4,024 |
| 52. | Auburn | 5 | 3,893(0.13%)#52 | 327,258(0.00%)#4,165 |
| 53. | Lakeland | 5 | 3,893(0.13%)#53 | 327,258(0.00%)#4,194 |
| 54. | Oxford | 5 | 3,893(0.13%)#54 | 327,258(0.00%)#4,218 |
| 55. | Buena Vista | 4 | 3,893(0.10%)#55 | 327,258(0.00%)#4,394 |
| 56. | Colbert | 4 | 3,893(0.10%)#56 | 327,258(0.00%)#4,491 |
| 57. | Abbeville | 3 | 3,893(0.08%)#57 | 327,258(0.00%)#4,572 |
| 58. | Milner | 3 | 3,893(0.08%)#58 | 327,258(0.00%)#4,733 |
| 59. | Leslie | 3 | 3,893(0.08%)#59 | 327,258(0.00%)#4,748 |
| 60. | Berry College | 2 | 3,893(0.05%)#60 | 327,258(0.00%)#4,846 |
| 61. | Clermont | 2 | 3,893(0.05%)#61 | 327,258(0.00%)#4,886 |
| 62. | Blythe | 2 | 3,893(0.05%)#62 | 327,258(0.00%)#4,965 |
| 63. | East Ellijay | 2 | 3,893(0.05%)#63 | 327,258(0.00%)#5,009 |
| 64. | Lexington | 2 | 3,893(0.05%)#64 | 327,258(0.00%)#5,044 |
| 65. | Morgan | 1 | 3,893(0.03%)#65 | 327,258(0.00%)#5,154 |
| 66. | Arnoldsville | 1 | 3,893(0.03%)#66 | 327,258(0.00%)#5,199 |
| 67. | Allentown | 1 | 3,893(0.03%)#67 | 327,258(0.00%)#5,267 |
Common Questions
What are the Top 10 Cities with the Largest Belgian Community in Georgia?
Top 10 Cities with the Largest Belgian Community in Georgia are:
#1
247
#2
145
#3
70
#4
56
#5
53
#6
48
#7
48
#8
45
#9
40
#10
39
What city has the Largest Belgian Community in Georgia?
Atlanta has the Largest Belgian Community in Georgia with 247.
What is the Total Belgian Population in the State of Georgia?
Total Belgian Population in Georgia is 3,893.
What is the Total Belgian Population in the United States?
Total Belgian Population in the United States is 327,258.