Cities with the Largest Belgian Community in Ohio
RELATED REPORTS & OPTIONS
Belgian
Ohio
Compare Cities
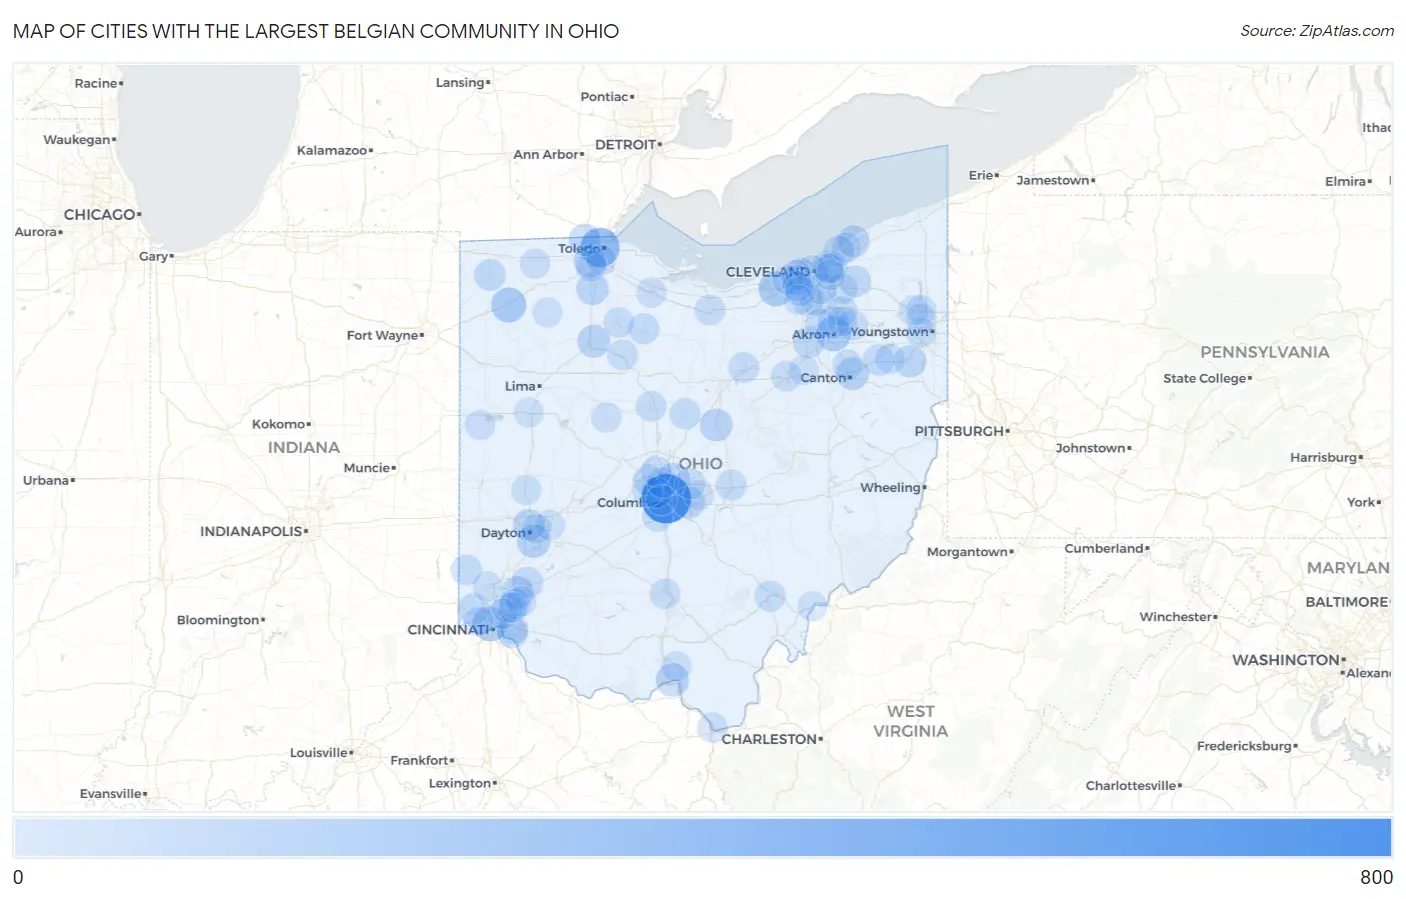
Map of Cities with the Largest Belgian Community in Ohio
0
800
Cities with the Largest Belgian Community in Ohio
| City | Belgian | vs State | vs National | |
| 1. | Columbus | 646 | 8,418(7.67%)#1 | 327,258(0.20%)#40 |
| 2. | Toledo | 305 | 8,418(3.62%)#2 | 327,258(0.09%)#97 |
| 3. | North Ridgeville | 173 | 8,418(2.06%)#3 | 327,258(0.05%)#216 |
| 4. | Defiance | 171 | 8,418(2.03%)#4 | 327,258(0.05%)#220 |
| 5. | Akron | 166 | 8,418(1.97%)#5 | 327,258(0.05%)#228 |
| 6. | Cincinnati | 164 | 8,418(1.95%)#6 | 327,258(0.05%)#236 |
| 7. | Kettering | 116 | 8,418(1.38%)#7 | 327,258(0.04%)#364 |
| 8. | Portsmouth | 114 | 8,418(1.35%)#8 | 327,258(0.03%)#371 |
| 9. | Canton | 97 | 8,418(1.15%)#9 | 327,258(0.03%)#452 |
| 10. | Findlay | 97 | 8,418(1.15%)#10 | 327,258(0.03%)#454 |
| 11. | Fredericktown | 97 | 8,418(1.15%)#11 | 327,258(0.03%)#457 |
| 12. | Mason | 92 | 8,418(1.09%)#12 | 327,258(0.03%)#496 |
| 13. | Bowling Green | 91 | 8,418(1.08%)#13 | 327,258(0.03%)#504 |
| 14. | Maumee | 91 | 8,418(1.08%)#14 | 327,258(0.03%)#506 |
| 15. | Sylvania | 86 | 8,418(1.02%)#15 | 327,258(0.03%)#541 |
| 16. | Salem | 83 | 8,418(0.99%)#16 | 327,258(0.03%)#564 |
| 17. | Westerville | 81 | 8,418(0.96%)#17 | 327,258(0.02%)#578 |
| 18. | Dayton | 75 | 8,418(0.89%)#18 | 327,258(0.02%)#640 |
| 19. | Reynoldsburg | 74 | 8,418(0.88%)#19 | 327,258(0.02%)#653 |
| 20. | Mentor | 73 | 8,418(0.87%)#20 | 327,258(0.02%)#665 |
| 21. | Cleveland | 68 | 8,418(0.81%)#21 | 327,258(0.02%)#721 |
| 22. | Lakewood | 68 | 8,418(0.81%)#22 | 327,258(0.02%)#725 |
| 23. | Cuyahoga Falls | 65 | 8,418(0.77%)#23 | 327,258(0.02%)#760 |
| 24. | Wadsworth | 65 | 8,418(0.77%)#24 | 327,258(0.02%)#765 |
| 25. | Bryan | 64 | 8,418(0.76%)#25 | 327,258(0.02%)#788 |
| 26. | South Russell | 63 | 8,418(0.75%)#26 | 327,258(0.02%)#804 |
| 27. | Lebanon | 61 | 8,418(0.72%)#27 | 327,258(0.02%)#827 |
| 28. | Alliance | 57 | 8,418(0.68%)#28 | 327,258(0.02%)#893 |
| 29. | Dry Run | 57 | 8,418(0.68%)#29 | 327,258(0.02%)#901 |
| 30. | East Cleveland | 52 | 8,418(0.62%)#30 | 327,258(0.02%)#994 |
| 31. | Taylor Creek | 52 | 8,418(0.62%)#31 | 327,258(0.02%)#997 |
| 32. | Newark | 50 | 8,418(0.59%)#32 | 327,258(0.02%)#1,022 |
| 33. | Willowick | 50 | 8,418(0.59%)#33 | 327,258(0.02%)#1,026 |
| 34. | North Royalton | 49 | 8,418(0.58%)#34 | 327,258(0.01%)#1,041 |
| 35. | Forestville | 49 | 8,418(0.58%)#35 | 327,258(0.01%)#1,047 |
| 36. | Dublin | 47 | 8,418(0.56%)#36 | 327,258(0.01%)#1,073 |
| 37. | Tiffin | 47 | 8,418(0.56%)#37 | 327,258(0.01%)#1,080 |
| 38. | Broadview Heights | 46 | 8,418(0.55%)#38 | 327,258(0.01%)#1,106 |
| 39. | Athens | 45 | 8,418(0.53%)#39 | 327,258(0.01%)#1,127 |
| 40. | Mount Gilead | 45 | 8,418(0.53%)#40 | 327,258(0.01%)#1,145 |
| 41. | Ashland | 44 | 8,418(0.52%)#41 | 327,258(0.01%)#1,159 |
| 42. | Oxford | 43 | 8,418(0.51%)#42 | 327,258(0.01%)#1,179 |
| 43. | Upper Arlington | 41 | 8,418(0.49%)#43 | 327,258(0.01%)#1,229 |
| 44. | Blue Ash | 40 | 8,418(0.48%)#44 | 327,258(0.01%)#1,266 |
| 45. | Sixteen Mile Stand | 39 | 8,418(0.46%)#45 | 327,258(0.01%)#1,309 |
| 46. | Grove City | 37 | 8,418(0.44%)#46 | 327,258(0.01%)#1,345 |
| 47. | Perrysburg | 37 | 8,418(0.44%)#47 | 327,258(0.01%)#1,349 |
| 48. | Norwalk | 37 | 8,418(0.44%)#48 | 327,258(0.01%)#1,352 |
| 49. | Hilliard | 36 | 8,418(0.43%)#49 | 327,258(0.01%)#1,378 |
| 50. | Carey | 35 | 8,418(0.42%)#50 | 327,258(0.01%)#1,433 |
| 51. | Kent | 34 | 8,418(0.40%)#51 | 327,258(0.01%)#1,450 |
| 52. | North Canton | 34 | 8,418(0.40%)#52 | 327,258(0.01%)#1,454 |
| 53. | Fostoria | 34 | 8,418(0.40%)#53 | 327,258(0.01%)#1,459 |
| 54. | Worthington | 32 | 8,418(0.38%)#54 | 327,258(0.01%)#1,539 |
| 55. | Independence | 32 | 8,418(0.38%)#55 | 327,258(0.01%)#1,546 |
| 56. | Marion | 31 | 8,418(0.37%)#56 | 327,258(0.01%)#1,570 |
| 57. | Wooster | 31 | 8,418(0.37%)#57 | 327,258(0.01%)#1,573 |
| 58. | Solon | 31 | 8,418(0.37%)#58 | 327,258(0.01%)#1,574 |
| 59. | Chillicothe | 31 | 8,418(0.37%)#59 | 327,258(0.01%)#1,576 |
| 60. | South Euclid | 31 | 8,418(0.37%)#60 | 327,258(0.01%)#1,577 |
| 61. | Rocky River | 29 | 8,418(0.34%)#61 | 327,258(0.01%)#1,663 |
| 62. | Hudson | 27 | 8,418(0.32%)#62 | 327,258(0.01%)#1,729 |
| 63. | South Point | 27 | 8,418(0.32%)#63 | 327,258(0.01%)#1,754 |
| 64. | Fremont | 26 | 8,418(0.31%)#64 | 327,258(0.01%)#1,794 |
| 65. | Powell | 26 | 8,418(0.31%)#65 | 327,258(0.01%)#1,796 |
| 66. | Shaker Heights | 25 | 8,418(0.30%)#66 | 327,258(0.01%)#1,830 |
| 67. | Loveland Park | 25 | 8,418(0.30%)#67 | 327,258(0.01%)#1,863 |
| 68. | Wauseon | 24 | 8,418(0.29%)#68 | 327,258(0.01%)#1,907 |
| 69. | Amberley | 24 | 8,418(0.29%)#69 | 327,258(0.01%)#1,919 |
| 70. | Willoughby | 23 | 8,418(0.27%)#70 | 327,258(0.01%)#1,945 |
| 71. | Montrose Ghent | 23 | 8,418(0.27%)#71 | 327,258(0.01%)#1,971 |
| 72. | Coldwater | 23 | 8,418(0.27%)#72 | 327,258(0.01%)#1,976 |
| 73. | New Albany | 22 | 8,418(0.26%)#73 | 327,258(0.01%)#2,028 |
| 74. | Grandview Heights | 22 | 8,418(0.26%)#74 | 327,258(0.01%)#2,034 |
| 75. | Mount Victory | 22 | 8,418(0.26%)#75 | 327,258(0.01%)#2,063 |
| 76. | Westlake | 21 | 8,418(0.25%)#76 | 327,258(0.01%)#2,074 |
| 77. | Troy | 21 | 8,418(0.25%)#77 | 327,258(0.01%)#2,078 |
| 78. | Niles | 21 | 8,418(0.25%)#78 | 327,258(0.01%)#2,084 |
| 79. | Fairview Park | 21 | 8,418(0.25%)#79 | 327,258(0.01%)#2,087 |
| 80. | Hamilton | 19 | 8,418(0.23%)#80 | 327,258(0.01%)#2,198 |
| 81. | Strongsville | 19 | 8,418(0.23%)#81 | 327,258(0.01%)#2,206 |
| 82. | Fairborn | 19 | 8,418(0.23%)#82 | 327,258(0.01%)#2,209 |
| 83. | Brook Park | 19 | 8,418(0.23%)#83 | 327,258(0.01%)#2,217 |
| 84. | Middleburg Heights | 19 | 8,418(0.23%)#84 | 327,258(0.01%)#2,223 |
| 85. | Sebring | 19 | 8,418(0.23%)#85 | 327,258(0.01%)#2,253 |
| 86. | Clarktown | 19 | 8,418(0.23%)#86 | 327,258(0.01%)#2,273 |
| 87. | Cleveland Heights | 18 | 8,418(0.21%)#87 | 327,258(0.01%)#2,284 |
| 88. | Austintown | 18 | 8,418(0.21%)#88 | 327,258(0.01%)#2,291 |
| 89. | Pataskala | 18 | 8,418(0.21%)#89 | 327,258(0.01%)#2,307 |
| 90. | Rossford | 18 | 8,418(0.21%)#90 | 327,258(0.01%)#2,333 |
| 91. | Warren | 17 | 8,418(0.20%)#91 | 327,258(0.01%)#2,380 |
| 92. | Montgomery | 17 | 8,418(0.20%)#92 | 327,258(0.01%)#2,410 |
| 93. | Wapakoneta | 17 | 8,418(0.20%)#93 | 327,258(0.01%)#2,412 |
| 94. | Howland Center | 17 | 8,418(0.20%)#94 | 327,258(0.01%)#2,418 |
| 95. | Orrville | 16 | 8,418(0.19%)#95 | 327,258(0.00%)#2,504 |
| 96. | Little Hocking | 16 | 8,418(0.19%)#96 | 327,258(0.00%)#2,544 |
| 97. | Hamler | 16 | 8,418(0.19%)#97 | 327,258(0.00%)#2,546 |
| 98. | Stow | 15 | 8,418(0.18%)#98 | 327,258(0.00%)#2,559 |
| 99. | Riverside | 15 | 8,418(0.18%)#99 | 327,258(0.00%)#2,568 |
| 100. | Bridgetown | 15 | 8,418(0.18%)#100 | 327,258(0.00%)#2,582 |
Common Questions
What are the Top 10 Cities with the Largest Belgian Community in Ohio?
Top 10 Cities with the Largest Belgian Community in Ohio are:
#1
646
#2
305
#3
173
#4
171
#5
166
#6
164
#7
116
#8
114
#9
97
#10
97
What city has the Largest Belgian Community in Ohio?
Columbus has the Largest Belgian Community in Ohio with 646.
What is the Total Belgian Population in the State of Ohio?
Total Belgian Population in Ohio is 8,418.
What is the Total Belgian Population in the United States?
Total Belgian Population in the United States is 327,258.