Cities with the Largest Belgian Community in South Carolina
RELATED REPORTS & OPTIONS
Belgian
South Carolina
Compare Cities
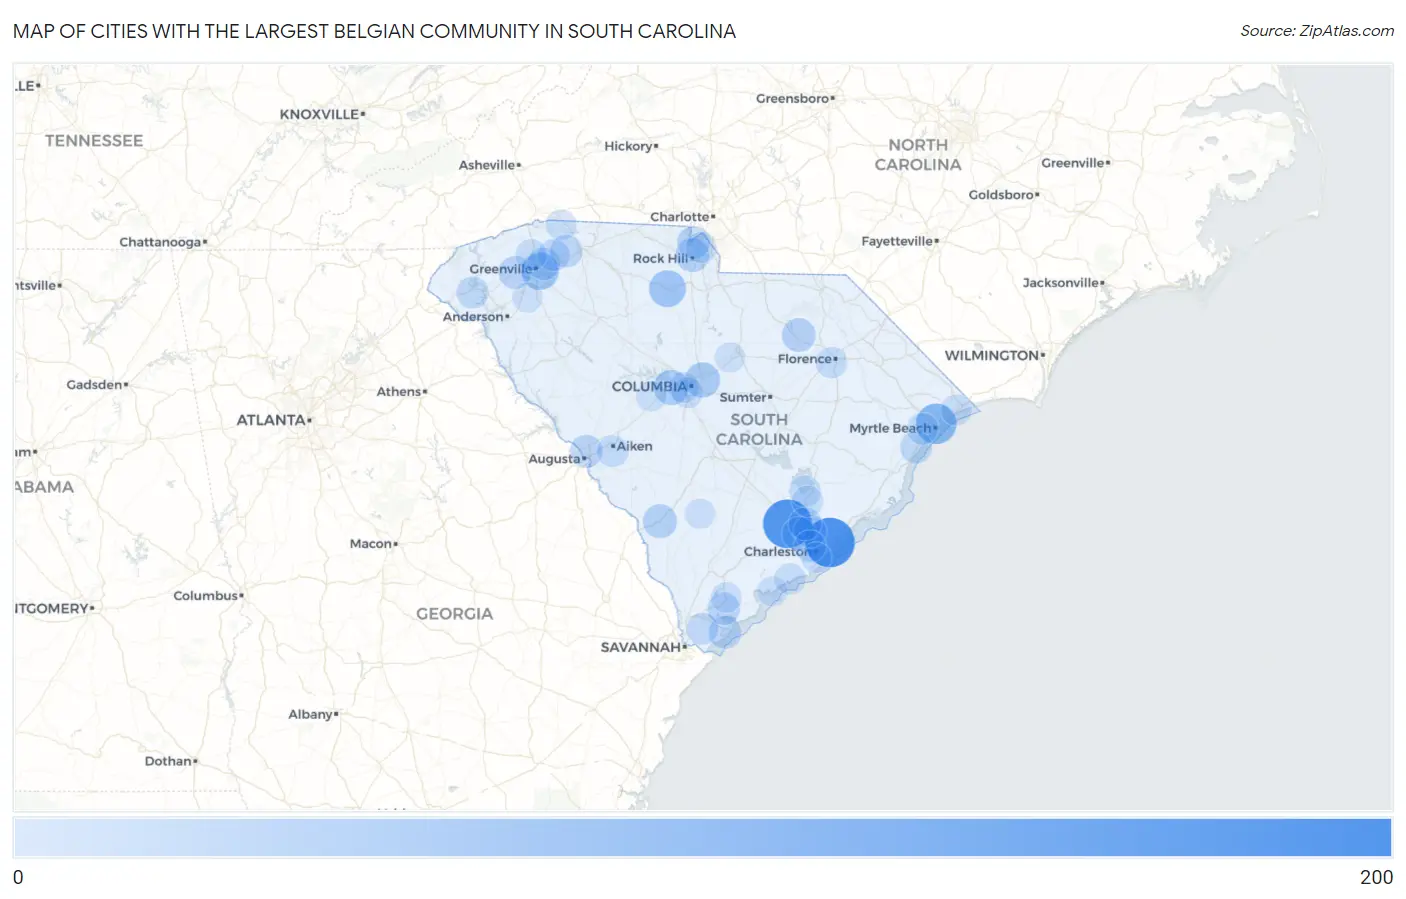
Map of Cities with the Largest Belgian Community in South Carolina
0
200
Cities with the Largest Belgian Community in South Carolina
| City | Belgian | vs State | vs National | |
| 1. | Mount Pleasant | 196 | 2,600(7.54%)#1 | 327,258(0.06%)#183 |
| 2. | Summerville | 187 | 2,600(7.19%)#2 | 327,258(0.06%)#196 |
| 3. | Myrtle Beach | 103 | 2,600(3.96%)#3 | 327,258(0.03%)#424 |
| 4. | Greenville | 70 | 2,600(2.69%)#4 | 327,258(0.02%)#696 |
| 5. | Gayle Mill | 66 | 2,600(2.54%)#5 | 327,258(0.02%)#754 |
| 6. | Columbia | 50 | 2,600(1.92%)#6 | 327,258(0.02%)#1,017 |
| 7. | Lexington | 48 | 2,600(1.85%)#7 | 327,258(0.01%)#1,063 |
| 8. | Allendale | 38 | 2,600(1.46%)#8 | 327,258(0.01%)#1,332 |
| 9. | Rock Hill | 37 | 2,600(1.42%)#9 | 327,258(0.01%)#1,335 |
| 10. | Hartsville | 35 | 2,600(1.35%)#10 | 327,258(0.01%)#1,428 |
| 11. | North Charleston | 32 | 2,600(1.23%)#11 | 327,258(0.01%)#1,518 |
| 12. | Hanahan | 27 | 2,600(1.04%)#12 | 327,258(0.01%)#1,733 |
| 13. | Tega Cay | 27 | 2,600(1.04%)#13 | 327,258(0.01%)#1,743 |
| 14. | Goose Creek | 26 | 2,600(1.00%)#14 | 327,258(0.01%)#1,776 |
| 15. | North Augusta | 26 | 2,600(1.00%)#15 | 327,258(0.01%)#1,785 |
| 16. | Easley | 26 | 2,600(1.00%)#16 | 327,258(0.01%)#1,789 |
| 17. | Hilton Head Island | 24 | 2,600(0.92%)#17 | 327,258(0.01%)#1,881 |
| 18. | Wade Hampton | 23 | 2,600(0.88%)#18 | 327,258(0.01%)#1,948 |
| 19. | Port Royal | 23 | 2,600(0.88%)#19 | 327,258(0.01%)#1,954 |
| 20. | Lyman | 22 | 2,600(0.85%)#20 | 327,258(0.01%)#2,039 |
| 21. | Greer | 18 | 2,600(0.69%)#21 | 327,258(0.01%)#2,287 |
| 22. | Murrells Inlet | 18 | 2,600(0.69%)#22 | 327,258(0.01%)#2,323 |
| 23. | Seneca | 18 | 2,600(0.69%)#23 | 327,258(0.01%)#2,329 |
| 24. | Charleston | 17 | 2,600(0.65%)#24 | 327,258(0.01%)#2,368 |
| 25. | Bluffton | 16 | 2,600(0.62%)#25 | 327,258(0.00%)#2,465 |
| 26. | Socastee | 14 | 2,600(0.54%)#26 | 327,258(0.00%)#2,680 |
| 27. | Aiken | 13 | 2,600(0.50%)#27 | 327,258(0.00%)#2,800 |
| 28. | Pinopolis | 13 | 2,600(0.50%)#28 | 327,258(0.00%)#2,901 |
| 29. | Florence | 12 | 2,600(0.46%)#29 | 327,258(0.00%)#2,925 |
| 30. | Travelers Rest | 12 | 2,600(0.46%)#30 | 327,258(0.00%)#2,975 |
| 31. | Baxter | 12 | 2,600(0.46%)#31 | 327,258(0.00%)#2,993 |
| 32. | Cayce | 9 | 2,600(0.35%)#32 | 327,258(0.00%)#3,424 |
| 33. | Moncks Corner | 9 | 2,600(0.35%)#33 | 327,258(0.00%)#3,426 |
| 34. | Seabrook Island | 9 | 2,600(0.35%)#34 | 327,258(0.00%)#3,490 |
| 35. | Fort Mill | 8 | 2,600(0.31%)#35 | 327,258(0.00%)#3,567 |
| 36. | Carolina Forest | 8 | 2,600(0.31%)#36 | 327,258(0.00%)#3,571 |
| 37. | North Myrtle Beach | 8 | 2,600(0.31%)#37 | 327,258(0.00%)#3,583 |
| 38. | West Columbia | 8 | 2,600(0.31%)#38 | 327,258(0.00%)#3,592 |
| 39. | The Cliffs Valley | 8 | 2,600(0.31%)#39 | 327,258(0.00%)#3,708 |
| 40. | Landrum | 6 | 2,600(0.23%)#40 | 327,258(0.00%)#4,040 |
| 41. | Beaufort | 5 | 2,600(0.19%)#41 | 327,258(0.00%)#4,152 |
| 42. | Lugoff | 2 | 2,600(0.08%)#42 | 327,258(0.00%)#4,811 |
| 43. | West Pelzer | 2 | 2,600(0.08%)#43 | 327,258(0.00%)#4,883 |
| 44. | Edisto Beach | 2 | 2,600(0.08%)#44 | 327,258(0.00%)#4,916 |
| 45. | Gilbert | 2 | 2,600(0.08%)#45 | 327,258(0.00%)#5,000 |
| 46. | Lodge | 2 | 2,600(0.08%)#46 | 327,258(0.00%)#5,101 |
| 47. | James Island | 1 | 2,600(0.04%)#47 | 327,258(0.00%)#5,136 |
Common Questions
What are the Top 10 Cities with the Largest Belgian Community in South Carolina?
Top 10 Cities with the Largest Belgian Community in South Carolina are:
#1
196
#2
187
#3
103
#4
70
#5
66
#6
50
#7
48
#8
38
#9
37
#10
35
What city has the Largest Belgian Community in South Carolina?
Mount Pleasant has the Largest Belgian Community in South Carolina with 196.
What is the Total Belgian Population in the State of South Carolina?
Total Belgian Population in South Carolina is 2,600.
What is the Total Belgian Population in the United States?
Total Belgian Population in the United States is 327,258.