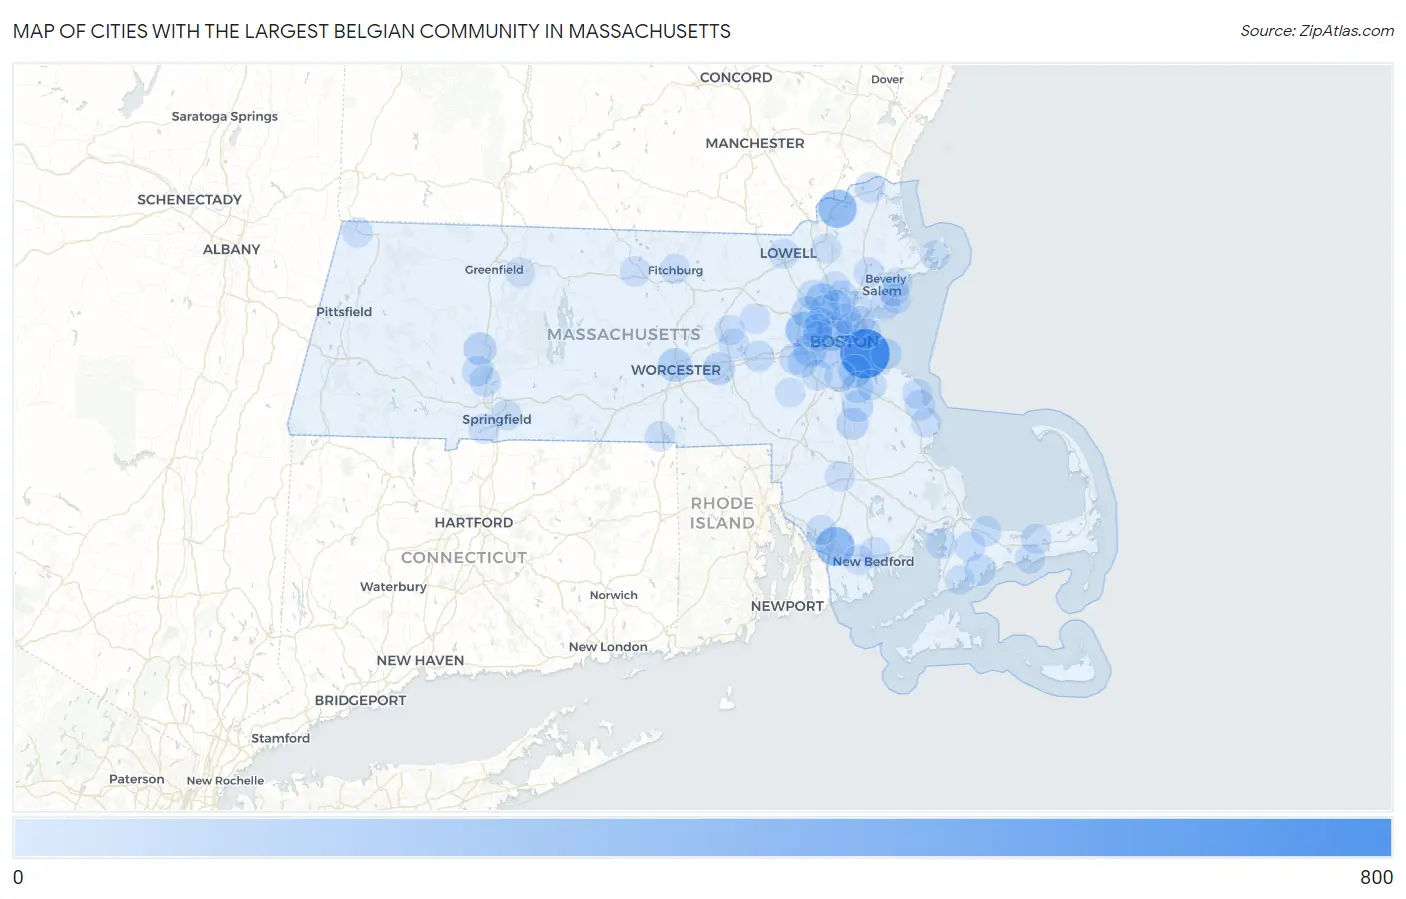
Cities with the Largest Belgian Community in Massachusetts
RELATED REPORTS & OPTIONS
Belgian
Massachusetts
Compare Cities
Map of Cities with the Largest Belgian Community in Massachusetts
0
800
Cities with the Largest Belgian Community in Massachusetts
| City | Belgian | vs State | vs National | |
| 1. | Boston | 662 | 5,510(12.01%)#1 | 327,258(0.20%)#39 |
| 2. | Fall River | 292 | 5,510(5.30%)#2 | 327,258(0.09%)#103 |
| 3. | Haverhill | 277 | 5,510(5.03%)#3 | 327,258(0.08%)#106 |
| 4. | Waltham | 205 | 5,510(3.72%)#4 | 327,258(0.06%)#171 |
| 5. | Cambridge | 153 | 5,510(2.78%)#5 | 327,258(0.05%)#258 |
| 6. | Somerville | 129 | 5,510(2.34%)#6 | 327,258(0.04%)#316 |
| 7. | Newton | 125 | 5,510(2.27%)#7 | 327,258(0.04%)#328 |
| 8. | Woburn | 125 | 5,510(2.27%)#8 | 327,258(0.04%)#329 |
| 9. | Worcester | 120 | 5,510(2.18%)#9 | 327,258(0.04%)#345 |
| 10. | Brookline | 104 | 5,510(1.89%)#10 | 327,258(0.03%)#417 |
| 11. | Quincy | 95 | 5,510(1.72%)#11 | 327,258(0.03%)#469 |
| 12. | Northampton | 93 | 5,510(1.69%)#12 | 327,258(0.03%)#486 |
| 13. | Westborough | 84 | 5,510(1.52%)#13 | 327,258(0.03%)#561 |
| 14. | Lexington | 73 | 5,510(1.32%)#14 | 327,258(0.02%)#666 |
| 15. | Brockton | 65 | 5,510(1.18%)#15 | 327,258(0.02%)#756 |
| 16. | Holbrook | 54 | 5,510(0.98%)#16 | 327,258(0.02%)#957 |
| 17. | Wellesley | 48 | 5,510(0.87%)#17 | 327,258(0.01%)#1,062 |
| 18. | Braintree Town | 47 | 5,510(0.85%)#18 | 327,258(0.01%)#1,076 |
| 19. | Mashpee Neck | 47 | 5,510(0.85%)#19 | 327,258(0.01%)#1,095 |
| 20. | Wakefield | 44 | 5,510(0.80%)#20 | 327,258(0.01%)#1,157 |
| 21. | Holyoke | 37 | 5,510(0.67%)#21 | 327,258(0.01%)#1,346 |
| 22. | Easthampton Town | 35 | 5,510(0.64%)#22 | 327,258(0.01%)#1,417 |
| 23. | North Attleborough | 33 | 5,510(0.60%)#23 | 327,258(0.01%)#1,489 |
| 24. | Milton | 31 | 5,510(0.56%)#24 | 327,258(0.01%)#1,572 |
| 25. | West Warren | 31 | 5,510(0.56%)#25 | 327,258(0.01%)#1,598 |
| 26. | Framingham | 30 | 5,510(0.54%)#26 | 327,258(0.01%)#1,602 |
| 27. | Hull | 30 | 5,510(0.54%)#27 | 327,258(0.01%)#1,629 |
| 28. | Chelsea | 28 | 5,510(0.51%)#28 | 327,258(0.01%)#1,693 |
| 29. | Winchester | 28 | 5,510(0.51%)#29 | 327,258(0.01%)#1,700 |
| 30. | Arlington | 27 | 5,510(0.49%)#30 | 327,258(0.01%)#1,722 |
| 31. | Dedham | 26 | 5,510(0.47%)#31 | 327,258(0.01%)#1,783 |
| 32. | Amesbury Town | 26 | 5,510(0.47%)#32 | 327,258(0.01%)#1,792 |
| 33. | Pocasset | 26 | 5,510(0.47%)#33 | 327,258(0.01%)#1,810 |
| 34. | Saugus | 25 | 5,510(0.45%)#34 | 327,258(0.01%)#1,831 |
| 35. | Marshfield Hills | 23 | 5,510(0.42%)#35 | 327,258(0.01%)#1,985 |
| 36. | Forestdale | 22 | 5,510(0.40%)#36 | 327,258(0.01%)#2,045 |
| 37. | New Bedford | 21 | 5,510(0.38%)#37 | 327,258(0.01%)#2,067 |
| 38. | Burlington | 20 | 5,510(0.36%)#38 | 327,258(0.01%)#2,131 |
| 39. | Swampscott | 19 | 5,510(0.34%)#39 | 327,258(0.01%)#2,224 |
| 40. | Springfield | 18 | 5,510(0.33%)#40 | 327,258(0.01%)#2,275 |
| 41. | Weymouth Town | 18 | 5,510(0.33%)#41 | 327,258(0.01%)#2,280 |
| 42. | East Sandwich | 18 | 5,510(0.33%)#42 | 327,258(0.01%)#2,342 |
| 43. | Needham | 17 | 5,510(0.31%)#43 | 327,258(0.01%)#2,387 |
| 44. | Gardner | 17 | 5,510(0.31%)#44 | 327,258(0.01%)#2,394 |
| 45. | Revere | 16 | 5,510(0.29%)#45 | 327,258(0.00%)#2,460 |
| 46. | Maynard | 16 | 5,510(0.29%)#46 | 327,258(0.00%)#2,495 |
| 47. | Smith Mills | 16 | 5,510(0.29%)#47 | 327,258(0.00%)#2,518 |
| 48. | Williamstown | 16 | 5,510(0.29%)#48 | 327,258(0.00%)#2,521 |
| 49. | Agawam Town | 15 | 5,510(0.27%)#49 | 327,258(0.00%)#2,565 |
| 50. | Malden | 14 | 5,510(0.25%)#50 | 327,258(0.00%)#2,657 |
| 51. | Stoneham | 14 | 5,510(0.25%)#51 | 327,258(0.00%)#2,684 |
| 52. | Marblehead | 14 | 5,510(0.25%)#52 | 327,258(0.00%)#2,690 |
| 53. | Lowell | 13 | 5,510(0.24%)#53 | 327,258(0.00%)#2,784 |
| 54. | Salem | 13 | 5,510(0.24%)#54 | 327,258(0.00%)#2,791 |
| 55. | Yarmouth Port | 13 | 5,510(0.24%)#55 | 327,258(0.00%)#2,858 |
| 56. | Scituate | 13 | 5,510(0.24%)#56 | 327,258(0.00%)#2,862 |
| 57. | Taunton | 12 | 5,510(0.22%)#57 | 327,258(0.00%)#2,918 |
| 58. | Marlborough | 11 | 5,510(0.20%)#58 | 327,258(0.00%)#3,060 |
| 59. | Amherst | 11 | 5,510(0.20%)#59 | 327,258(0.00%)#3,065 |
| 60. | Reading | 11 | 5,510(0.20%)#60 | 327,258(0.00%)#3,072 |
| 61. | Webster | 11 | 5,510(0.20%)#61 | 327,258(0.00%)#3,096 |
| 62. | Marshfield | 11 | 5,510(0.20%)#62 | 327,258(0.00%)#3,143 |
| 63. | Danvers | 10 | 5,510(0.18%)#63 | 327,258(0.00%)#3,239 |
| 64. | Winthrop Town | 9 | 5,510(0.16%)#64 | 327,258(0.00%)#3,411 |
| 65. | Fitchburg | 8 | 5,510(0.15%)#65 | 327,258(0.00%)#3,549 |
| 66. | Somerset | 8 | 5,510(0.15%)#66 | 327,258(0.00%)#3,587 |
| 67. | Hudson | 8 | 5,510(0.15%)#67 | 327,258(0.00%)#3,598 |
| 68. | Andover | 8 | 5,510(0.15%)#68 | 327,258(0.00%)#3,626 |
| 69. | West Yarmouth | 8 | 5,510(0.15%)#69 | 327,258(0.00%)#3,639 |
| 70. | Belmont | 7 | 5,510(0.13%)#70 | 327,258(0.00%)#3,757 |
| 71. | Gloucester | 6 | 5,510(0.11%)#71 | 327,258(0.00%)#3,943 |
| 72. | Watertown Town | 5 | 5,510(0.09%)#72 | 327,258(0.00%)#4,136 |
| 73. | Beverly | 4 | 5,510(0.07%)#73 | 327,258(0.00%)#4,323 |
| 74. | East Falmouth | 4 | 5,510(0.07%)#74 | 327,258(0.00%)#4,352 |
| 75. | Millers Falls | 4 | 5,510(0.07%)#75 | 327,258(0.00%)#4,460 |
| 76. | Medfield | 1 | 5,510(0.02%)#76 | 327,258(0.00%)#5,143 |
Common Questions
What are the Top 10 Cities with the Largest Belgian Community in Massachusetts?
Top 10 Cities with the Largest Belgian Community in Massachusetts are:
#1
662
#2
292
#3
277
#4
205
#5
153
#6
129
#7
125
#8
125
#9
120
#10
104
What city has the Largest Belgian Community in Massachusetts?
Boston has the Largest Belgian Community in Massachusetts with 662.
What is the Total Belgian Population in the State of Massachusetts?
Total Belgian Population in Massachusetts is 5,510.
What is the Total Belgian Population in the United States?
Total Belgian Population in the United States is 327,258.