Cities with the Largest Belgian Community in Maryland
RELATED REPORTS & OPTIONS
Belgian
Maryland
Compare Cities
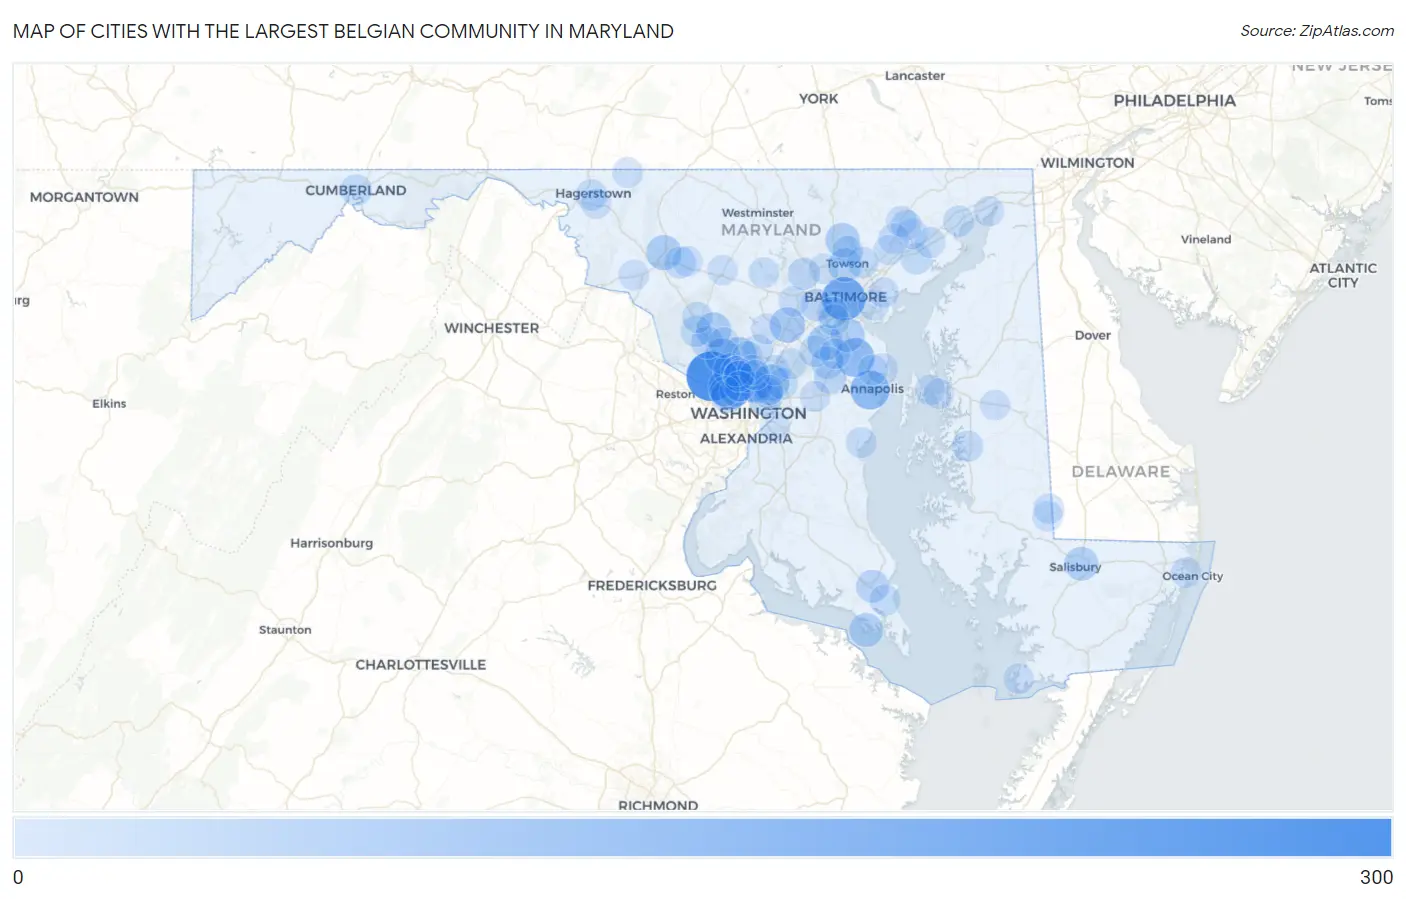
Map of Cities with the Largest Belgian Community in Maryland
0
300
Cities with the Largest Belgian Community in Maryland
| City | Belgian | vs State | vs National | |
| 1. | Potomac | 283 | 3,525(8.03%)#1 | 327,258(0.09%)#104 |
| 2. | Baltimore | 193 | 3,525(5.48%)#2 | 327,258(0.06%)#190 |
| 3. | Bethesda | 189 | 3,525(5.36%)#3 | 327,258(0.06%)#193 |
| 4. | Annapolis | 128 | 3,525(3.63%)#4 | 327,258(0.04%)#322 |
| 5. | Severna Park | 122 | 3,525(3.46%)#5 | 327,258(0.04%)#340 |
| 6. | Silver Spring | 116 | 3,525(3.29%)#6 | 327,258(0.04%)#363 |
| 7. | College Park | 86 | 3,525(2.44%)#7 | 327,258(0.03%)#540 |
| 8. | Aspen Hill | 82 | 3,525(2.33%)#8 | 327,258(0.03%)#569 |
| 9. | Chevy Chase | 77 | 3,525(2.18%)#9 | 327,258(0.02%)#627 |
| 10. | Columbia | 75 | 3,525(2.13%)#10 | 327,258(0.02%)#641 |
| 11. | Rockville | 73 | 3,525(2.07%)#11 | 327,258(0.02%)#662 |
| 12. | Severn | 73 | 3,525(2.07%)#12 | 327,258(0.02%)#663 |
| 13. | Frederick | 69 | 3,525(1.96%)#13 | 327,258(0.02%)#706 |
| 14. | Montgomery Village | 69 | 3,525(1.96%)#14 | 327,258(0.02%)#713 |
| 15. | Cockeysville | 58 | 3,525(1.65%)#15 | 327,258(0.02%)#873 |
| 16. | Glen Burnie | 56 | 3,525(1.59%)#16 | 327,258(0.02%)#905 |
| 17. | Towson | 54 | 3,525(1.53%)#17 | 327,258(0.02%)#945 |
| 18. | Salisbury | 51 | 3,525(1.45%)#18 | 327,258(0.02%)#1,004 |
| 19. | Piney Point | 51 | 3,525(1.45%)#19 | 327,258(0.02%)#1,014 |
| 20. | Mount Rainier | 50 | 3,525(1.42%)#20 | 327,258(0.02%)#1,029 |
| 21. | North Bethesda | 43 | 3,525(1.22%)#21 | 327,258(0.01%)#1,173 |
| 22. | Brookmont | 42 | 3,525(1.19%)#22 | 327,258(0.01%)#1,219 |
| 23. | California | 39 | 3,525(1.11%)#23 | 327,258(0.01%)#1,298 |
| 24. | Gaithersburg | 37 | 3,525(1.05%)#24 | 327,258(0.01%)#1,337 |
| 25. | Odenton | 33 | 3,525(0.94%)#25 | 327,258(0.01%)#1,483 |
| 26. | Takoma Park | 31 | 3,525(0.88%)#26 | 327,258(0.01%)#1,580 |
| 27. | Catonsville | 30 | 3,525(0.85%)#27 | 327,258(0.01%)#1,607 |
| 28. | Crofton | 30 | 3,525(0.85%)#28 | 327,258(0.01%)#1,611 |
| 29. | Randallstown | 29 | 3,525(0.82%)#29 | 327,258(0.01%)#1,658 |
| 30. | Forest Glen | 24 | 3,525(0.68%)#30 | 327,258(0.01%)#1,911 |
| 31. | Spring Ridge | 23 | 3,525(0.65%)#31 | 327,258(0.01%)#1,972 |
| 32. | Fort Meade | 22 | 3,525(0.62%)#32 | 327,258(0.01%)#2,030 |
| 33. | Edgewood | 21 | 3,525(0.60%)#33 | 327,258(0.01%)#2,079 |
| 34. | Carney | 20 | 3,525(0.57%)#34 | 327,258(0.01%)#2,127 |
| 35. | Linthicum | 19 | 3,525(0.54%)#35 | 327,258(0.01%)#2,231 |
| 36. | Germantown | 18 | 3,525(0.51%)#36 | 327,258(0.01%)#2,276 |
| 37. | Hagerstown | 18 | 3,525(0.51%)#37 | 327,258(0.01%)#2,285 |
| 38. | Cumberland | 18 | 3,525(0.51%)#38 | 327,258(0.01%)#2,304 |
| 39. | Easton | 18 | 3,525(0.51%)#39 | 327,258(0.01%)#2,309 |
| 40. | Greenbelt | 17 | 3,525(0.48%)#40 | 327,258(0.01%)#2,392 |
| 41. | Havre De Grace | 17 | 3,525(0.48%)#41 | 327,258(0.01%)#2,402 |
| 42. | Lansdowne | 17 | 3,525(0.48%)#42 | 327,258(0.01%)#2,413 |
| 43. | Clarksburg | 15 | 3,525(0.43%)#43 | 327,258(0.00%)#2,566 |
| 44. | Bel Air South | 14 | 3,525(0.40%)#44 | 327,258(0.00%)#2,658 |
| 45. | Lexington Park | 14 | 3,525(0.40%)#45 | 327,258(0.00%)#2,707 |
| 46. | Cloverly | 13 | 3,525(0.37%)#46 | 327,258(0.00%)#2,816 |
| 47. | Timonium | 13 | 3,525(0.37%)#47 | 327,258(0.00%)#2,836 |
| 48. | South Laurel | 12 | 3,525(0.34%)#48 | 327,258(0.00%)#2,933 |
| 49. | Honeygo | 12 | 3,525(0.34%)#49 | 327,258(0.00%)#2,956 |
| 50. | Cape St Claire | 12 | 3,525(0.34%)#50 | 327,258(0.00%)#2,964 |
| 51. | Bel Air North | 11 | 3,525(0.31%)#51 | 327,258(0.00%)#3,066 |
| 52. | Hyattsville | 11 | 3,525(0.31%)#52 | 327,258(0.00%)#3,079 |
| 53. | Riverside | 11 | 3,525(0.31%)#53 | 327,258(0.00%)#3,135 |
| 54. | Redland | 10 | 3,525(0.28%)#54 | 327,258(0.00%)#3,256 |
| 55. | Bel Air | 10 | 3,525(0.28%)#55 | 327,258(0.00%)#3,278 |
| 56. | South Kensington | 10 | 3,525(0.28%)#56 | 327,258(0.00%)#3,288 |
| 57. | Sykesville | 10 | 3,525(0.28%)#57 | 327,258(0.00%)#3,313 |
| 58. | Pleasant Hills | 10 | 3,525(0.28%)#58 | 327,258(0.00%)#3,321 |
| 59. | Dundalk | 9 | 3,525(0.26%)#59 | 327,258(0.00%)#3,384 |
| 60. | Green Valley | 9 | 3,525(0.26%)#60 | 327,258(0.00%)#3,427 |
| 61. | Deale | 9 | 3,525(0.26%)#61 | 327,258(0.00%)#3,468 |
| 62. | Ellicott City | 8 | 3,525(0.23%)#62 | 327,258(0.00%)#3,544 |
| 63. | Arnold | 8 | 3,525(0.23%)#63 | 327,258(0.00%)#3,570 |
| 64. | West Ocean City | 8 | 3,525(0.23%)#64 | 327,258(0.00%)#3,642 |
| 65. | Kent Narrows | 8 | 3,525(0.23%)#65 | 327,258(0.00%)#3,718 |
| 66. | Bowie | 7 | 3,525(0.20%)#66 | 327,258(0.00%)#3,743 |
| 67. | Grasonville | 7 | 3,525(0.20%)#67 | 327,258(0.00%)#3,842 |
| 68. | Jefferson | 7 | 3,525(0.20%)#68 | 327,258(0.00%)#3,856 |
| 69. | Beltsville | 6 | 3,525(0.17%)#69 | 327,258(0.00%)#3,959 |
| 70. | Linganore | 6 | 3,525(0.17%)#70 | 327,258(0.00%)#3,973 |
| 71. | Mount Airy | 6 | 3,525(0.17%)#71 | 327,258(0.00%)#3,984 |
| 72. | Layhill | 6 | 3,525(0.17%)#72 | 327,258(0.00%)#4,008 |
| 73. | Gambrills | 6 | 3,525(0.17%)#73 | 327,258(0.00%)#4,023 |
| 74. | Kensington | 6 | 3,525(0.17%)#74 | 327,258(0.00%)#4,044 |
| 75. | Chevy Chase View | 6 | 3,525(0.17%)#75 | 327,258(0.00%)#4,079 |
| 76. | Somerset | 6 | 3,525(0.17%)#76 | 327,258(0.00%)#4,085 |
| 77. | Sharptown | 6 | 3,525(0.17%)#77 | 327,258(0.00%)#4,103 |
| 78. | Ringgold | 6 | 3,525(0.17%)#78 | 327,258(0.00%)#4,127 |
| 79. | Crisfield | 5 | 3,525(0.14%)#79 | 327,258(0.00%)#4,209 |
| 80. | Highland | 5 | 3,525(0.14%)#80 | 327,258(0.00%)#4,261 |
| 81. | Funkstown | 5 | 3,525(0.14%)#81 | 327,258(0.00%)#4,268 |
| 82. | Essex | 4 | 3,525(0.11%)#82 | 327,258(0.00%)#4,324 |
| 83. | Kingsville | 4 | 3,525(0.11%)#83 | 327,258(0.00%)#4,357 |
| 84. | University Park | 4 | 3,525(0.11%)#84 | 327,258(0.00%)#4,369 |
| 85. | Charlestown | 4 | 3,525(0.11%)#85 | 327,258(0.00%)#4,388 |
| 86. | Garrett Park | 4 | 3,525(0.11%)#86 | 327,258(0.00%)#4,471 |
| 87. | Queen Anne | 4 | 3,525(0.11%)#87 | 327,258(0.00%)#4,522 |
| 88. | Galestown | 4 | 3,525(0.11%)#88 | 327,258(0.00%)#4,532 |
| 89. | Pikesville | 3 | 3,525(0.09%)#89 | 327,258(0.00%)#4,536 |
| 90. | Kemp Mill | 2 | 3,525(0.06%)#90 | 327,258(0.00%)#4,805 |
| 91. | Chevy Chase Section Five | 2 | 3,525(0.06%)#91 | 327,258(0.00%)#4,934 |
| 92. | Glen Echo | 2 | 3,525(0.06%)#92 | 327,258(0.00%)#5,078 |
| 93. | Suitland | 1 | 3,525(0.03%)#93 | 327,258(0.00%)#5,133 |
| 94. | Four Corners | 1 | 3,525(0.03%)#94 | 327,258(0.00%)#5,141 |
Common Questions
What are the Top 10 Cities with the Largest Belgian Community in Maryland?
Top 10 Cities with the Largest Belgian Community in Maryland are:
#1
283
#2
193
#3
189
#4
128
#5
122
#6
116
#7
86
#8
82
#9
77
#10
75
What city has the Largest Belgian Community in Maryland?
Potomac has the Largest Belgian Community in Maryland with 283.
What is the Total Belgian Population in the State of Maryland?
Total Belgian Population in Maryland is 3,525.
What is the Total Belgian Population in the United States?
Total Belgian Population in the United States is 327,258.