Cities with the Largest Belgian Community in Pennsylvania
RELATED REPORTS & OPTIONS
Belgian
Pennsylvania
Compare Cities
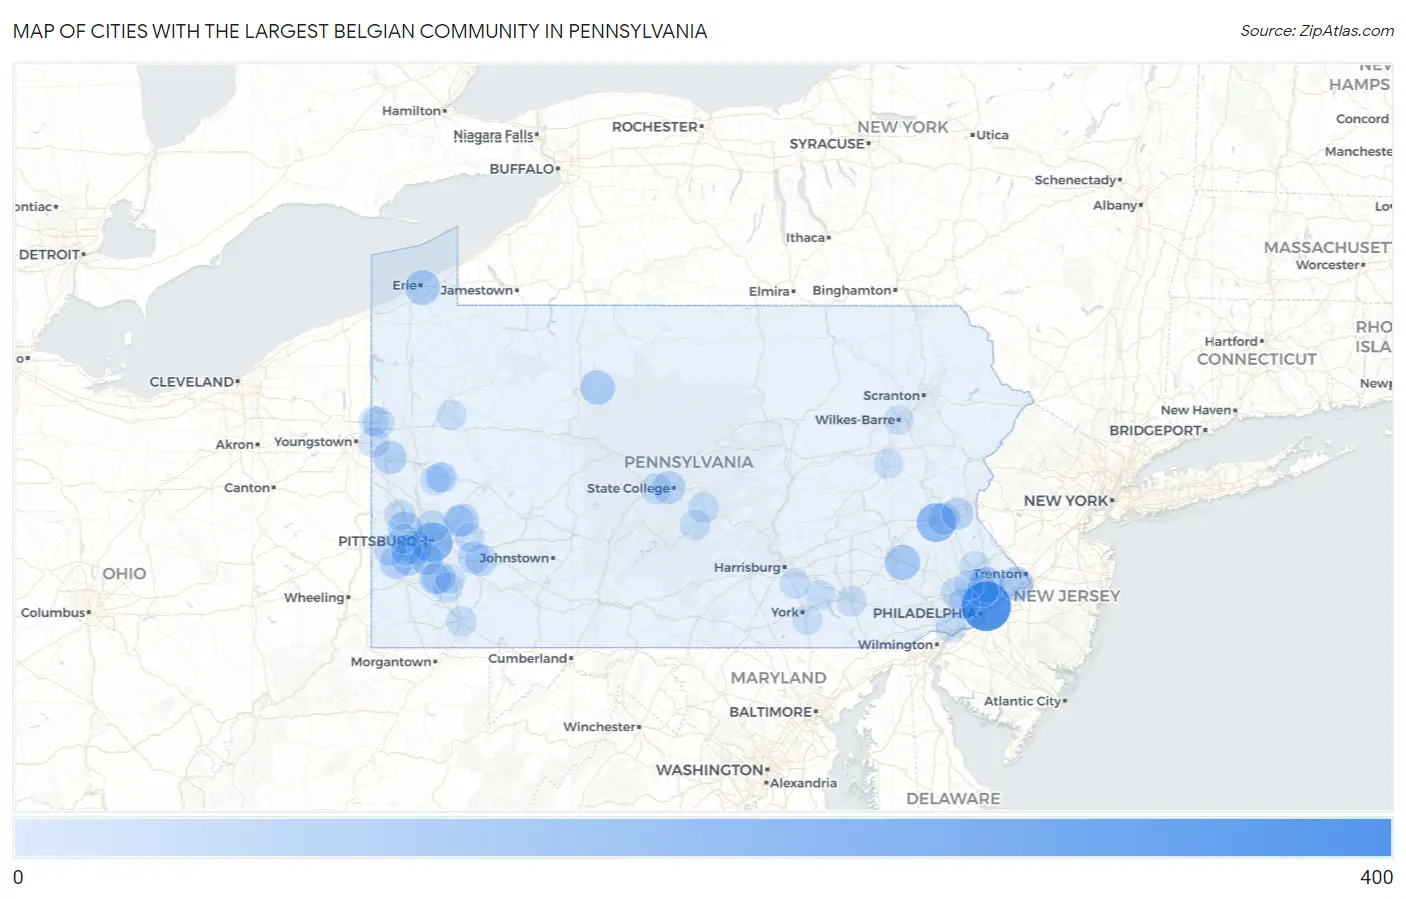
Map of Cities with the Largest Belgian Community in Pennsylvania
0
400
Cities with the Largest Belgian Community in Pennsylvania
| City | Belgian | vs State | vs National | |
| 1. | Philadelphia | 312 | 9,207(3.39%)#1 | 327,258(0.10%)#93 |
| 2. | Pittsburgh | 162 | 9,207(1.76%)#2 | 327,258(0.05%)#239 |
| 3. | Wescosville | 145 | 9,207(1.57%)#3 | 327,258(0.04%)#282 |
| 4. | Mcdonald Borough | 137 | 9,207(1.49%)#4 | 327,258(0.04%)#297 |
| 5. | Willow Grove | 91 | 9,207(0.99%)#5 | 327,258(0.03%)#507 |
| 6. | Lorane | 89 | 9,207(0.97%)#6 | 327,258(0.03%)#523 |
| 7. | Bristol Borough | 87 | 9,207(0.94%)#7 | 327,258(0.03%)#532 |
| 8. | Erie | 82 | 9,207(0.89%)#8 | 327,258(0.03%)#567 |
| 9. | Littlestown Borough | 80 | 9,207(0.87%)#9 | 327,258(0.02%)#596 |
| 10. | St Marys | 77 | 9,207(0.84%)#10 | 327,258(0.02%)#626 |
| 11. | Carnot Moon | 72 | 9,207(0.78%)#11 | 327,258(0.02%)#679 |
| 12. | Mount Carmel Borough | 72 | 9,207(0.78%)#12 | 327,258(0.02%)#683 |
| 13. | Levittown | 69 | 9,207(0.75%)#13 | 327,258(0.02%)#709 |
| 14. | Ephrata Borough | 68 | 9,207(0.74%)#14 | 327,258(0.02%)#730 |
| 15. | Rennerdale | 67 | 9,207(0.73%)#15 | 327,258(0.02%)#749 |
| 16. | Cecil Bishop | 63 | 9,207(0.68%)#16 | 327,258(0.02%)#805 |
| 17. | Cheltenham | 62 | 9,207(0.67%)#17 | 327,258(0.02%)#820 |
| 18. | New Castle | 58 | 9,207(0.63%)#18 | 327,258(0.02%)#875 |
| 19. | Hickory | 53 | 9,207(0.58%)#19 | 327,258(0.02%)#982 |
| 20. | Lower Burrell | 50 | 9,207(0.54%)#20 | 327,258(0.02%)#1,027 |
| 21. | Monongahela | 50 | 9,207(0.54%)#21 | 327,258(0.02%)#1,030 |
| 22. | Bentleyville Borough | 50 | 9,207(0.54%)#22 | 327,258(0.02%)#1,033 |
| 23. | Park Forest Village | 49 | 9,207(0.53%)#23 | 327,258(0.01%)#1,048 |
| 24. | Bethel Park | 48 | 9,207(0.52%)#24 | 327,258(0.01%)#1,060 |
| 25. | Lewistown Borough | 48 | 9,207(0.52%)#25 | 327,258(0.01%)#1,067 |
| 26. | Jeannette | 47 | 9,207(0.51%)#26 | 327,258(0.01%)#1,091 |
| 27. | Allentown | 42 | 9,207(0.46%)#27 | 327,258(0.01%)#1,199 |
| 28. | Bethlehem | 40 | 9,207(0.43%)#28 | 327,258(0.01%)#1,251 |
| 29. | Sinking Spring Borough | 39 | 9,207(0.42%)#29 | 327,258(0.01%)#1,305 |
| 30. | Monaca Borough | 38 | 9,207(0.41%)#30 | 327,258(0.01%)#1,330 |
| 31. | Baidland | 35 | 9,207(0.38%)#31 | 327,258(0.01%)#1,435 |
| 32. | Greensburg | 34 | 9,207(0.37%)#32 | 327,258(0.01%)#1,455 |
| 33. | Glenshaw | 34 | 9,207(0.37%)#33 | 327,258(0.01%)#1,462 |
| 34. | New Kensington | 33 | 9,207(0.36%)#34 | 327,258(0.01%)#1,499 |
| 35. | Joffre | 33 | 9,207(0.36%)#35 | 327,258(0.01%)#1,516 |
| 36. | Canonsburg Borough | 32 | 9,207(0.35%)#36 | 327,258(0.01%)#1,541 |
| 37. | Glenside | 32 | 9,207(0.35%)#37 | 327,258(0.01%)#1,545 |
| 38. | Bryn Mawr | 32 | 9,207(0.35%)#38 | 327,258(0.01%)#1,552 |
| 39. | Hermitage | 30 | 9,207(0.33%)#39 | 327,258(0.01%)#1,624 |
| 40. | Marietta Borough | 30 | 9,207(0.33%)#40 | 327,258(0.01%)#1,639 |
| 41. | Roots | 30 | 9,207(0.33%)#41 | 327,258(0.01%)#1,647 |
| 42. | Wyomissing Borough | 28 | 9,207(0.30%)#42 | 327,258(0.01%)#1,709 |
| 43. | New Cumberland Borough | 28 | 9,207(0.30%)#43 | 327,258(0.01%)#1,713 |
| 44. | Carlisle Borough | 27 | 9,207(0.29%)#44 | 327,258(0.01%)#1,732 |
| 45. | Kennett Square Borough | 27 | 9,207(0.29%)#45 | 327,258(0.01%)#1,751 |
| 46. | Jonestown Borough | 27 | 9,207(0.29%)#46 | 327,258(0.01%)#1,757 |
| 47. | King Of Prussia | 25 | 9,207(0.27%)#47 | 327,258(0.01%)#1,833 |
| 48. | Aliquippa | 25 | 9,207(0.27%)#48 | 327,258(0.01%)#1,850 |
| 49. | Brackenridge Borough | 25 | 9,207(0.27%)#49 | 327,258(0.01%)#1,858 |
| 50. | Stormstown | 25 | 9,207(0.27%)#50 | 327,258(0.01%)#1,860 |
| 51. | Sturgeon | 24 | 9,207(0.26%)#51 | 327,258(0.01%)#1,927 |
| 52. | Uniontown | 22 | 9,207(0.24%)#52 | 327,258(0.01%)#2,032 |
| 53. | Village Green Green Ridge | 21 | 9,207(0.23%)#53 | 327,258(0.01%)#2,097 |
| 54. | Churchill Borough | 21 | 9,207(0.23%)#54 | 327,258(0.01%)#2,113 |
| 55. | Midway Borough | 21 | 9,207(0.23%)#55 | 327,258(0.01%)#2,116 |
| 56. | New Bedford | 21 | 9,207(0.23%)#56 | 327,258(0.01%)#2,117 |
| 57. | Reedsville | 21 | 9,207(0.23%)#57 | 327,258(0.01%)#2,118 |
| 58. | Elizabethtown Borough | 20 | 9,207(0.22%)#58 | 327,258(0.01%)#2,147 |
| 59. | West Mifflin Borough | 19 | 9,207(0.21%)#59 | 327,258(0.01%)#2,216 |
| 60. | Oakmont Borough | 19 | 9,207(0.21%)#60 | 327,258(0.01%)#2,240 |
| 61. | Brittany Farms The Highlands | 19 | 9,207(0.21%)#61 | 327,258(0.01%)#2,252 |
| 62. | Masontown Borough | 19 | 9,207(0.21%)#62 | 327,258(0.01%)#2,259 |
| 63. | Mont Clare | 19 | 9,207(0.21%)#63 | 327,258(0.01%)#2,266 |
| 64. | Sylvan Hills | 19 | 9,207(0.21%)#64 | 327,258(0.01%)#2,274 |
| 65. | Lancaster | 18 | 9,207(0.20%)#65 | 327,258(0.01%)#2,279 |
| 66. | Prospect Park Borough | 18 | 9,207(0.20%)#66 | 327,258(0.01%)#2,332 |
| 67. | Lynnwood Pricedale | 18 | 9,207(0.20%)#67 | 327,258(0.01%)#2,347 |
| 68. | Strodes Mills | 18 | 9,207(0.20%)#68 | 327,258(0.01%)#2,351 |
| 69. | Kane Borough | 17 | 9,207(0.18%)#69 | 327,258(0.01%)#2,426 |
| 70. | Butler | 16 | 9,207(0.17%)#70 | 327,258(0.00%)#2,485 |
| 71. | Maytown | 16 | 9,207(0.17%)#71 | 327,258(0.00%)#2,526 |
| 72. | Somerset Borough | 15 | 9,207(0.16%)#72 | 327,258(0.00%)#2,614 |
| 73. | Kittanning Borough | 15 | 9,207(0.16%)#73 | 327,258(0.00%)#2,622 |
| 74. | Valley Green | 14 | 9,207(0.15%)#74 | 327,258(0.00%)#2,744 |
| 75. | Manchester Borough | 14 | 9,207(0.15%)#75 | 327,258(0.00%)#2,745 |
| 76. | Watsontown Borough | 14 | 9,207(0.15%)#76 | 327,258(0.00%)#2,762 |
| 77. | Freeport Borough | 14 | 9,207(0.15%)#77 | 327,258(0.00%)#2,766 |
| 78. | Kennerdell | 14 | 9,207(0.15%)#78 | 327,258(0.00%)#2,781 |
| 79. | State College Borough | 13 | 9,207(0.14%)#79 | 327,258(0.00%)#2,793 |
| 80. | Franklin Park Borough | 13 | 9,207(0.14%)#80 | 327,258(0.00%)#2,822 |
| 81. | Sharon | 13 | 9,207(0.14%)#81 | 327,258(0.00%)#2,829 |
| 82. | Crafton Borough | 13 | 9,207(0.14%)#82 | 327,258(0.00%)#2,857 |
| 83. | Spry | 13 | 9,207(0.14%)#83 | 327,258(0.00%)#2,868 |
| 84. | Meridian | 13 | 9,207(0.14%)#84 | 327,258(0.00%)#2,876 |
| 85. | Bell Acres Borough | 13 | 9,207(0.14%)#85 | 327,258(0.00%)#2,893 |
| 86. | Chadds Ford | 13 | 9,207(0.14%)#86 | 327,258(0.00%)#2,897 |
| 87. | Twilight Borough | 13 | 9,207(0.14%)#87 | 327,258(0.00%)#2,910 |
| 88. | Wilkes Barre | 12 | 9,207(0.13%)#88 | 327,258(0.00%)#2,923 |
| 89. | Downingtown Borough | 12 | 9,207(0.13%)#89 | 327,258(0.00%)#2,973 |
| 90. | Smethport Borough | 12 | 9,207(0.13%)#90 | 327,258(0.00%)#3,025 |
| 91. | Murrysville | 11 | 9,207(0.12%)#91 | 327,258(0.00%)#3,080 |
| 92. | Indiana Borough | 11 | 9,207(0.12%)#92 | 327,258(0.00%)#3,090 |
| 93. | Homeacre Lyndora | 11 | 9,207(0.12%)#93 | 327,258(0.00%)#3,125 |
| 94. | Blue Bell | 11 | 9,207(0.12%)#94 | 327,258(0.00%)#3,128 |
| 95. | Donora Borough | 11 | 9,207(0.12%)#95 | 327,258(0.00%)#3,147 |
| 96. | Aspinwall Borough | 11 | 9,207(0.12%)#96 | 327,258(0.00%)#3,162 |
| 97. | Enlow | 11 | 9,207(0.12%)#97 | 327,258(0.00%)#3,199 |
| 98. | Fellsburg | 11 | 9,207(0.12%)#98 | 327,258(0.00%)#3,201 |
| 99. | Ford Cliff Borough | 11 | 9,207(0.12%)#99 | 327,258(0.00%)#3,221 |
| 100. | Hazleton | 10 | 9,207(0.11%)#100 | 327,258(0.00%)#3,238 |
Common Questions
What are the Top 10 Cities with the Largest Belgian Community in Pennsylvania?
Top 10 Cities with the Largest Belgian Community in Pennsylvania are:
#1
312
#2
162
#3
145
#4
91
#5
89
#6
82
#7
77
#8
72
#9
69
#10
67
What city has the Largest Belgian Community in Pennsylvania?
Philadelphia has the Largest Belgian Community in Pennsylvania with 312.
What is the Total Belgian Population in the State of Pennsylvania?
Total Belgian Population in Pennsylvania is 9,207.
What is the Total Belgian Population in the United States?
Total Belgian Population in the United States is 327,258.