Cities with the Highest Percentage of Turkish Population in Massachusetts

RELATED REPORTS & OPTIONS

Turkish
Population
Families and Households
Female Fertility
Female Fertility (Unmarried)
Race (Community Size)
Race (Percentage)
Ancestry (Community Size)
AfghanAfricanAlaska NativeAlaskan AthabascanAlbanianAleutAlsatianAmericanApacheArabArapahoArgentineanArmenianAssyrian / Chaldean / SyriacAustralianAustrianBahamianBangladeshiBarbadianBasqueBelgianBelizeanBermudanBhutaneseBlackfeetBolivianBrazilianBritishBritish West IndianBulgarianBurmeseCajunCambodianCanadianCape VerdeanCarpatho RusynCelticCentral AmericanCentral American IndianCherokeeCheyenneChickasawChileanChineseChippewaChoctawColombianColvilleComancheCosta RicanCreeCreekCroatianCrowCubanCypriotCzechCzechoslovakianDanishDelawareDominicanDutchDutch West IndianEastern EuropeanEcuadorianEgyptianEnglishEstonianEthiopianEuropeanFijianFilipinoFinnishFrenchFrench American IndianFrench CanadianGermanGerman RussianGhanaianGreekGuamanian / ChamorroGuatemalanGuyaneseHaitianHmongHonduranHopiHoumaHungarianIcelanderIndian (Asian)IndonesianInupiatIranianIraqiIrishIroquoisIsraeliItalianJamaicanJapaneseJordanianKenyanKiowaKoreanLaotianLatvianLebaneseLiberianLithuanianLumbeeLuxembourgerMacedonianMalaysianMalteseMarshalleseMenomineeMexicanMexican American IndianMongolianMoroccanNative HawaiianNavajoNepaleseNew ZealanderNicaraguanNigerianNorthern EuropeanNorwegianOkinawanOsageOttawaPaiutePakistaniPalestinianPanamanianParaguayanPennsylvania GermanPeruvianPimaPolishPortuguesePotawatomiPuebloPuerto RicanPuget Sound SalishRomanianRussianSalvadoranSamoanScandinavianScotch-IrishScottishSeminoleSenegaleseSerbianShoshoneSierra LeoneanSiouxSlavicSlovakSloveneSomaliSouth AfricanSouth AmericanSouth American IndianSoviet UnionSpaniardSpanishSpanish AmericanSpanish American IndianSri LankanSubsaharan AfricanSudaneseSwedishSwissSyrianTaiwaneseThaiTlingit-HaidaTohono O'OdhamTonganTrinidadian and TobagonianTsimshianTurkishU.S. Virgin IslanderUgandanUkrainianUruguayanUteVenezuelanVietnameseWelshWest IndianYakamaYaquiYugoslavianYumanYup'ikZimbabwean
Ancestry (Percentage)
AfghanAfricanAlaska NativeAlaskan AthabascanAlbanianAleutAlsatianAmericanApacheArabArapahoArgentineanArmenianAssyrian / Chaldean / SyriacAustralianAustrianBahamianBangladeshiBarbadianBasqueBelgianBelizeanBermudanBhutaneseBlackfeetBolivianBrazilianBritishBritish West IndianBulgarianBurmeseCajunCambodianCanadianCape VerdeanCarpatho RusynCelticCentral AmericanCentral American IndianCherokeeCheyenneChickasawChileanChineseChippewaChoctawColombianColvilleComancheCosta RicanCreeCreekCroatianCrowCubanCypriotCzechCzechoslovakianDanishDelawareDominicanDutchDutch West IndianEastern EuropeanEcuadorianEgyptianEnglishEstonianEthiopianEuropeanFijianFilipinoFinnishFrenchFrench American IndianFrench CanadianGermanGerman RussianGhanaianGreekGuamanian / ChamorroGuatemalanGuyaneseHaitianHmongHonduranHopiHoumaHungarianIcelanderIndian (Asian)IndonesianInupiatIranianIraqiIrishIroquoisIsraeliItalianJamaicanJapaneseJordanianKenyanKiowaKoreanLaotianLatvianLebaneseLiberianLithuanianLumbeeLuxembourgerMacedonianMalaysianMalteseMarshalleseMenomineeMexicanMexican American IndianMongolianMoroccanNative HawaiianNavajoNepaleseNew ZealanderNicaraguanNigerianNorthern EuropeanNorwegianOkinawanOsageOttawaPaiutePakistaniPalestinianPanamanianParaguayanPennsylvania GermanPeruvianPimaPolishPortuguesePotawatomiPuebloPuerto RicanPuget Sound SalishRomanianRussianSalvadoranSamoanScandinavianScotch-IrishScottishSeminoleSenegaleseSerbianShoshoneSierra LeoneanSiouxSlavicSlovakSloveneSomaliSouth AfricanSouth AmericanSouth American IndianSoviet UnionSpaniardSpanishSpanish AmericanSpanish American IndianSri LankanSubsaharan AfricanSudaneseSwedishSwissSyrianTaiwaneseThaiTlingit-HaidaTohono O'OdhamTonganTrinidadian and TobagonianTsimshianTurkishU.S. Virgin IslanderUgandanUkrainianUruguayanUteVenezuelanVietnameseWelshWest IndianYakamaYaquiYugoslavianYumanYup'ikZimbabwean
Immigrant Origin (Total)
AfghanistanAfricaAlbaniaArgentinaArmeniaAsiaAustraliaAustriaAzoresBahamasBangladeshBarbadosBelarusBelgiumBelizeBoliviaBosnia and HerzegovinaBrazilBulgariaBurma / MyanmarCabo VerdeCambodiaCameroonCanadaCaribbeanCentral AmericaChileChinaColombiaCongoCosta RicaCroatiaCubaCzechoslovakiaDenmarkDominicaDominican RepublicEastern AfricaEastern AsiaEastern EuropeEcuadorEgyptEl SalvadorEnglandEritreaEthiopiaEuropeFijiFranceGermanyGhanaGreeceGrenadaGuatemalaGuyanaHaitiHondurasHong KongHungaryIndiaIndonesiaIranIraqIrelandIsraelItalyJamaicaJapanJordanKazakhstanKenyaKoreaKuwaitLaosLatin AmericaLatviaLebanonLiberiaLithuaniaMalaysiaMexicoMicronesiaMiddle AfricaMoldovaMoroccoNepalNetherlandsNicaraguaNigeriaNorth MacedoniaNorthern AfricaNorthern EuropeNorwayOceaniaPakistanPanamaPeruPhilippinesPolandPortugalRomaniaRussiaSaudi ArabiaScotlandSenegalSerbiaSierra LeoneSingaporeSomaliaSouth AfricaSouth AmericaSouth Central AsiaSouth Eastern AsiaSouthern EuropeSpainSri LankaSt. Vincent and the GrenadinesSudanSwedenSwitzerlandSyriaTaiwanThailandTrinidad and TobagoTurkeyUgandaUkraineUruguayUzbekistanVenezuelaVietnamWest IndiesWestern AfricaWestern AsiaWestern EuropeYemenZaireZimbabwe
Immigrant Origin (Percentage)
AfghanistanAfricaAlbaniaArgentinaArmeniaAsiaAustraliaAustriaAzoresBahamasBangladeshBarbadosBelarusBelgiumBelizeBoliviaBosnia and HerzegovinaBrazilBulgariaBurma / MyanmarCabo VerdeCambodiaCameroonCanadaCaribbeanCentral AmericaChileChinaColombiaCongoCosta RicaCroatiaCubaCzechoslovakiaDenmarkDominicaDominican RepublicEastern AfricaEastern AsiaEastern EuropeEcuadorEgyptEl SalvadorEnglandEritreaEthiopiaEuropeFijiFranceGermanyGhanaGreeceGrenadaGuatemalaGuyanaHaitiHondurasHong KongHungaryIndiaIndonesiaIranIraqIrelandIsraelItalyJamaicaJapanJordanKazakhstanKenyaKoreaKuwaitLaosLatin AmericaLatviaLebanonLiberiaLithuaniaMalaysiaMexicoMicronesiaMiddle AfricaMoldovaMoroccoNepalNetherlandsNicaraguaNigeriaNorth MacedoniaNorthern AfricaNorthern EuropeNorwayOceaniaPakistanPanamaPeruPhilippinesPolandPortugalRomaniaRussiaSaudi ArabiaScotlandSenegalSerbiaSierra LeoneSingaporeSomaliaSouth AfricaSouth AmericaSouth Central AsiaSouth Eastern AsiaSouthern EuropeSpainSri LankaSt. Vincent and the GrenadinesSudanSwedenSwitzerlandSyriaTaiwanThailandTrinidad and TobagoTurkeyUgandaUkraineUruguayUzbekistanVenezuelaVietnamWest IndiesWestern AfricaWestern AsiaWestern EuropeYemenZaireZimbabwe
Income
Income (Families)
Income (Households)
Poverty
Poverty (Families)
Unemployment
Employment Occupations
Employment Industries
Employer Class
Commute Time
Commute Means
School Enrollment
Education by Degree Field
Occupancy
Finances
Physical Characteristics
Massachusetts
Compare Cities
Comparison Subject

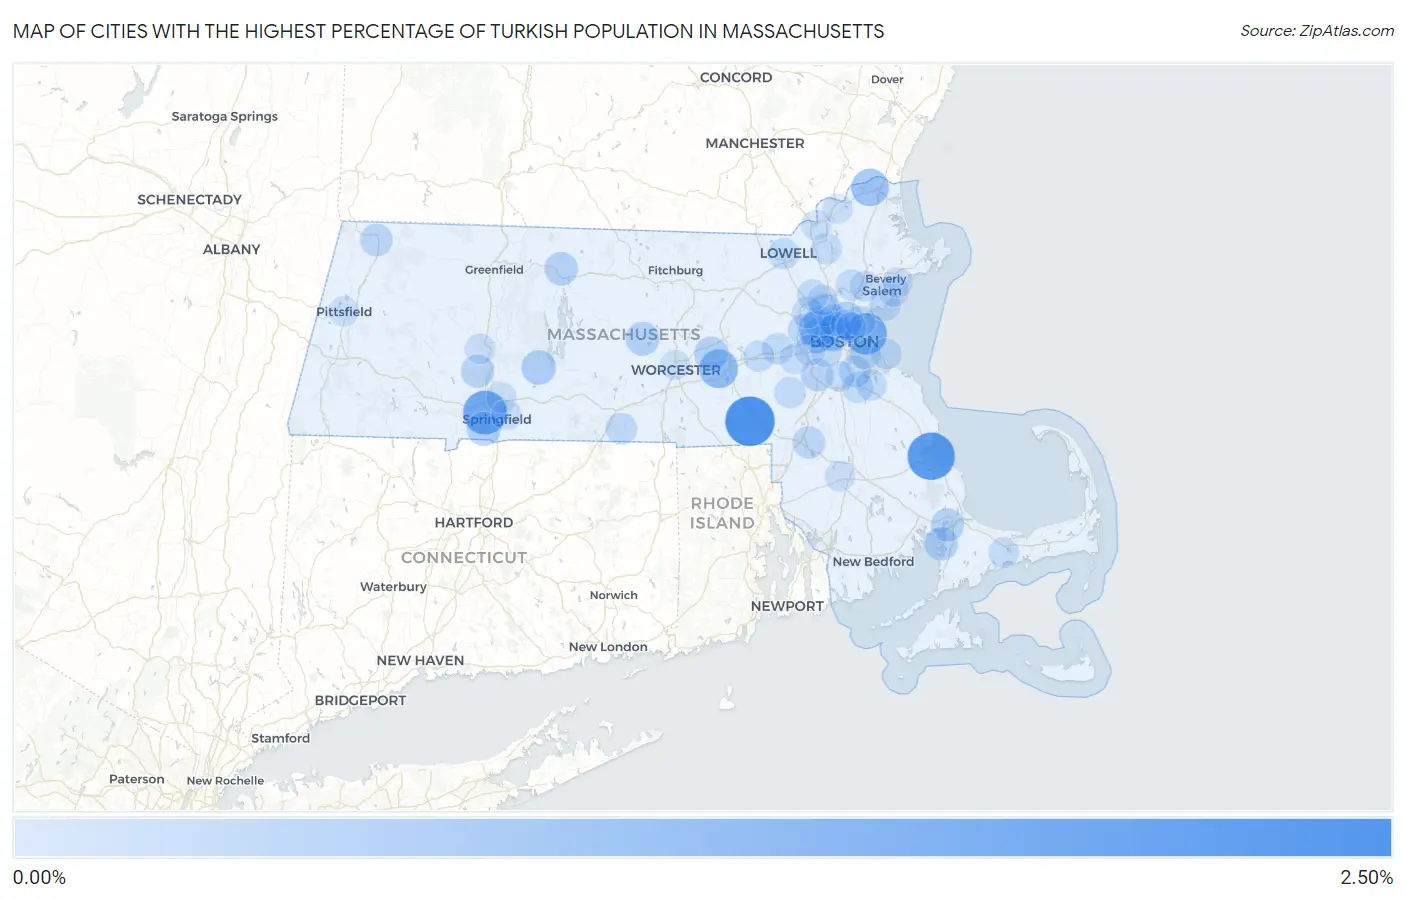
Map of Cities with the Highest Percentage of Turkish Population in Massachusetts

0.00%
2.50%
Cities with the Highest Percentage of Turkish Population in Massachusetts Map

Cities with the Highest Percentage of Turkish Population in Massachusetts

City Turkish vs State vs National
1.Bellingham2.22%0.11%(+2.11)#10.071%(+2.15)#54
2.North Plymouth1.97%0.11%(+1.86)#20.071%(+1.90)#66
3.West Springfield Town1.55%0.11%(+1.44)#30.071%(+1.48)#105
4.Winthrop Town1.29%0.11%(+1.18)#40.071%(+1.22)#137
5.Westborough0.96%0.11%(+0.847)#50.071%(+0.888)#214
6.Amesbury Town0.82%0.11%(+0.704)#60.071%(+0.745)#258
7.Belmont0.75%0.11%(+0.637)#70.071%(+0.677)#291
8.Cambridge0.60%0.11%(+0.483)#80.071%(+0.524)#389
9.Belchertown0.49%0.11%(+0.379)#90.071%(+0.420)#467
10.Malden0.48%0.11%(+0.363)#100.071%(+0.404)#484
11.Agawam Town0.44%0.11%(+0.325)#110.071%(+0.366)#542
12.Watertown Town0.43%0.11%(+0.323)#120.071%(+0.364)#544
13.Northborough0.43%0.11%(+0.323)#130.071%(+0.364)#546
14.Rutland0.41%0.11%(+0.302)#140.071%(+0.343)#569
15.Pocasset0.38%0.11%(+0.269)#150.071%(+0.310)#623
16.Orange0.38%0.11%(+0.264)#160.071%(+0.304)#632
17.Somerville0.37%0.11%(+0.262)#170.071%(+0.303)#633
18.Buzzards Bay0.33%0.11%(+0.222)#180.071%(+0.263)#692
19.Easthampton Town0.32%0.11%(+0.211)#190.071%(+0.252)#718
20.Dedham0.29%0.11%(+0.179)#200.071%(+0.219)#783
21.Mansfield Center0.29%0.11%(+0.174)#210.071%(+0.215)#793
22.Winchester0.28%0.11%(+0.173)#220.071%(+0.214)#795
23.North Adams0.28%0.11%(+0.167)#230.071%(+0.208)#807
24.Arlington0.24%0.11%(+0.126)#240.071%(+0.167)#900
25.Waltham0.20%0.11%(+0.088)#250.071%(+0.129)#1,028
26.Quincy0.20%0.11%(+0.086)#260.071%(+0.127)#1,033
27.Medford0.19%0.11%(+0.081)#270.071%(+0.122)#1,051
28.Swampscott0.19%0.11%(+0.073)#280.071%(+0.114)#1,087
29.Southbridge Town0.18%0.11%(+0.069)#290.071%(+0.110)#1,102
30.Brookline0.18%0.11%(+0.064)#300.071%(+0.105)#1,125
31.Boston0.17%0.11%(+0.058)#310.071%(+0.099)#1,154
32.Medfield0.16%0.11%(+0.047)#320.071%(+0.088)#1,207
33.Amherst0.16%0.11%(+0.044)#330.071%(+0.085)#1,217
34.Lexington0.15%0.11%(+0.040)#340.071%(+0.081)#1,237
35.Cochituate0.14%0.11%(+0.032)#350.071%(+0.073)#1,279
36.Lowell0.14%0.11%(+0.029)#360.071%(+0.070)#1,291
37.North Attleborough0.13%0.11%(+0.018)#370.071%(+0.059)#1,336
38.Burlington0.13%0.11%(+0.018)#380.071%(+0.059)#1,338
39.Revere0.12%0.11%(+0.012)#390.071%(+0.053)#1,372
40.Framingham0.12%0.11%(+0.009)#400.071%(+0.050)#1,383
41.Andover0.12%0.11%(+0.005)#410.071%(+0.046)#1,410
42.Braintree Town0.11%0.11%(-0.003)#420.071%(+0.038)#1,465
43.Lynnfield0.11%0.11%(-0.003)#430.071%(+0.038)#1,466
44.Weymouth Town0.11%0.11%(-0.005)#440.071%(+0.036)#1,478
45.Hull0.099%0.11%(-0.013)#450.071%(+0.028)#1,514
46.Newton0.085%0.11%(-0.027)#460.071%(+0.014)#1,616
47.Barnstable Town0.084%0.11%(-0.028)#470.071%(+0.013)#1,622
48.Wellesley0.084%0.11%(-0.028)#480.071%(+0.013)#1,623
49.Salem0.083%0.11%(-0.029)#490.071%(+0.012)#1,633
50.Peabody0.077%0.11%(-0.034)#500.071%(+0.007)#1,680
51.Everett0.074%0.11%(-0.038)#510.071%(+0.003)#1,708
52.Woburn0.073%0.11%(-0.039)#520.071%(+0.002)#1,721
53.Taunton0.059%0.11%(-0.053)#530.071%(-0.012)#1,843
54.Chelsea0.055%0.11%(-0.057)#540.071%(-0.016)#1,872
55.Beverly0.047%0.11%(-0.065)#550.071%(-0.024)#1,938
56.Northampton0.042%0.11%(-0.069)#560.071%(-0.028)#1,989
57.Methuen Town0.040%0.11%(-0.072)#570.071%(-0.031)#2,019
58.Chicopee0.040%0.11%(-0.072)#580.071%(-0.031)#2,020
59.Springfield0.036%0.11%(-0.076)#590.071%(-0.035)#2,062
60.Pittsfield0.025%0.11%(-0.087)#600.071%(-0.046)#2,175
61.Worcester0.022%0.11%(-0.090)#610.071%(-0.049)#2,231
62.Milton0.018%0.11%(-0.094)#620.071%(-0.053)#2,283
63.Haverhill0.012%0.11%(-0.100)#630.071%(-0.059)#2,344

Common Questions

What are the Top 10 Cities with the Highest Percentage of Turkish Population in Massachusetts?
Top 10 Cities with the Highest Percentage of Turkish Population in Massachusetts are:
What city has the Highest Percentage of Turkish Population in Massachusetts?
Bellingham has the Highest Percentage of Turkish Population in Massachusetts with 2.22%.
What is the Percentage of Turkish Population in the State of Massachusetts?
Percentage of Turkish Population in Massachusetts is 0.11%.
What is the Percentage of Turkish Population in the United States?
Percentage of Turkish Population in the United States is 0.071%.