Cities with the Highest Percentage of Turkish Population in Ohio
RELATED REPORTS & OPTIONS
Turkish
Ohio
Compare Cities
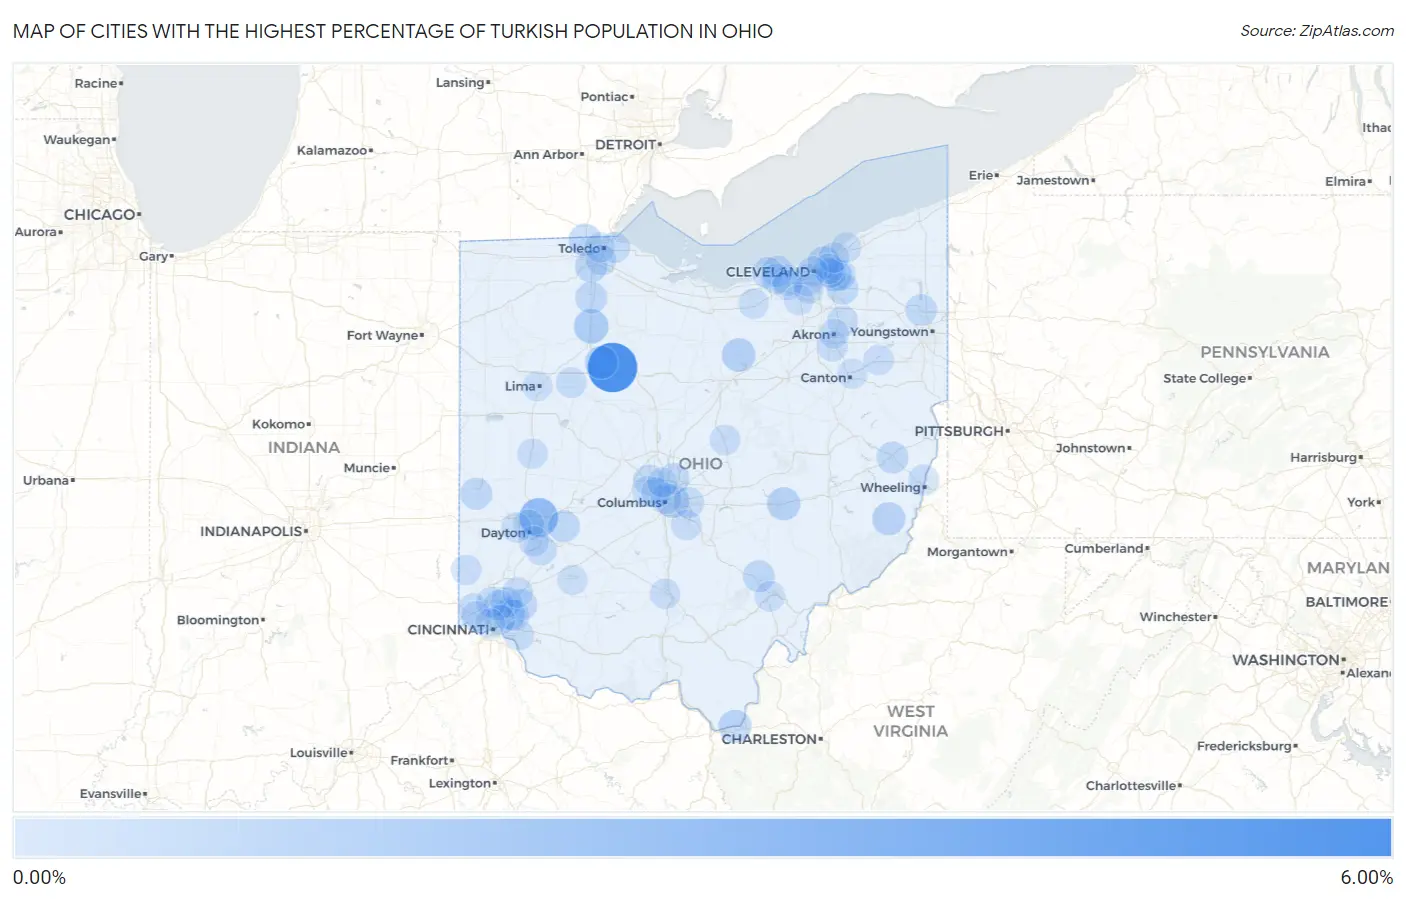
Map of Cities with the Highest Percentage of Turkish Population in Ohio
0.00%
6.00%
Cities with the Highest Percentage of Turkish Population in Ohio
| City | Turkish | vs State | vs National | |
| 1. | Wharton | 5.51% | 0.048%(+5.46)#1 | 0.071%(+5.44)#8 |
| 2. | Huber Heights | 2.37% | 0.048%(+2.32)#2 | 0.071%(+2.30)#47 |
| 3. | Van Buren | 1.20% | 0.048%(+1.16)#3 | 0.071%(+1.13)#151 |
| 4. | Bailey Lakes | 0.91% | 0.048%(+0.859)#4 | 0.071%(+0.836)#225 |
| 5. | Bexley | 0.87% | 0.048%(+0.824)#5 | 0.071%(+0.801)#241 |
| 6. | Pleasant Grove | 0.84% | 0.048%(+0.792)#6 | 0.071%(+0.769)#249 |
| 7. | Mount Blanchard | 0.77% | 0.048%(+0.723)#7 | 0.071%(+0.700)#282 |
| 8. | Beallsville | 0.77% | 0.048%(+0.718)#8 | 0.071%(+0.695)#285 |
| 9. | Beachwood | 0.74% | 0.048%(+0.689)#9 | 0.071%(+0.666)#300 |
| 10. | Proctorville | 0.72% | 0.048%(+0.669)#10 | 0.071%(+0.646)#308 |
| 11. | Sylvania | 0.66% | 0.048%(+0.614)#11 | 0.071%(+0.591)#340 |
| 12. | Bratenahl | 0.63% | 0.048%(+0.585)#12 | 0.071%(+0.562)#358 |
| 13. | Perrysburg | 0.60% | 0.048%(+0.556)#13 | 0.071%(+0.533)#382 |
| 14. | Kenwood | 0.57% | 0.048%(+0.520)#14 | 0.071%(+0.496)#410 |
| 15. | Buchtel | 0.49% | 0.048%(+0.439)#15 | 0.071%(+0.416)#473 |
| 16. | Wayne Lakes | 0.48% | 0.048%(+0.436)#16 | 0.071%(+0.413)#477 |
| 17. | Yellow Springs | 0.48% | 0.048%(+0.434)#17 | 0.071%(+0.411)#478 |
| 18. | Loveland | 0.48% | 0.048%(+0.428)#18 | 0.071%(+0.405)#482 |
| 19. | Cadiz | 0.46% | 0.048%(+0.408)#19 | 0.071%(+0.385)#509 |
| 20. | Portage | 0.45% | 0.048%(+0.402)#20 | 0.071%(+0.379)#523 |
| 21. | Brooklyn | 0.44% | 0.048%(+0.388)#21 | 0.071%(+0.364)#543 |
| 22. | Solon | 0.40% | 0.048%(+0.352)#22 | 0.071%(+0.328)#598 |
| 23. | Howland Center | 0.38% | 0.048%(+0.335)#23 | 0.071%(+0.312)#620 |
| 24. | Pepper Pike | 0.37% | 0.048%(+0.321)#24 | 0.071%(+0.298)#644 |
| 25. | Avon Lake | 0.34% | 0.048%(+0.297)#25 | 0.071%(+0.274)#680 |
| 26. | Westerville | 0.33% | 0.048%(+0.279)#26 | 0.071%(+0.256)#707 |
| 27. | Sheffield Lake | 0.31% | 0.048%(+0.265)#27 | 0.071%(+0.242)#737 |
| 28. | Dublin | 0.25% | 0.048%(+0.200)#28 | 0.071%(+0.177)#882 |
| 29. | Sharonville | 0.24% | 0.048%(+0.188)#29 | 0.071%(+0.165)#908 |
| 30. | The Village Of Indian Hill | 0.23% | 0.048%(+0.184)#30 | 0.071%(+0.161)#928 |
| 31. | Dayton | 0.21% | 0.048%(+0.167)#31 | 0.071%(+0.144)#976 |
| 32. | Martins Ferry | 0.21% | 0.048%(+0.159)#32 | 0.071%(+0.136)#996 |
| 33. | Westlake | 0.21% | 0.048%(+0.158)#33 | 0.071%(+0.135)#1,003 |
| 34. | Bellbrook | 0.18% | 0.048%(+0.130)#34 | 0.071%(+0.107)#1,117 |
| 35. | Taylor Creek | 0.18% | 0.048%(+0.128)#35 | 0.071%(+0.105)#1,124 |
| 36. | Reynoldsburg | 0.17% | 0.048%(+0.119)#36 | 0.071%(+0.095)#1,173 |
| 37. | Hilliard | 0.16% | 0.048%(+0.113)#37 | 0.071%(+0.090)#1,191 |
| 38. | Ada | 0.16% | 0.048%(+0.110)#38 | 0.071%(+0.086)#1,212 |
| 39. | Oregon | 0.16% | 0.048%(+0.108)#39 | 0.071%(+0.085)#1,215 |
| 40. | Portage Lakes | 0.16% | 0.048%(+0.108)#40 | 0.071%(+0.085)#1,218 |
| 41. | Withamsville | 0.15% | 0.048%(+0.106)#41 | 0.071%(+0.083)#1,224 |
| 42. | Forest Park | 0.15% | 0.048%(+0.102)#42 | 0.071%(+0.079)#1,249 |
| 43. | Stow | 0.15% | 0.048%(+0.098)#43 | 0.071%(+0.074)#1,272 |
| 44. | Glendale | 0.14% | 0.048%(+0.092)#44 | 0.071%(+0.069)#1,299 |
| 45. | University Heights | 0.13% | 0.048%(+0.084)#45 | 0.071%(+0.061)#1,330 |
| 46. | Mount Vernon | 0.12% | 0.048%(+0.077)#46 | 0.071%(+0.054)#1,364 |
| 47. | Mason | 0.12% | 0.048%(+0.067)#47 | 0.071%(+0.044)#1,421 |
| 48. | Euclid | 0.11% | 0.048%(+0.062)#48 | 0.071%(+0.039)#1,456 |
| 49. | Columbus | 0.095% | 0.048%(+0.048)#49 | 0.071%(+0.025)#1,549 |
| 50. | Upper Arlington | 0.093% | 0.048%(+0.046)#50 | 0.071%(+0.022)#1,565 |
| 51. | Oxford | 0.086% | 0.048%(+0.039)#51 | 0.071%(+0.015)#1,604 |
| 52. | Athens | 0.084% | 0.048%(+0.036)#52 | 0.071%(+0.013)#1,625 |
| 53. | Lithopolis | 0.083% | 0.048%(+0.036)#53 | 0.071%(+0.013)#1,629 |
| 54. | Dent | 0.077% | 0.048%(+0.030)#54 | 0.071%(+0.006)#1,684 |
| 55. | Avon | 0.077% | 0.048%(+0.029)#55 | 0.071%(+0.006)#1,689 |
| 56. | Kettering | 0.075% | 0.048%(+0.027)#56 | 0.071%(+0.004)#1,700 |
| 57. | Alliance | 0.074% | 0.048%(+0.027)#57 | 0.071%(+0.003)#1,706 |
| 58. | Sidney | 0.074% | 0.048%(+0.026)#58 | 0.071%(+0.003)#1,711 |
| 59. | Rossford | 0.063% | 0.048%(+0.016)#59 | 0.071%(-0.007)#1,807 |
| 60. | Oberlin | 0.061% | 0.048%(+0.013)#60 | 0.071%(-0.010)#1,824 |
| 61. | Norwood | 0.058% | 0.048%(+0.010)#61 | 0.071%(-0.013)#1,851 |
| 62. | Cleveland Heights | 0.058% | 0.048%(+0.010)#62 | 0.071%(-0.013)#1,852 |
| 63. | Chillicothe | 0.055% | 0.048%(+0.007)#63 | 0.071%(-0.016)#1,877 |
| 64. | Cincinnati | 0.047% | 0.048%(-0.001)#64 | 0.071%(-0.024)#1,941 |
| 65. | Worthington | 0.047% | 0.048%(-0.001)#65 | 0.071%(-0.024)#1,946 |
| 66. | Strongsville | 0.043% | 0.048%(-0.004)#66 | 0.071%(-0.027)#1,981 |
| 67. | Willoughby | 0.038% | 0.048%(-0.010)#67 | 0.071%(-0.033)#2,047 |
| 68. | Trotwood | 0.035% | 0.048%(-0.013)#68 | 0.071%(-0.036)#2,068 |
| 69. | Wilmington | 0.032% | 0.048%(-0.016)#69 | 0.071%(-0.039)#2,105 |
| 70. | Cleveland | 0.026% | 0.048%(-0.021)#70 | 0.071%(-0.045)#2,164 |
| 71. | Lima | 0.025% | 0.048%(-0.022)#71 | 0.071%(-0.045)#2,172 |
| 72. | North Olmsted | 0.019% | 0.048%(-0.029)#72 | 0.071%(-0.052)#2,268 |
| 73. | Toledo | 0.018% | 0.048%(-0.030)#73 | 0.071%(-0.053)#2,277 |
| 74. | Canton | 0.016% | 0.048%(-0.032)#74 | 0.071%(-0.055)#2,306 |
| 75. | Parma | 0.012% | 0.048%(-0.035)#75 | 0.071%(-0.058)#2,341 |
| 76. | Akron | 0.0058% | 0.048%(-0.042)#76 | 0.071%(-0.065)#2,388 |
Common Questions
What are the Top 10 Cities with the Highest Percentage of Turkish Population in Ohio?
Top 10 Cities with the Highest Percentage of Turkish Population in Ohio are:
#1
5.51%
#2
2.37%
#3
1.20%
#4
0.91%
#5
0.87%
#6
0.84%
#7
0.77%
#8
0.77%
#9
0.74%
#10
0.72%
What city has the Highest Percentage of Turkish Population in Ohio?
Wharton has the Highest Percentage of Turkish Population in Ohio with 5.51%.
What is the Percentage of Turkish Population in the State of Ohio?
Percentage of Turkish Population in Ohio is 0.048%.
What is the Percentage of Turkish Population in the United States?
Percentage of Turkish Population in the United States is 0.071%.