Cities with the Highest Percentage of Turkish Population in New York
RELATED REPORTS & OPTIONS
Turkish
New York
Compare Cities
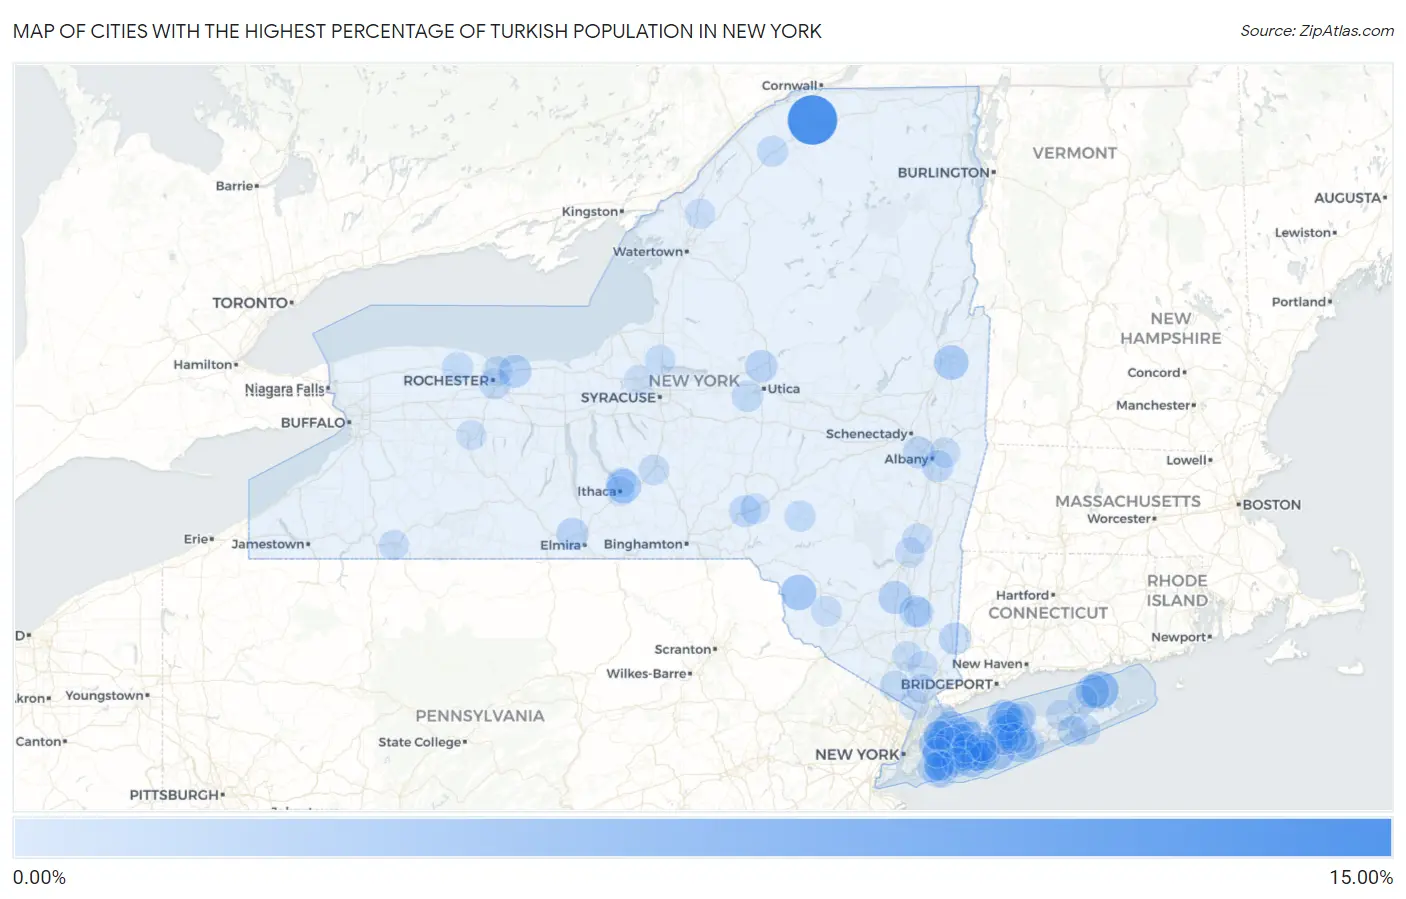
Map of Cities with the Highest Percentage of Turkish Population in New York
0.00%
15.00%
Cities with the Highest Percentage of Turkish Population in New York
| City | Turkish | vs State | vs National | |
| 1. | Winthrop | 11.91% | 0.17%(+11.7)#1 | 0.071%(+11.8)#3 |
| 2. | Orient | 4.51% | 0.17%(+4.33)#2 | 0.071%(+4.44)#11 |
| 3. | Greenvale | 4.12% | 0.17%(+3.95)#3 | 0.071%(+4.05)#16 |
| 4. | Jeffersonville | 3.46% | 0.17%(+3.28)#4 | 0.071%(+3.39)#25 |
| 5. | North New Hyde Park | 3.24% | 0.17%(+3.07)#5 | 0.071%(+3.17)#28 |
| 6. | Locust Valley | 3.16% | 0.17%(+2.98)#6 | 0.071%(+3.09)#29 |
| 7. | Farmingdale | 3.07% | 0.17%(+2.90)#7 | 0.071%(+3.00)#30 |
| 8. | Fort Edward | 3.01% | 0.17%(+2.84)#8 | 0.071%(+2.94)#32 |
| 9. | East Patchogue | 2.96% | 0.17%(+2.78)#9 | 0.071%(+2.89)#33 |
| 10. | East Islip | 2.89% | 0.17%(+2.71)#10 | 0.071%(+2.82)#36 |
| 11. | Amityville | 2.88% | 0.17%(+2.71)#11 | 0.071%(+2.81)#38 |
| 12. | Nesconset | 2.78% | 0.17%(+2.61)#12 | 0.071%(+2.71)#41 |
| 13. | Northeast Ithaca | 2.78% | 0.17%(+2.60)#13 | 0.071%(+2.71)#42 |
| 14. | East Marion | 2.43% | 0.17%(+2.26)#14 | 0.071%(+2.36)#46 |
| 15. | North Lindenhurst | 2.29% | 0.17%(+2.11)#15 | 0.071%(+2.22)#51 |
| 16. | Old Field | 2.25% | 0.17%(+2.08)#16 | 0.071%(+2.18)#52 |
| 17. | New Paltz | 2.16% | 0.17%(+1.99)#17 | 0.071%(+2.09)#57 |
| 18. | Webster | 1.96% | 0.17%(+1.78)#18 | 0.071%(+1.89)#68 |
| 19. | Holland Patent | 1.80% | 0.17%(+1.62)#19 | 0.071%(+1.73)#76 |
| 20. | University Gardens | 1.70% | 0.17%(+1.53)#20 | 0.071%(+1.63)#81 |
| 21. | Putnam Lake | 1.67% | 0.17%(+1.50)#21 | 0.071%(+1.60)#83 |
| 22. | Spackenkill | 1.57% | 0.17%(+1.39)#22 | 0.071%(+1.50)#103 |
| 23. | North Bellmore | 1.54% | 0.17%(+1.37)#23 | 0.071%(+1.47)#107 |
| 24. | Big Flats | 1.54% | 0.17%(+1.37)#24 | 0.071%(+1.47)#108 |
| 25. | Westmere | 1.54% | 0.17%(+1.36)#25 | 0.071%(+1.47)#109 |
| 26. | Sidney | 1.44% | 0.17%(+1.27)#26 | 0.071%(+1.37)#114 |
| 27. | South Huntington | 1.39% | 0.17%(+1.21)#27 | 0.071%(+1.32)#122 |
| 28. | East Greenbush | 1.31% | 0.17%(+1.13)#28 | 0.071%(+1.24)#132 |
| 29. | Miller Place | 1.31% | 0.17%(+1.13)#29 | 0.071%(+1.24)#134 |
| 30. | Farmingville | 1.23% | 0.17%(+1.05)#30 | 0.071%(+1.15)#145 |
| 31. | West Babylon | 1.22% | 0.17%(+1.05)#31 | 0.071%(+1.15)#146 |
| 32. | Terryville | 1.22% | 0.17%(+1.05)#32 | 0.071%(+1.15)#147 |
| 33. | West Hills | 1.19% | 0.17%(+1.01)#33 | 0.071%(+1.12)#156 |
| 34. | Centereach | 1.18% | 0.17%(+1.00)#34 | 0.071%(+1.11)#158 |
| 35. | Brighton | 1.16% | 0.17%(+0.988)#35 | 0.071%(+1.09)#162 |
| 36. | Milton Cdp Saratoga County | 1.12% | 0.17%(+0.943)#36 | 0.071%(+1.05)#168 |
| 37. | Clinton | 1.09% | 0.17%(+0.915)#37 | 0.071%(+1.02)#177 |
| 38. | Brookhaven | 1.09% | 0.17%(+0.911)#38 | 0.071%(+1.01)#179 |
| 39. | Canton | 1.05% | 0.17%(+0.874)#39 | 0.071%(+0.978)#189 |
| 40. | Delhi | 1.02% | 0.17%(+0.842)#40 | 0.071%(+0.946)#192 |
| 41. | Clarkson | 1.02% | 0.17%(+0.841)#41 | 0.071%(+0.945)#193 |
| 42. | Poquott | 0.99% | 0.17%(+0.819)#42 | 0.071%(+0.923)#202 |
| 43. | Wesley Hills | 0.93% | 0.17%(+0.756)#43 | 0.071%(+0.860)#218 |
| 44. | Vassar College | 0.90% | 0.17%(+0.722)#44 | 0.071%(+0.826)#231 |
| 45. | Northville | 0.87% | 0.17%(+0.700)#45 | 0.071%(+0.804)#240 |
| 46. | Munsons Corners | 0.86% | 0.17%(+0.684)#46 | 0.071%(+0.787)#245 |
| 47. | Elmont | 0.79% | 0.17%(+0.618)#47 | 0.071%(+0.722)#269 |
| 48. | Rye | 0.78% | 0.17%(+0.604)#48 | 0.071%(+0.707)#276 |
| 49. | Central Square | 0.77% | 0.17%(+0.595)#49 | 0.071%(+0.699)#283 |
| 50. | Southampton | 0.76% | 0.17%(+0.584)#50 | 0.071%(+0.688)#288 |
| 51. | North Babylon | 0.74% | 0.17%(+0.570)#51 | 0.071%(+0.674)#293 |
| 52. | Islandia | 0.73% | 0.17%(+0.554)#52 | 0.071%(+0.658)#305 |
| 53. | Hampton Bays | 0.72% | 0.17%(+0.546)#53 | 0.071%(+0.649)#307 |
| 54. | Monticello | 0.71% | 0.17%(+0.531)#54 | 0.071%(+0.635)#312 |
| 55. | Levittown | 0.70% | 0.17%(+0.526)#55 | 0.071%(+0.630)#316 |
| 56. | West Islip | 0.70% | 0.17%(+0.524)#56 | 0.071%(+0.628)#319 |
| 57. | Babylon | 0.70% | 0.17%(+0.523)#57 | 0.071%(+0.627)#321 |
| 58. | East Atlantic Beach | 0.68% | 0.17%(+0.505)#58 | 0.071%(+0.608)#327 |
| 59. | Oyster Bay Cove | 0.67% | 0.17%(+0.495)#59 | 0.071%(+0.599)#331 |
| 60. | Stony Brook | 0.66% | 0.17%(+0.489)#60 | 0.071%(+0.593)#338 |
| 61. | Glasco | 0.66% | 0.17%(+0.481)#61 | 0.071%(+0.585)#348 |
| 62. | Germantown | 0.66% | 0.17%(+0.481)#62 | 0.071%(+0.585)#349 |
| 63. | Wynantskill | 0.65% | 0.17%(+0.477)#63 | 0.071%(+0.581)#351 |
| 64. | Unadilla | 0.63% | 0.17%(+0.460)#64 | 0.071%(+0.564)#357 |
| 65. | Baywood | 0.63% | 0.17%(+0.452)#65 | 0.071%(+0.556)#363 |
| 66. | Highland Falls | 0.62% | 0.17%(+0.444)#66 | 0.071%(+0.548)#368 |
| 67. | Long Beach | 0.62% | 0.17%(+0.442)#67 | 0.071%(+0.545)#370 |
| 68. | Baxter Estates | 0.61% | 0.17%(+0.435)#68 | 0.071%(+0.539)#376 |
| 69. | Medford | 0.61% | 0.17%(+0.432)#69 | 0.071%(+0.536)#378 |
| 70. | Cold Spring Harbor | 0.60% | 0.17%(+0.430)#70 | 0.071%(+0.533)#379 |
| 71. | Piermont | 0.60% | 0.17%(+0.424)#71 | 0.071%(+0.528)#385 |
| 72. | Oceanside | 0.59% | 0.17%(+0.416)#72 | 0.071%(+0.520)#391 |
| 73. | Allegany | 0.59% | 0.17%(+0.415)#73 | 0.071%(+0.518)#393 |
| 74. | Hewlett Bay Park | 0.57% | 0.17%(+0.392)#74 | 0.071%(+0.496)#411 |
| 75. | Lansing | 0.55% | 0.17%(+0.376)#75 | 0.071%(+0.480)#421 |
| 76. | Sound Beach | 0.55% | 0.17%(+0.371)#76 | 0.071%(+0.474)#425 |
| 77. | Theresa | 0.54% | 0.17%(+0.369)#77 | 0.071%(+0.473)#426 |
| 78. | Ronkonkoma | 0.54% | 0.17%(+0.362)#78 | 0.071%(+0.465)#430 |
| 79. | Irondequoit | 0.53% | 0.17%(+0.359)#79 | 0.071%(+0.463)#434 |
| 80. | Syosset | 0.53% | 0.17%(+0.352)#80 | 0.071%(+0.456)#441 |
| 81. | Southold | 0.52% | 0.17%(+0.342)#81 | 0.071%(+0.446)#444 |
| 82. | Holtsville | 0.52% | 0.17%(+0.341)#82 | 0.071%(+0.445)#446 |
| 83. | Port Washington North | 0.50% | 0.17%(+0.330)#83 | 0.071%(+0.434)#451 |
| 84. | Hewlett | 0.50% | 0.17%(+0.326)#84 | 0.071%(+0.430)#455 |
| 85. | Crompond | 0.50% | 0.17%(+0.323)#85 | 0.071%(+0.427)#457 |
| 86. | Ithaca | 0.49% | 0.17%(+0.320)#86 | 0.071%(+0.424)#462 |
| 87. | Belle Terre | 0.49% | 0.17%(+0.319)#87 | 0.071%(+0.422)#464 |
| 88. | Baldwinsville | 0.49% | 0.17%(+0.316)#88 | 0.071%(+0.420)#468 |
| 89. | Hewlett Harbor | 0.47% | 0.17%(+0.294)#89 | 0.071%(+0.398)#494 |
| 90. | Old Westbury | 0.45% | 0.17%(+0.279)#90 | 0.071%(+0.383)#515 |
| 91. | North Massapequa | 0.45% | 0.17%(+0.276)#91 | 0.071%(+0.380)#521 |
| 92. | Old Bethpage | 0.45% | 0.17%(+0.275)#92 | 0.071%(+0.379)#522 |
| 93. | Briarcliff Manor | 0.45% | 0.17%(+0.272)#93 | 0.071%(+0.375)#526 |
| 94. | Bellmore | 0.43% | 0.17%(+0.258)#94 | 0.071%(+0.362)#549 |
| 95. | Inwood | 0.43% | 0.17%(+0.256)#95 | 0.071%(+0.360)#554 |
| 96. | Geneseo | 0.43% | 0.17%(+0.253)#96 | 0.071%(+0.357)#557 |
| 97. | Floral Park | 0.42% | 0.17%(+0.247)#97 | 0.071%(+0.351)#565 |
| 98. | Red Oaks Mill | 0.41% | 0.17%(+0.237)#98 | 0.071%(+0.340)#578 |
| 99. | East Setauket | 0.41% | 0.17%(+0.236)#99 | 0.071%(+0.340)#580 |
| 100. | Deer Park | 0.41% | 0.17%(+0.236)#100 | 0.071%(+0.339)#581 |
Common Questions
What are the Top 10 Cities with the Highest Percentage of Turkish Population in New York?
Top 10 Cities with the Highest Percentage of Turkish Population in New York are:
#1
11.91%
#2
4.51%
#3
4.12%
#4
3.46%
#5
3.24%
#6
3.16%
#7
3.07%
#8
3.01%
#9
2.96%
#10
2.89%
What city has the Highest Percentage of Turkish Population in New York?
Winthrop has the Highest Percentage of Turkish Population in New York with 11.91%.
What is the Percentage of Turkish Population in the State of New York?
Percentage of Turkish Population in New York is 0.17%.
What is the Percentage of Turkish Population in the United States?
Percentage of Turkish Population in the United States is 0.071%.