Cities with the Highest Percentage of Turkish Population in Georgia

RELATED REPORTS & OPTIONS

Turkish
Population
Families and Households
Female Fertility
Female Fertility (Unmarried)
Race (Community Size)
Race (Percentage)
Ancestry (Community Size)
AfghanAfricanAlaska NativeAlaskan AthabascanAlbanianAleutAlsatianAmericanApacheArabArapahoArgentineanArmenianAssyrian / Chaldean / SyriacAustralianAustrianBahamianBangladeshiBarbadianBasqueBelgianBelizeanBermudanBhutaneseBlackfeetBolivianBrazilianBritishBritish West IndianBulgarianBurmeseCajunCambodianCanadianCape VerdeanCarpatho RusynCelticCentral AmericanCentral American IndianCherokeeCheyenneChickasawChileanChineseChippewaChoctawColombianColvilleComancheCosta RicanCreeCreekCroatianCrowCubanCypriotCzechCzechoslovakianDanishDelawareDominicanDutchDutch West IndianEastern EuropeanEcuadorianEgyptianEnglishEstonianEthiopianEuropeanFijianFilipinoFinnishFrenchFrench American IndianFrench CanadianGermanGerman RussianGhanaianGreekGuamanian / ChamorroGuatemalanGuyaneseHaitianHmongHonduranHopiHoumaHungarianIcelanderIndian (Asian)IndonesianInupiatIranianIraqiIrishIroquoisIsraeliItalianJamaicanJapaneseJordanianKenyanKiowaKoreanLaotianLatvianLebaneseLiberianLithuanianLumbeeLuxembourgerMacedonianMalaysianMalteseMarshalleseMenomineeMexicanMexican American IndianMongolianMoroccanNative HawaiianNavajoNepaleseNew ZealanderNicaraguanNigerianNorthern EuropeanNorwegianOkinawanOsageOttawaPaiutePakistaniPalestinianPanamanianParaguayanPennsylvania GermanPeruvianPimaPolishPortuguesePotawatomiPuebloPuerto RicanPuget Sound SalishRomanianRussianSalvadoranSamoanScandinavianScotch-IrishScottishSeminoleSenegaleseSerbianShoshoneSierra LeoneanSiouxSlavicSlovakSloveneSomaliSouth AfricanSouth AmericanSouth American IndianSoviet UnionSpaniardSpanishSpanish AmericanSpanish American IndianSri LankanSubsaharan AfricanSudaneseSwedishSwissSyrianTaiwaneseThaiTlingit-HaidaTohono O'OdhamTonganTrinidadian and TobagonianTsimshianTurkishU.S. Virgin IslanderUgandanUkrainianUruguayanUteVenezuelanVietnameseWelshWest IndianYakamaYaquiYugoslavianYumanYup'ikZimbabwean
Ancestry (Percentage)
AfghanAfricanAlaska NativeAlaskan AthabascanAlbanianAleutAlsatianAmericanApacheArabArapahoArgentineanArmenianAssyrian / Chaldean / SyriacAustralianAustrianBahamianBangladeshiBarbadianBasqueBelgianBelizeanBermudanBhutaneseBlackfeetBolivianBrazilianBritishBritish West IndianBulgarianBurmeseCajunCambodianCanadianCape VerdeanCarpatho RusynCelticCentral AmericanCentral American IndianCherokeeCheyenneChickasawChileanChineseChippewaChoctawColombianColvilleComancheCosta RicanCreeCreekCroatianCrowCubanCypriotCzechCzechoslovakianDanishDelawareDominicanDutchDutch West IndianEastern EuropeanEcuadorianEgyptianEnglishEstonianEthiopianEuropeanFijianFilipinoFinnishFrenchFrench American IndianFrench CanadianGermanGerman RussianGhanaianGreekGuamanian / ChamorroGuatemalanGuyaneseHaitianHmongHonduranHopiHoumaHungarianIcelanderIndian (Asian)IndonesianInupiatIranianIraqiIrishIroquoisIsraeliItalianJamaicanJapaneseJordanianKenyanKiowaKoreanLaotianLatvianLebaneseLiberianLithuanianLumbeeLuxembourgerMacedonianMalaysianMalteseMarshalleseMenomineeMexicanMexican American IndianMongolianMoroccanNative HawaiianNavajoNepaleseNew ZealanderNicaraguanNigerianNorthern EuropeanNorwegianOkinawanOsageOttawaPaiutePakistaniPalestinianPanamanianParaguayanPennsylvania GermanPeruvianPimaPolishPortuguesePotawatomiPuebloPuerto RicanPuget Sound SalishRomanianRussianSalvadoranSamoanScandinavianScotch-IrishScottishSeminoleSenegaleseSerbianShoshoneSierra LeoneanSiouxSlavicSlovakSloveneSomaliSouth AfricanSouth AmericanSouth American IndianSoviet UnionSpaniardSpanishSpanish AmericanSpanish American IndianSri LankanSubsaharan AfricanSudaneseSwedishSwissSyrianTaiwaneseThaiTlingit-HaidaTohono O'OdhamTonganTrinidadian and TobagonianTsimshianTurkishU.S. Virgin IslanderUgandanUkrainianUruguayanUteVenezuelanVietnameseWelshWest IndianYakamaYaquiYugoslavianYumanYup'ikZimbabwean
Immigrant Origin (Total)
AfghanistanAfricaAlbaniaArgentinaArmeniaAsiaAustraliaAustriaAzoresBahamasBangladeshBarbadosBelarusBelgiumBelizeBoliviaBosnia and HerzegovinaBrazilBulgariaBurma / MyanmarCabo VerdeCambodiaCameroonCanadaCaribbeanCentral AmericaChileChinaColombiaCongoCosta RicaCroatiaCubaCzechoslovakiaDenmarkDominicaDominican RepublicEastern AfricaEastern AsiaEastern EuropeEcuadorEgyptEl SalvadorEnglandEritreaEthiopiaEuropeFijiFranceGermanyGhanaGreeceGrenadaGuatemalaGuyanaHaitiHondurasHong KongHungaryIndiaIndonesiaIranIraqIrelandIsraelItalyJamaicaJapanJordanKazakhstanKenyaKoreaKuwaitLaosLatin AmericaLatviaLebanonLiberiaLithuaniaMalaysiaMexicoMicronesiaMiddle AfricaMoldovaMoroccoNepalNetherlandsNicaraguaNigeriaNorth MacedoniaNorthern AfricaNorthern EuropeNorwayOceaniaPakistanPanamaPeruPhilippinesPolandPortugalRomaniaRussiaSaudi ArabiaScotlandSenegalSerbiaSierra LeoneSingaporeSomaliaSouth AfricaSouth AmericaSouth Central AsiaSouth Eastern AsiaSouthern EuropeSpainSri LankaSt. Vincent and the GrenadinesSudanSwedenSwitzerlandSyriaTaiwanThailandTrinidad and TobagoTurkeyUgandaUkraineUruguayUzbekistanVenezuelaVietnamWest IndiesWestern AfricaWestern AsiaWestern EuropeYemenZaireZimbabwe
Immigrant Origin (Percentage)
AfghanistanAfricaAlbaniaArgentinaArmeniaAsiaAustraliaAustriaAzoresBahamasBangladeshBarbadosBelarusBelgiumBelizeBoliviaBosnia and HerzegovinaBrazilBulgariaBurma / MyanmarCabo VerdeCambodiaCameroonCanadaCaribbeanCentral AmericaChileChinaColombiaCongoCosta RicaCroatiaCubaCzechoslovakiaDenmarkDominicaDominican RepublicEastern AfricaEastern AsiaEastern EuropeEcuadorEgyptEl SalvadorEnglandEritreaEthiopiaEuropeFijiFranceGermanyGhanaGreeceGrenadaGuatemalaGuyanaHaitiHondurasHong KongHungaryIndiaIndonesiaIranIraqIrelandIsraelItalyJamaicaJapanJordanKazakhstanKenyaKoreaKuwaitLaosLatin AmericaLatviaLebanonLiberiaLithuaniaMalaysiaMexicoMicronesiaMiddle AfricaMoldovaMoroccoNepalNetherlandsNicaraguaNigeriaNorth MacedoniaNorthern AfricaNorthern EuropeNorwayOceaniaPakistanPanamaPeruPhilippinesPolandPortugalRomaniaRussiaSaudi ArabiaScotlandSenegalSerbiaSierra LeoneSingaporeSomaliaSouth AfricaSouth AmericaSouth Central AsiaSouth Eastern AsiaSouthern EuropeSpainSri LankaSt. Vincent and the GrenadinesSudanSwedenSwitzerlandSyriaTaiwanThailandTrinidad and TobagoTurkeyUgandaUkraineUruguayUzbekistanVenezuelaVietnamWest IndiesWestern AfricaWestern AsiaWestern EuropeYemenZaireZimbabwe
Income
Income (Families)
Income (Households)
Poverty
Poverty (Families)
Unemployment
Employment Occupations
Employment Industries
Employer Class
Commute Time
Commute Means
School Enrollment
Education by Degree Field
Occupancy
Finances
Physical Characteristics
Georgia
Compare Cities
Comparison Subject

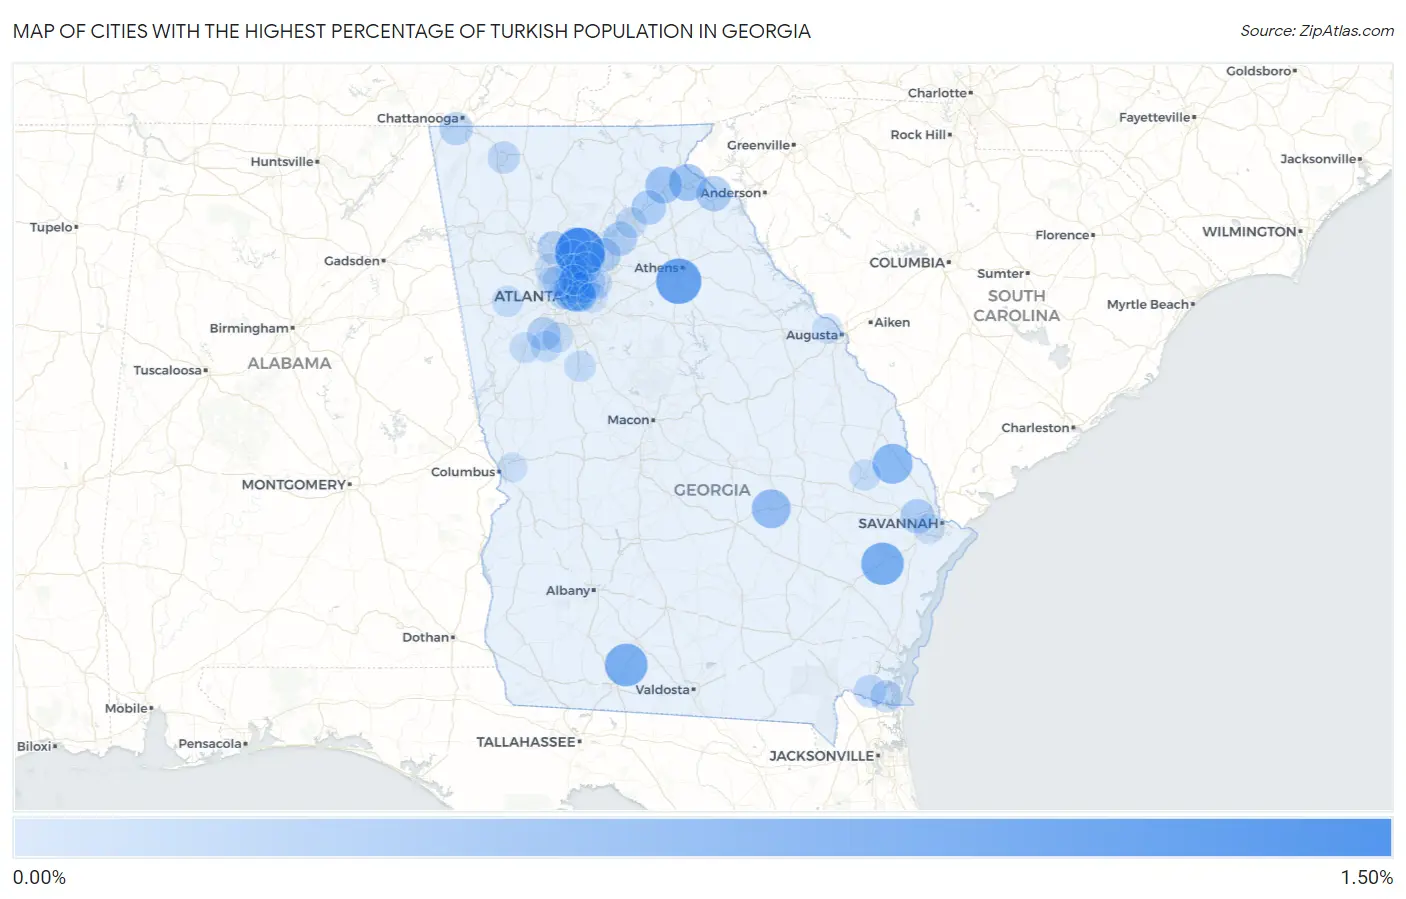
Map of Cities with the Highest Percentage of Turkish Population in Georgia

0.00%
1.50%
Cities with the Highest Percentage of Turkish Population in Georgia Map

Cities with the Highest Percentage of Turkish Population in Georgia

City Turkish vs State vs National
1.Alpharetta1.42%0.047%(+1.37)#10.071%(+1.35)#116
2.Watkinsville1.10%0.047%(+1.05)#20.071%(+1.03)#174
3.Coolidge0.90%0.047%(+0.856)#30.071%(+0.832)#227
4.Walthourville0.89%0.047%(+0.840)#40.071%(+0.817)#236
5.Oliver0.70%0.047%(+0.652)#50.071%(+0.629)#317
6.Druid Hills0.67%0.047%(+0.626)#60.071%(+0.602)#329
7.Mount Vernon0.62%0.047%(+0.575)#70.071%(+0.551)#364
8.Toccoa0.49%0.047%(+0.439)#80.071%(+0.415)#475
9.Demorest0.48%0.047%(+0.432)#90.071%(+0.409)#480
10.Decatur0.45%0.047%(+0.407)#100.071%(+0.384)#512
11.Gumlog0.36%0.047%(+0.314)#110.071%(+0.291)#655
12.Lula0.31%0.047%(+0.265)#120.071%(+0.242)#738
13.Bloomingdale0.31%0.047%(+0.260)#130.071%(+0.236)#750
14.North Druid Hills0.30%0.047%(+0.249)#140.071%(+0.225)#771
15.Flowery Branch0.28%0.047%(+0.231)#150.071%(+0.208)#806
16.Suwanee0.27%0.047%(+0.226)#160.071%(+0.202)#821
17.Tyrone0.23%0.047%(+0.186)#170.071%(+0.163)#919
18.Lookout Mountain0.22%0.047%(+0.176)#180.071%(+0.152)#955
19.Chamblee0.20%0.047%(+0.153)#190.071%(+0.129)#1,026
20.Milton0.19%0.047%(+0.148)#200.071%(+0.124)#1,047
21.Roswell0.19%0.047%(+0.141)#210.071%(+0.118)#1,067
22.Woodstock0.19%0.047%(+0.140)#220.071%(+0.117)#1,076
23.Kingsland0.18%0.047%(+0.130)#230.071%(+0.107)#1,116
24.Tucker0.17%0.047%(+0.123)#240.071%(+0.100)#1,150
25.Dalton0.15%0.047%(+0.104)#250.071%(+0.081)#1,242
26.St Marys0.15%0.047%(+0.104)#260.071%(+0.081)#1,244
27.Bemiss0.14%0.047%(+0.096)#270.071%(+0.073)#1,282
28.Athens-Clarke County Unified Government (Balance)0.13%0.047%(+0.088)#280.071%(+0.064)#1,315
29.Dunwoody0.13%0.047%(+0.085)#290.071%(+0.061)#1,329
30.Clarkston0.12%0.047%(+0.076)#300.071%(+0.053)#1,374
31.Mountain Park0.11%0.047%(+0.065)#310.071%(+0.042)#1,436
32.Sandy Springs0.099%0.047%(+0.052)#320.071%(+0.028)#1,513
33.Johns Creek0.099%0.047%(+0.051)#330.071%(+0.028)#1,519
34.Peachtree City0.096%0.047%(+0.049)#340.071%(+0.026)#1,543
35.Atlanta0.091%0.047%(+0.044)#350.071%(+0.021)#1,576
36.Griffin0.085%0.047%(+0.038)#360.071%(+0.014)#1,614
37.Statesboro0.081%0.047%(+0.034)#370.071%(+0.011)#1,647
38.Villa Rica0.081%0.047%(+0.033)#380.071%(+0.010)#1,654
39.Belvedere Park0.069%0.047%(+0.021)#390.071%(-0.002)#1,769
40.Gainesville0.068%0.047%(+0.020)#400.071%(-0.003)#1,777
41.Newnan0.066%0.047%(+0.018)#410.071%(-0.005)#1,797
42.Marietta0.057%0.047%(+0.010)#420.071%(-0.014)#1,858
43.Fayetteville0.047%0.047%(+0.000)#430.071%(-0.023)#1,936
44.Smyrna0.041%0.047%(-0.006)#440.071%(-0.030)#2,003
45.Savannah0.033%0.047%(-0.014)#450.071%(-0.038)#2,086
46.Vinings0.031%0.047%(-0.016)#460.071%(-0.040)#2,113
47.Martinez0.027%0.047%(-0.021)#470.071%(-0.044)#2,162
48.Peachtree Corners0.019%0.047%(-0.028)#480.071%(-0.052)#2,263
49.Brookhaven0.014%0.047%(-0.033)#490.071%(-0.057)#2,322
50.Augusta-Richmond County Consolidated Government (Balance)0.013%0.047%(-0.034)#500.071%(-0.057)#2,331
51.Redan0.0096%0.047%(-0.038)#510.071%(-0.061)#2,362
52.Columbus0.0015%0.047%(-0.046)#520.071%(-0.069)#2,410

Common Questions

What are the Top 10 Cities with the Highest Percentage of Turkish Population in Georgia?
Top 10 Cities with the Highest Percentage of Turkish Population in Georgia are:
#1
1.42%
#2
1.10%
#3
0.90%
#4
0.89%
#5
0.70%
#6
0.67%
#7
0.62%
#8
0.49%
#9
0.48%
#10
0.45%
What city has the Highest Percentage of Turkish Population in Georgia?
Alpharetta has the Highest Percentage of Turkish Population in Georgia with 1.42%.
What is the Percentage of Turkish Population in the State of Georgia?
Percentage of Turkish Population in Georgia is 0.047%.
What is the Percentage of Turkish Population in the United States?
Percentage of Turkish Population in the United States is 0.071%.