Cities with the Highest Percentage of Turkish Population in Illinois
RELATED REPORTS & OPTIONS
Turkish
Illinois
Compare Cities
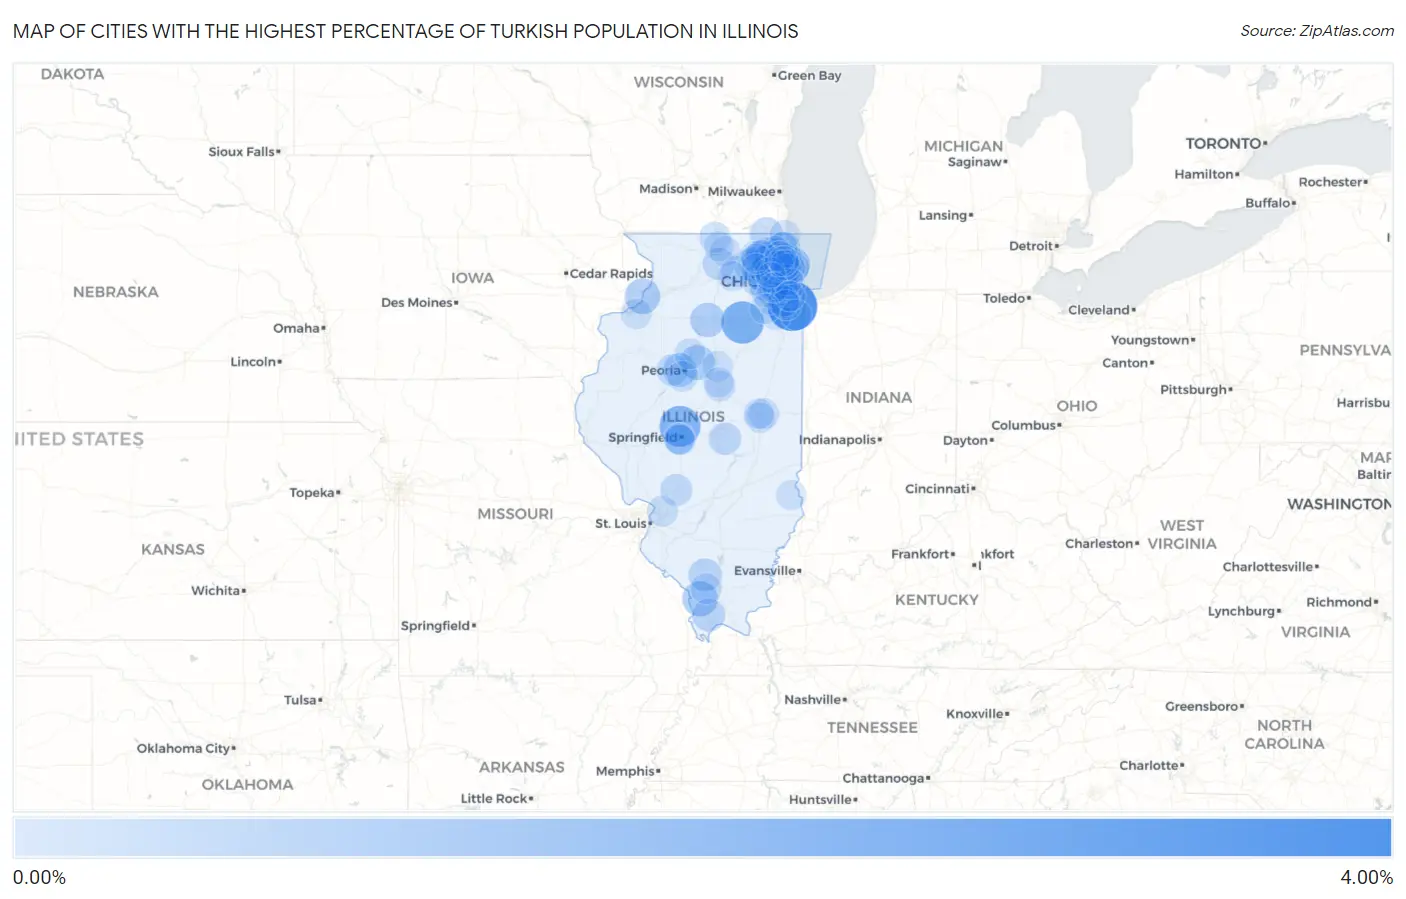
Map of Cities with the Highest Percentage of Turkish Population in Illinois
0.00%
4.00%
Cities with the Highest Percentage of Turkish Population in Illinois
| City | Turkish | vs State | vs National | |
| 1. | Flossmoor | 3.93% | 0.060%(+3.87)#1 | 0.071%(+3.86)#19 |
| 2. | Seneca | 2.46% | 0.060%(+2.40)#2 | 0.071%(+2.39)#45 |
| 3. | Cantrall | 2.16% | 0.060%(+2.10)#3 | 0.071%(+2.09)#58 |
| 4. | Kenilworth | 1.46% | 0.060%(+1.40)#4 | 0.071%(+1.39)#113 |
| 5. | Cordova | 1.08% | 0.060%(+1.02)#5 | 0.071%(+1.00)#182 |
| 6. | Alto Pass | 1.05% | 0.060%(+0.990)#6 | 0.071%(+0.979)#188 |
| 7. | East Dundee | 0.98% | 0.060%(+0.922)#7 | 0.071%(+0.911)#206 |
| 8. | Metamora | 0.96% | 0.060%(+0.900)#8 | 0.071%(+0.889)#213 |
| 9. | North Barrington | 0.93% | 0.060%(+0.870)#9 | 0.071%(+0.859)#219 |
| 10. | Dalzell | 0.88% | 0.060%(+0.820)#10 | 0.071%(+0.809)#239 |
| 11. | Bellevue | 0.78% | 0.060%(+0.723)#11 | 0.071%(+0.712)#273 |
| 12. | Lake Bluff | 0.78% | 0.060%(+0.717)#12 | 0.071%(+0.706)#277 |
| 13. | Elkville | 0.61% | 0.060%(+0.551)#13 | 0.071%(+0.540)#374 |
| 14. | Countryside | 0.60% | 0.060%(+0.541)#14 | 0.071%(+0.530)#383 |
| 15. | Evanston | 0.58% | 0.060%(+0.515)#15 | 0.071%(+0.505)#401 |
| 16. | Channel Lake | 0.56% | 0.060%(+0.501)#16 | 0.071%(+0.490)#414 |
| 17. | Dongola | 0.56% | 0.060%(+0.499)#17 | 0.071%(+0.488)#415 |
| 18. | Carol Stream | 0.49% | 0.060%(+0.427)#18 | 0.071%(+0.416)#471 |
| 19. | Schiller Park | 0.47% | 0.060%(+0.414)#19 | 0.071%(+0.403)#486 |
| 20. | Mount Zion | 0.46% | 0.060%(+0.404)#20 | 0.071%(+0.393)#501 |
| 21. | Monroe Center | 0.43% | 0.060%(+0.375)#21 | 0.071%(+0.364)#545 |
| 22. | Pingree Grove | 0.43% | 0.060%(+0.371)#22 | 0.071%(+0.360)#553 |
| 23. | Winfield | 0.42% | 0.060%(+0.362)#23 | 0.071%(+0.351)#564 |
| 24. | Westchester | 0.42% | 0.060%(+0.359)#24 | 0.071%(+0.349)#566 |
| 25. | Schaumburg | 0.39% | 0.060%(+0.326)#25 | 0.071%(+0.315)#616 |
| 26. | Vernon Hills | 0.37% | 0.060%(+0.314)#26 | 0.071%(+0.303)#634 |
| 27. | Mount Olive | 0.37% | 0.060%(+0.313)#27 | 0.071%(+0.302)#636 |
| 28. | Hanna City | 0.35% | 0.060%(+0.293)#28 | 0.071%(+0.282)#670 |
| 29. | Warrenville | 0.32% | 0.060%(+0.263)#29 | 0.071%(+0.252)#717 |
| 30. | Wilmette | 0.32% | 0.060%(+0.257)#30 | 0.071%(+0.246)#727 |
| 31. | Gilberts | 0.28% | 0.060%(+0.221)#31 | 0.071%(+0.210)#802 |
| 32. | Orland Hills | 0.28% | 0.060%(+0.218)#32 | 0.071%(+0.207)#809 |
| 33. | Glencoe | 0.27% | 0.060%(+0.213)#33 | 0.071%(+0.202)#820 |
| 34. | Rockton | 0.27% | 0.060%(+0.207)#34 | 0.071%(+0.196)#838 |
| 35. | Naperville | 0.24% | 0.060%(+0.184)#35 | 0.071%(+0.173)#887 |
| 36. | Sycamore | 0.24% | 0.060%(+0.177)#36 | 0.071%(+0.166)#903 |
| 37. | Geneva | 0.23% | 0.060%(+0.174)#37 | 0.071%(+0.163)#916 |
| 38. | Jerome | 0.23% | 0.060%(+0.168)#38 | 0.071%(+0.157)#936 |
| 39. | Wayne | 0.22% | 0.060%(+0.165)#39 | 0.071%(+0.154)#949 |
| 40. | Urbana | 0.20% | 0.060%(+0.139)#40 | 0.071%(+0.128)#1,031 |
| 41. | Carbondale | 0.20% | 0.060%(+0.135)#41 | 0.071%(+0.124)#1,046 |
| 42. | Romeoville | 0.19% | 0.060%(+0.130)#42 | 0.071%(+0.119)#1,066 |
| 43. | Deerfield | 0.19% | 0.060%(+0.128)#43 | 0.071%(+0.117)#1,074 |
| 44. | North Pekin | 0.18% | 0.060%(+0.125)#44 | 0.071%(+0.114)#1,089 |
| 45. | Hoffman Estates | 0.18% | 0.060%(+0.120)#45 | 0.071%(+0.109)#1,108 |
| 46. | Chillicothe | 0.18% | 0.060%(+0.120)#46 | 0.071%(+0.109)#1,111 |
| 47. | Edwardsville | 0.18% | 0.060%(+0.117)#47 | 0.071%(+0.106)#1,121 |
| 48. | Hinsdale | 0.17% | 0.060%(+0.115)#48 | 0.071%(+0.104)#1,127 |
| 49. | Highland Park | 0.17% | 0.060%(+0.112)#49 | 0.071%(+0.101)#1,141 |
| 50. | Trout Valley | 0.17% | 0.060%(+0.109)#50 | 0.071%(+0.098)#1,159 |
| 51. | Bloomington | 0.16% | 0.060%(+0.096)#51 | 0.071%(+0.085)#1,214 |
| 52. | Coal Valley | 0.15% | 0.060%(+0.092)#52 | 0.071%(+0.081)#1,239 |
| 53. | Wood Dale | 0.15% | 0.060%(+0.091)#53 | 0.071%(+0.080)#1,245 |
| 54. | Woodridge | 0.14% | 0.060%(+0.081)#54 | 0.071%(+0.070)#1,292 |
| 55. | Northfield | 0.14% | 0.060%(+0.080)#55 | 0.071%(+0.069)#1,294 |
| 56. | El Paso | 0.14% | 0.060%(+0.080)#56 | 0.071%(+0.069)#1,295 |
| 57. | Lake Zurich | 0.14% | 0.060%(+0.077)#57 | 0.071%(+0.066)#1,307 |
| 58. | Leland Grove | 0.14% | 0.060%(+0.075)#58 | 0.071%(+0.065)#1,314 |
| 59. | Barrington | 0.13% | 0.060%(+0.074)#59 | 0.071%(+0.063)#1,324 |
| 60. | Arlington Heights | 0.13% | 0.060%(+0.072)#60 | 0.071%(+0.061)#1,331 |
| 61. | Streamwood | 0.13% | 0.060%(+0.069)#61 | 0.071%(+0.058)#1,345 |
| 62. | Westmont | 0.13% | 0.060%(+0.068)#62 | 0.071%(+0.057)#1,351 |
| 63. | Clarendon Hills | 0.13% | 0.060%(+0.067)#63 | 0.071%(+0.056)#1,352 |
| 64. | Savoy | 0.13% | 0.060%(+0.067)#64 | 0.071%(+0.056)#1,355 |
| 65. | Bridgeview | 0.12% | 0.060%(+0.064)#65 | 0.071%(+0.053)#1,370 |
| 66. | Lake In The Hills | 0.12% | 0.060%(+0.061)#66 | 0.071%(+0.050)#1,384 |
| 67. | Elk Grove Village | 0.12% | 0.060%(+0.060)#67 | 0.071%(+0.049)#1,390 |
| 68. | Riverside | 0.12% | 0.060%(+0.059)#68 | 0.071%(+0.048)#1,395 |
| 69. | La Grange | 0.12% | 0.060%(+0.058)#69 | 0.071%(+0.047)#1,406 |
| 70. | North Chicago | 0.12% | 0.060%(+0.057)#70 | 0.071%(+0.046)#1,414 |
| 71. | Manhattan | 0.11% | 0.060%(+0.055)#71 | 0.071%(+0.044)#1,423 |
| 72. | Mundelein | 0.11% | 0.060%(+0.054)#72 | 0.071%(+0.043)#1,427 |
| 73. | Oak Park | 0.11% | 0.060%(+0.050)#73 | 0.071%(+0.039)#1,455 |
| 74. | Crete | 0.11% | 0.060%(+0.047)#74 | 0.071%(+0.036)#1,476 |
| 75. | Mount Prospect | 0.11% | 0.060%(+0.047)#75 | 0.071%(+0.036)#1,477 |
| 76. | Morton Grove | 0.10% | 0.060%(+0.040)#76 | 0.071%(+0.030)#1,505 |
| 77. | Springfield | 0.097% | 0.060%(+0.037)#77 | 0.071%(+0.026)#1,532 |
| 78. | Skokie | 0.097% | 0.060%(+0.037)#78 | 0.071%(+0.026)#1,536 |
| 79. | Champaign | 0.095% | 0.060%(+0.035)#79 | 0.071%(+0.024)#1,554 |
| 80. | Belvidere | 0.095% | 0.060%(+0.035)#80 | 0.071%(+0.024)#1,556 |
| 81. | Chicago | 0.091% | 0.060%(+0.031)#81 | 0.071%(+0.020)#1,578 |
| 82. | Winthrop Harbor | 0.090% | 0.060%(+0.030)#82 | 0.071%(+0.019)#1,585 |
| 83. | Cary | 0.089% | 0.060%(+0.030)#83 | 0.071%(+0.019)#1,587 |
| 84. | Normal | 0.087% | 0.060%(+0.027)#84 | 0.071%(+0.016)#1,599 |
| 85. | Elgin | 0.084% | 0.060%(+0.024)#85 | 0.071%(+0.013)#1,619 |
| 86. | Orland Park | 0.084% | 0.060%(+0.024)#86 | 0.071%(+0.013)#1,621 |
| 87. | Roselle | 0.083% | 0.060%(+0.023)#87 | 0.071%(+0.012)#1,632 |
| 88. | Robinson | 0.071% | 0.060%(+0.011)#88 | 0.071%(-0.000)#1,752 |
| 89. | Wheeling | 0.070% | 0.060%(+0.010)#89 | 0.071%(-0.001)#1,761 |
| 90. | Lincolnshire | 0.063% | 0.060%(+0.003)#90 | 0.071%(-0.008)#1,808 |
| 91. | Dekalb | 0.059% | 0.060%(-0.001)#91 | 0.071%(-0.012)#1,842 |
| 92. | Glenview | 0.058% | 0.060%(-0.001)#92 | 0.071%(-0.012)#1,846 |
| 93. | Tinley Park | 0.058% | 0.060%(-0.002)#93 | 0.071%(-0.013)#1,854 |
| 94. | Glendale Heights | 0.051% | 0.060%(-0.008)#94 | 0.071%(-0.019)#1,900 |
| 95. | Downers Grove | 0.050% | 0.060%(-0.010)#95 | 0.071%(-0.021)#1,910 |
| 96. | Loves Park | 0.048% | 0.060%(-0.012)#96 | 0.071%(-0.023)#1,926 |
| 97. | Alsip | 0.048% | 0.060%(-0.012)#97 | 0.071%(-0.023)#1,931 |
| 98. | Algonquin | 0.047% | 0.060%(-0.013)#98 | 0.071%(-0.024)#1,942 |
| 99. | Northbrook | 0.046% | 0.060%(-0.014)#99 | 0.071%(-0.025)#1,954 |
| 100. | Joliet | 0.040% | 0.060%(-0.020)#100 | 0.071%(-0.031)#2,016 |
Common Questions
What are the Top 10 Cities with the Highest Percentage of Turkish Population in Illinois?
Top 10 Cities with the Highest Percentage of Turkish Population in Illinois are:
#1
3.93%
#2
2.46%
#3
2.16%
#4
1.46%
#5
1.08%
#6
1.05%
#7
0.98%
#8
0.96%
#9
0.93%
#10
0.88%
What city has the Highest Percentage of Turkish Population in Illinois?
Flossmoor has the Highest Percentage of Turkish Population in Illinois with 3.93%.
What is the Percentage of Turkish Population in the State of Illinois?
Percentage of Turkish Population in Illinois is 0.060%.
What is the Percentage of Turkish Population in the United States?
Percentage of Turkish Population in the United States is 0.071%.